Metabolic Status of “Metabolically Normal Obese” Subjects or “MNO”
*Corresponding Author(s):
Ghouini AFaculty Of Medicine Of Blida, University Of Blida, Algeria
Tel:+ 213 773839184,
Email:ghouinia@yahoo.fr
Abstract
Metabolic status is dependent on the anthropometric profile; indeed, many obese subjects are "metabolically normal" (MNO or Metabolically Normal Obese) while conversely, other obese or even non-obese subjects are "metabolically abnormal". The topography and the function of the fatty deposits seem to play a determining role in explaining this apparent paradox. In this study are examined the carbohydrate, lipid and liver balance of overweight subjects according to their anthropometric indices. It turns out that generalized obesity where the distribution of fat is diffuse as well as gynoid obesity (gluteo-femoral) are correlated at an almost normal metabolic profile compared to android obesity characterized by the metabolic dysregulations.
INTRODUCTION
Obesity, a chronic disease, is a major risk factor for the development of health problems such as hypertension, dyslipidemia, cardiovascular disease, type 2 diabetes and several types of cancer. Indeed, the World Health Organization (WHO) defines obesity as "an abnormal excess of adipose mass having harmful effects on health" [1,2]. For clinical practice, as for epidemiological studies, the reference method is the calculation of the Body Mass Index (BMI): weight (kg) / height (m2). Obesity is defined by a BMI value greater than 30 kg/m². Obesity can also be defined by a weight ≥ 120% of the theoretical weight determined according to Lorentz's formula: P (kg) = height (cm) - [100 - (size-150 a) where a = 4 in men and 2 in women [3,4]. The prevalence of obesity is increasing rapidly, with an epidemic trend in incidence in many countries, making it a major public health problem. The prevalence of obesity almost tripled globally between 1975 and 2016 [5]. In Algeria, the Tahina (2007) survey on obesity reveals that more than 24.37% of subjects aged between 50 and 54 are obese and 21.65% in subjects aged between 55 and 59. Among the types of obesity, the "Metabolically Normal Obese" or MNO form seems less exposed to complications associated with other forms of obesity [6]. By definition, MNO subjects have a BMI > 30 kg/m², but BMI does not take into account body composition in fat and lean mass. Therefore, it is not a sufficiently relevant parameter for the diagnosis and evaluation of subjects at risk of cardiovascular and metabolic complications, and for the determination of the need for preventive treatment or not in the latter [7]. Measuring waist circumference is a good indicator of the size of visceral adipose tissue and, therefore, a good predictor of insulin sensitivity, metabolic syndrome, and cardiovascular risk factors. The waist-to-hip ratio or WHR (reflection of peripheral fat) and the waist-to-hip ratio (reflection of muscle mass) represent other clinical parameters of interest in assessing metabolic risk [8]. In light of these data and given the scale of this real epidemic and its harmful consequences on health, we want to study the metabolic profile of overweight subjects knowing that certain obesities escape metabolic dysregulations and do not present a risk for health.
PATIENTS AND METHODS
Our prospective study of the group of descriptive studies, carried out during 2019, focused on 104 (among a pool of 111 subjects; 7 patients were eliminated because they had not carried out all the investigations) overweight patients followed at the level of public hospitals in Bechar and Blida. These are women aged between 20 and 50 years, divided according to their waist / hip ratio (WHR), in 3 groups:
- Group 1 (n = 35) (37-2): WHR > 1
- Group 2 (n = 32) (37-5): WHR < 0.70
- Group 3 (n = 37): WHR < 0.85
*inclusion criteria: overweight BMI > 30, age> 20 and < 50 years
*exclusion criteria: age < 20 years, pregnant women, menopause and associated endocrine pathology.
METHODS
The patients underwent:
- a food survey: evaluation of the quantitative and qualitative food intakes, determination of the rhythm of the meals and the mode of consumption (3-day method);
- a clinical examination by anthropometric measurements: weight gain, height, blood pressure measurement;
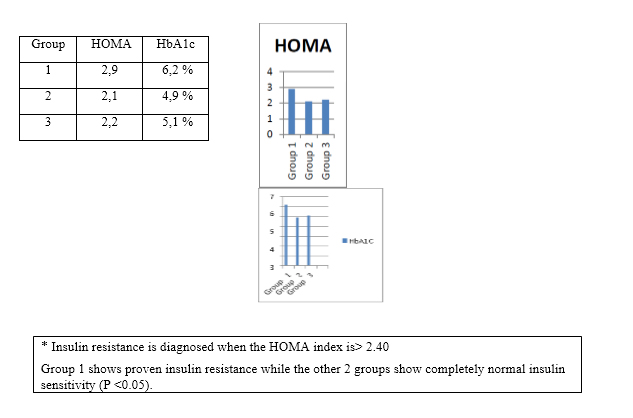
- biological tests: fasting blood glucose and insulin dosage and calculation of the HOMA (Homeostasis Model Assessment) insulin resistance index, according to Mathews' formula (glucose x insulin / 22.5), hemoglobin A1C and cholesterol dosage, HDL-C and LDL-C, triglycerides as well as the hepatic assessment (assay of ASAT and ALAT transaminases). The Statistical Package of Social Science (SPSS 17.0) software was used for the statistical study. The statistical significance of the parameters was judged by the Student test.
RESULTS
It has been observed
a) Carbohydrate metabolism:
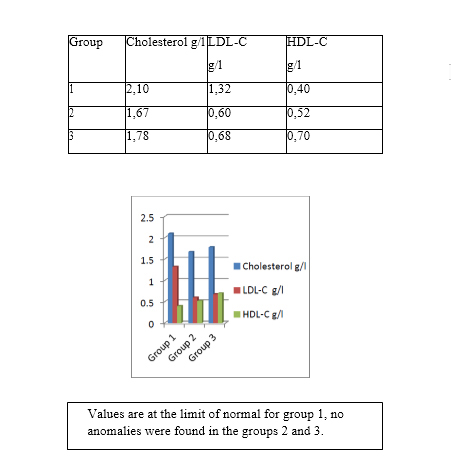
b) Lipid metabolism:
c) Liver enzymes: No anomaly was noted with regard to the rates of AST and ALT in the 3 groups.
DISCUSSION
Subjects belonging to groups 2 and 3 without obesity of the android type WHR <0.85) have a better sensitivity to insulin than obese subjects whose WHR is > 1, this is demonstrated by plasma levels lower fasting glucose and insulin. The subjects of group 3 represent the category of patients with gluteo-femoral obesity exposed mainly to osteo-articular complications whereas the patients belonging to group 2 free from insulin resistance seem to represent a population belonging to the entity of "MNO »In the distribution of fat mass is generalized and homogeneous in the upper and lower parts of the body. Subjects in groups 2 and 3 have a favorable lipid profile with normal plasma levels of triglycerides and HDL cholesterol than obese women in group 1 who seem to be more exposed to dylipidemic complications. Obese subjects without metabolic syndrome do not have type 2 diabetes or the cardiovascular risk factors associated with central obesity. However, the increase in BMI is significantly correlated with an increased LDL cholesterol concentration, but not with blood sugar or the concentration of insulin. Two independent studies have reported that MNO subjects have highly sensitive serum CRP (hs-CRP) levels, significantly lower than in obese subjects with metabolic disturbances. Furthermore, in one of these studies, the concentration of interleukin 6 and, in the other, that of alpha-1 antitrypsin were also lowered, arguing for a more favorable inflammatory profile in MNO subjects. The assay of hs-CRP could therefore contribute to the identification of the MNO phenotype, if the value is normal despite the presence of obesity [9]. Other parameters which are no less important and which do not fall within the definition of metabolic syndrome have been identified and differentiate MNO individuals from those at risk. These are: a favorable liver enzyme profile with normal levels of AST, ALT. However, our work has not shown any disturbance of the liver balance in the 3 groups studied, which does not allow us to hypothesize about the increased risk in obesities of the Android type compared to MNOs or gynoid obesities. Compared to obese metabolically abnormal subjects, MNO subjects have approximately 50% less visceral adipose tissue measured by abdominal computed tomography (CT) or MRI, despite a corpulence identical to other obese subjects at metabolic risk. However, the amount of visceral fat remains relatively large in MNO subjects. In addition, obese subjects with an MNO phenotype have a higher proportion of subcutaneous abdominal adipose tissue, greater localized fat mass in the lower limbs and greater thickness of the tricipital skin fold [10].
Obese women with relatively low visceral fat mass are more sensitive to insulin than obese women with more visceral fat. But in this study, women who have a lower visceral fat rate also have a lower BMI of 2.5 kg/m2 compared to women with a higher visceral fat rate. Even if this difference is not significant, it can nevertheless influence the results [11].
In another study from South Africa, obese black women with an MNO phenotype have low visceral adipose tissue mass and a low visceral fat / gluteo-femoral fat mass ratio [12]. Despite their obesity, MNO subjects, by definition, do not have metabolic disorders and are characterized by good sensitivity to insulin. According to Karelis et al., the predominant elements to take into account to explain this "curiosity" are the location of the fat mass (which explains 22% of variations in insulin sensitivity) as well as the size and the number of dependent fat cells the age at which obesity develops (explaining 13% of variations in insulin sensitivity) [13]. According to Reaven, the interindividual variability of insulin sensitivity is explained for 25% by differences in the quantity of adipose tissue and, as already mentioned, for 25% by variations in the level of physical activity.
Although Reaven attaches little importance to the distribution of fat mass, the MNO subjects are the illustration that insulin sensitivity (and the metabolic profile which accompanies it) is a function of the localization of fat rather than the total amount of fat mass [14]. Visceral adipose tissue, much more than subcutaneous adipose tissue, is strongly associated with a deleterious metabolic profile, even after adjustment for standard anthropometric indices.
The significant role of fat distribution in metabolic repercussions and, more particularly, the deleterious role of visceral adipose tissue are currently recognized. In fact, in the pathophysiological analysis of the MNO phenotype, we can hypothesize that intra-abdominal fat plays a deleterious role and / or that peripheral subcutaneous fat (gluteo-femoral) plays a protective role against -vis the occurrence of metabolic abnormalities. The pathophysiological mechanisms involved in the genesis of the MNO phenotype are not yet fully understood. In addition to the role assigned to adiponectin, sex hormones could also influence the metabolic risk in relation to obesity. The android and peri-visceral distribution of adipose tissue (rather than peripheral) as well as adipocytic hypertrophy (rather than hyperplasia) are the basis of the endocrino-metabolic disturbances found in the metabolic syndrome [15]. The question that has emerged recently is whether visceral fat or intrahepatic fat plays the most important deleterious role. It is certain that an excess of fat, and in particular visceral fat, affects insulin sensitivity. However, with increased total adiposity, factors other than visceral fat can modify insulin sensitivity, such as those regulating lipogenesis and lipid oxidation in the liver and muscles.
Numerous studies have demonstrated the dominant role of fatty liver in disorders of the regulation of glucose and lipid metabolism. Significant accumulation of fat in the liver, regardless of visceral adiposity, is accompanied by atherosclerosis and metabolic syndrome. This was recently confirmed in a study comparing MNO subjects and obese subjects at metabolic risk. In this work, obese subjects are characterized, obviously, by a total fat mass and a visceral fat mass than those of subjects without excess weight. However, if we compare obese MNO and obese at metabolic risk, these two parameters are not significantly different. It is not the same with regard to the deposition of ectopic fat in the liver, since the value is two times lower in MNO subjects than in subjects with metabolic abnormalities (4.3 versus 9.5%,) [16]. In MNO, the liver is not flooded by an omental flow of fatty acids, which are the basis of the intra cytoplasmic accumulation of lipids, and steatosis is negligible: in this context, disturbances in lipid and carbohydrate metabolism are absent or minimal, hence the MNO phenotype [17]. A morphotype with wide hips is associated with a lower prevalence of reduced glucose tolerance (or type 2 diabetes), dyslipidemia and high blood pressure, regardless of age, BMI and lap of size. An accumulation of peripheral fat, characterized by a lower waist / hip ratio, is associated with a high plasma adiponectin level, good insulin sensitivity and a more favorable lipid profile (total cholesterol level and lower triglycerides and higher HDL cholesterol). The gluteo-femoral fat would therefore have a cardio-protective role. However, the relationship between peripheral fat and low cardiovascular and metabolic risk (and conversely between visceral fat and high cardio-metabolic risk) cannot be explained by insulin sensitivity alone.
Three main interpretations have been put forward to explain a possible protective effect of peripheral fat mass:
• the specific characteristics of gluteo-femoral subcutaneous fat;
• the peculiarities of the associated muscle topography;
• higher adiponectin
Gluteo-femoral fat, preferably of the hyperplastic type, has its own metabolic characteristics, with a high activity of lipoprotein lipase and a low lipolytic activity. Consequently, this localization of adipose tissue could protect the liver and the muscles from great exposure to free fatty acids, thanks to its great capacity for capturing and storing fatty acids in the form of triglycerides. Regional differences in adipocyte metabolism are more marked in women than in men. This could explain why, for example, there is an inverse relationship between thigh circumference and blood sugar in women, but not in men [18]. In addition, subjects with large hips and thighs have a greater amount of muscle mass in the lower limbs. As the skeletal striated muscle is the tissue capable of using the most glucose under the action of insulin, we can hypothesize that this characteristic contributes to maintaining a good sensitivity to insulin. In addition, a lower waist-to-hip ratio has been associated with a lower proportion of Type IIb muscle fibers and higher capillary density in the thigh, two factors that could also help increase glucose transport and therefore insulin sensitivity. The association between hip measurement and carbohydrate metabolism can be explained, in women, by variations in gluteal fat mass and, in men, mainly by variations in muscle mass.
Adiponectin could also play a role in the pathophysiology of the MNO phenotype. This adipocyte hormone increases the insulin sensitivity of the liver and skeletal striated muscles. Obese insulin- sensitive subjects have significantly higher adiponectin levels than obese insulin-resistant subjects, regardless of BMI and waist circumference. Adiponectin levels are higher in MNOs characterized by better insulin sensitivity. In addition, it has been reported that some obese subjects have adiponectin levels comparable to those of normal weight subjects, and it is precisely they who exhibit the MNO phenotype [19].
Finally, another hypothesis mentioned is that the gynoid distribution of fat could be the consequence (and not the cause) of a high sensitivity to insulin, since the latter promotes the accumulation of peripheral rather than abdominal fat. When the excess energy is transformed into subcutaneous fatty deposits or burned in the mitochondria of the skeletal striated muscles, the "insulin-sensitive" subject, despite a positive energy balance, will be protected against the development of metabolic and cardiovascular complications [20]. In the current state of knowledge, even if this hypothesis cannot be rejected, it is much less often mentioned than the other, playing a causal role in the distribution of fat mass. Estrogens stimulate an accumulation of subcutaneous fat in the gluteo-femoral deposits in women, thus promoting the gynoid distribution of adipose tissue. They exert their effects by modulating the activity of the lipoprotein-lipase of this tissue. In addition, estrogens improve the lipid profile (increase in HDL cholesterol, decrease in triglycerides and LDL cholesterol). Conversely, relatively high levels of androgens in women are associated with android fat distribution and insulin resistance. This profile is more often objectified after menopause. Women with polycystic ovary syndrome combine hyperinsulinism and hyperandrogenism, abnormalities associated with various metabolic disturbances. MNO women are therefore more likely to be recruited from pre-menopausal women who are more likely to be characterized by an optimal ostrogenic climate [21]. In a study carried out on an American population of 2902 subjects, and in which the phenotype MNO was defined on the one hand on the absence of metabolic syndrome and on the other hand on the presence of a sensitivity to insulin (HOMA- IR), the authors report an increased risk of developing type 2 diabetes only with HOMA when MNO subjects are compared to metabolically healthy normal weight individuals [22]. In a second study of approximately 4000 participants in which the MNO phenotype is defined from the definition of IDF, a risk of developing type 2 diabetes of 2.09 in MNO individuals was reported compared to metabolically healthy normal weight subjects [23]. All of these studies have also shown that the increased risk of T2D in individuals with the MNO phenotype was less than in obese at risk.
CONCLUSION
The distribution of fat, in the overweight subject, is a determinant of the metabolic profile. Gluteo-femoral obesity and generalized obesity are exposed to less risk of metabolic complications; among these, the MNO form “metabolically normal obese” is protective. MNO subjects have a lower waist / hip or waist / thigh ratio than obese individuals with metabolic abnormalities. They therefore have obesity rather gynoid than android, with a normal or barely increased rate of visceral adiposity which can be appreciated by measuring the WHR or by the measurement of the waist, in clinical routine.
Computed tomography and magnetic resonance imaging can be used to assess body composition, and to locate and quantify tissue adipose whether it is abdominal perivisceral, in a subcutaneous position or inside organs such as the liver or muscular. These evaluation methods allow both reliable and reproducible precise measurements of different types of adipose tissue regardless of their location. The main limitation of use of these techniques in clinical routine lies in their lack of availability for this type of measures as well as in the delivery of a significant X-ray dose for tomography and data acquisition times long enough for MRI.
REFERENCES
- Ciangura C, Poitou-Bernert C (2011) Complications des obésité EMC (Elsevier Masson SAS, Paris), Endocrinologie-Nutrition, 10-506-E-10, 2011.
- Haute autorité de santé HAS (2011) Surpoids et obésité de l’adulte: prise en charge médicale de premier recours. Recommandations pour la pratique clinique. 2011
- Lebacq T (2015) Anthropométrie (IMC, tour de taille et ratio tour de taille/taille). Dans : Lebacq.T, Toppers. E (éd). Enquête de consommation alimentaire 2014-2015-Rapport 1. WIT-ISP, Bruxelles, 2015.
- Organisation mondiale de la santé (1995) L’adulte en excès pondéral: l’utilisation et interprétation de l’anthropomé Rapport d’un comité d’experts. Genève, série de rapports techniques 854: 348-383.
- Karelis AD, St-Pierre DH, Conus F, Rabasa-Lhoret R, Poehlman ET (2004) Metabolic and body composition factors in subgroups of obesity : what do we know? J Clin Endocrinol Metab 89: 2569-2575.
- Ford ES (2005) Prevalence of the metabolic syndrome defined by the International Diabetes Federation among adults in the U.S. Diabetes Care 28: 2745-2749.
- World Health Organization (1998) Obesity: preventing and managing the global epidemic. Report of a Who consultation on obesity, 3-5 June 1997 [WHO / NUT / NCD / 98.1]. Geneva: World Health Organization, 1998.
- Park YW, Zhu S, Palaniappan L, Heshka S, Carnethon MR, et al. (2003) The metabolic syndrome: prevalence and associated risk factor findings in the US population from the Third National Health and Nutrition Examination Survey, 1988- 1994. Arch Intern Med 163: 427-436.
- Kelishadi R, Cook SR, Esmaeil MM, MehdiGouya M, Ardalan G, et al. (2008) Metabolically obese normal weight and phenotypically obese metabolically normal youths: the CASPIAN study. J Am Diet Assoc 108: 82-90.
- Ruderman N, Chisholm D, Pi-Sunyer X, Schneider S (1998) The metabolically obese, normal-weight individual revisited. Diabetes 47: 699-713.
- Votruba SB, Jensen MD (2011) Insulin sensitivity and regional fat gain in response to overfeeding. Obesity (Silver Spring) 19: 269-275.
- Sims EA (2001) Are there persons who are obese, but metabolically healthy? Metabolism 50: 1499-1504.
- Karelis AD (2008) Metabolically healthy but obese individuals. Lancet 372: 1281-1283.
- Scheen AJ (2007) Evaluation de l’insulinosécrétion et de l’insulinosensibilité chez l’homme. Thérapie 62: 311-318.
- Stefan N, Kantartzis K, Machann J, Schick F, Thamer C, et al. (2008) Identification and characterization of metabolically benign obesity in humans. Arch Intern Med 168: 1609-1616.
- Wildman RP, Muntner P, Reynolds K, McGinn AP, Rajpathak S, et al. (2008) The obese without cardiometabolic risk factor clustering and the normal weight with cardiometabolic risk factor clustering. Prevalence and correlates of 2 phenotypes among the US population (NHANES 1999-2004). Arch Intern Med 168: 1617-1624.
- Ferré P (2004) Adiponectine : de l’adipocyte au muscleAdiponectin: from adipocyte to skeletal muscle. Annales d'Endocrinologie 65: 36-43.
- Ahl S, Guenther M, Zhao S, James R, Marks J, et al. (2015) Adiponectin Levels Differentiate Metabolically Healthy vs Unhealthy Among Obese and Nonobese White Individuals. J Clin Endocrinol Metab 100: 4172-4180.
- Lacquemant C, Vasseur F, Lepretre F, Froguel P (2003) Cytokines d’origine adipocytaire, obésité et développement du diabè Med Sci (Paris) 19: 8-9.
- Stefan N, Vozarova B, Funahashi T, Matsuzawa Y, Weyer C, et al. (2002) Plasma adiponectin concentration is associated with skeletal muscle insulin receptor tyrosine phosphorylation, and low plasma concentration precedes a decrease in whole-body insulin sensitivity in humans. Diabetes 51: 1884-1888.
- Brochu M, Tchernof A, Dionne IJ, Sites CK, Eltabbakh GH, et al. (2001) What are the physical characteristics associated with a normal metabolic profile despite a high level of obesity in post menopausal women? J Clin Endocrinol Metab 86: 1020-1025.
- Meigs JB, Wilson PWF, Fox CS, Vasan RS, Nathan DM, et al. (2006) Body mass index, metabolic syndrome, and risk of type 2 diabetes or cardiovascular disease. J Clin Endocrinol Metab 91: 2906-2912.
- Rorive M, Letiexhe MR, Scheen AJ, Ziegler O (2005) Obésité et diabète de type 2. Rev Med Liège 60: 374-382.
Citation: Djoghlaf DEH, Belhabchi A, Ghouini A (2020) Metabolic Status of “Metabolically Normal Obese” Subjects or “MNO”. Int J Case Rep Ther Stud 2: 009.
Copyright: © 2020 Djoghlaf DEH, et al. This is an open-access article distributed under the terms of the Creative Commons Attribution License, which permits unrestricted use, distribution, and reproduction in any medium, provided the original author and source are credited.