Morphological Variation among and Discriminating Traits of Kersting’s Groundnut Accessions
*Corresponding Author(s):
Eric E AgoyiNon-Timber Forest Products And Orphan Crop Species Unit, Laboratory Of Applied Ecology, Faculty Of Agronomic Sciences, University Of Abomey-Calavi, Tri Postal, Cotonou, Benin
Tel:+229 97989745/95199055,
Email:ericagoyi@gmail.com
Abstract
Kersting’s groundnut [Macrotyloma geocarpum(Harms) Maréchal & Baudet] (KG) is a nutritious subterranean grain legume in West and Central Africa. Limited information is available on the morphological traits that discriminate accessions, limiting the use of appropriate breeding strategies. This study aimed to identify discriminating traits and assess diversity among accessions of Kersting’s groundnut. Eighty-one KG accessions from Benin and Burkina Faso were evaluated based on 29 qualitative and quantitative traits. Experiment was conducted as an Alpha lattice design with three replications. Standardized Shannon-Weaver index (H') and descriptive statistics were calculated for qualitative traits. Pearson correlation coefficients, stepwise discriminant analysis, principal component analysis, cluster analysis and canonical discriminant analysis were conducted. Results showed that accessions varied greatly based on growth-habit (H'= 0.68), flower-color (H' = 0.50), seed-eye shape (H' = 0.47), and stem pigmentation (H' = 0.41). Eight quantitative traits, viz.,seed width, seed thickness, number of branches per plant, petiole length, days to 50% flowering, number of seeds per pod, pod-width, and pod-length, were found to significantly discriminate the accessions. Accessions were grouped into three clusters based on quantitative traits. Cluster 1 had accessions with late flowering and good vegetative growth, cluster 2 had accessions with high germination percentage and cluster 3 had accessions with high yield performance. Seed-length varied greatly among accessions, thus indicating the potential for improving yield via seed size.
Keywords
Descriptors, diversity, Kersting’s groundnut,Macrotyloma geocarpum, orphan crops
Introduction
Orphan crops, also known as forgotten or abandoned crops, traditional or underdeveloped crops [1], are crop species that have received only limited attention from researchers. However, most orphan crops are highly nutritious, climate resilient [2], and resistant to commonly occurring crop diseases [3]. Thus, orphan crops can potentially contribute toward food security and nutritional security, and should receive greater research attention.
Kersting’s groundnut [Macrotyloma geocarpum(Harms) Maréchal & Baudet)] is a multipurpose legume crop grown in West Africa and Central Africa [4,5], where it is endemic. It is reportedly an orphan and underutilized crop species [6,7] that thrives well in semi-arid zones with annual rainfall below 600 mm [8]. Kersting’s groundnut has high nutritional value; 21.3 g of protein per 100 g of grains [9]. The seed is a rich source of crude protein with high levels of essential amino acids, such as phenylalanine (3.2/100 g), histidine (2.1/100 g), lysine and methionine [9]. Seeds have high vitamin content [10]. According to Adazebra [11], Kersting’s groundnut is one of the less-known leguminous crops, but it contributes significantly toward rural nutrition, livelihoods and sustainable development. Highly appreciated in urban areas of Benin, the crop has a high market value, it is the most expensive grain legume in West Africa, costing up to US $ 5-7 per kilogram [12]. Despite its nutritional and economic importance, Kersting’s groundnut cultivation continues to decline in West African countries because of constraints, such as low yield, non-availability of improved varieties, poor storage ability of the grains, and high labor requirements for production [13]. It is not a priority crop for governments and researchers [7,11,14].
Agro-morphological characterization is a key step in assessing genetic diversity to describe and classify germplasm of cultivated plants [15,16]. In assessing agro-morphological diversity of cultivated plants, researchers use descriptors. Descriptors of Kersting’s groundnut have not been described, unlike Bambara groundnut (Vigna subterranea(L.) Verdc.) [17], peanut (Arachis hypogaea L.) [18] and pigeonpea (Cajanus cajan (L.) Millsp.) [19]. Only a few studies have focused on morphological variations in Kersting’s groundnut. Assogba et al., [14] and Akohoue et al., [20] in Benin and Adu-Gyamfi et al., [6] in Ghana and Bayorbor et al., [21] in Nigeria found significant variation for various traits among accessions.
The present study aimed at filling the above-mentioned gaps by i) assessing diversity among a regional germplasm collection obtained from Benin and Burkina Faso, and ii) identifying discriminating traits that could be included in a list of descriptors to be used for morphological characterization of kersting’s groundnut.
Materials And Methods
Study area
The study was carried out at a research station in the Regional Center of Agricultural Research (CRA-CF) in Djidja, village of Djegbatin (7°19'04.362'' N and 1°54'58.914'' E). The climate of Djidja is sub-equatorial and the rainfall is bimodal, with a tendency to a unimodal pattern. The soils are ferralitic, ferruginous and hydromorphic. Rainfall, temperature, sunshine, and relative humidity during the period of experimentation are presented in table 1.
|
Climatic parameter |
August |
September |
October |
November |
December |
|
Rainfall (mm) |
82.5 |
183.2 |
138 |
44.2 |
0 |
|
Sunshine |
141.3 |
160.9 |
201.1 |
250.6 |
243.7 |
|
Relative Humidy |
80 |
79 |
78 |
73 |
63 |
|
Maximum temperature (°C) |
30.3 |
31.2 |
32 |
33.9 |
35.2 |
|
Minimum temperature (°C) |
22.4 |
22.8 |
23.2 |
23.8 |
23.2 |
|
Average temperature (°C) |
26.4 |
27 |
27.6 |
28.9 |
29.2 |
Table 1: Monthly average climatic data recorded on study site during experiment.
Plant material and experimental design
Genetic material consisted of a collection of 81 accessions, of which 70 were from Benin and 11 from Burkina Faso (Table 2). Planting was done on 23rd August, 2018. The experiment was conducted as an Alpha lattice design, with 9 plots per block × 9 blocks and three replications. Each plot consisted of three rows, each 4.5 m in length. The rows were spaced 0.75 m apart. Plant-to-plant spacing was 0.30 m, giving a plant population of 44500 plants per hectare. Distance between plots was 1 m. One seed was sown per hill at a depth of 5 cm. No fertilizer was applied and weeding was done manually 3 weeks, 7 weeks and 12 weeks after sowing.
|
N° |
AN† |
|
Seed color |
|
Origin |
|
1 |
BUR 9 |
|
Black seed |
|
Burkina-Faso |
|
2 |
Akl 2 |
|
Cream seed |
|
Benin |
|
3 |
Agn2 |
|
Cream seed |
|
Benin |
|
4 |
Soh |
|
Cream seed |
|
Benin |
|
5 |
Ats |
|
Cream seed |
|
Benin |
|
6 |
Adc |
|
Cream seed |
|
Benin |
|
7 |
Hhg |
|
Cream seed |
|
Benin |
|
8 |
Hou |
|
Cream seed |
|
Benin |
|
9 |
Viv |
|
Cream seed |
|
Benin |
|
10 |
Dkp |
|
Cream seed |
|
Benin |
|
11 |
BUR 13 |
|
Cream seed |
|
Burkina-Faso |
|
12 |
Dgo |
|
Cream seed |
|
Benin |
|
13 |
BUR 14 |
|
Cream seed |
|
Burkina-Faso |
|
14 |
Odm 1 |
|
Cream seed |
|
Benin |
|
15 |
Aso |
|
Cream seed |
|
Benin |
|
16 |
Sag 1 |
|
Cream seed |
|
Benin |
|
17 |
Gbo5 |
|
Cream seed |
|
Benin |
|
18 |
Gbn1 |
|
Cream seed |
|
Benin |
|
19 |
Odm 2 |
|
Cream seed |
|
Benin |
|
20 |
BUR 18 |
|
Black seed |
|
Burkina-Faso |
|
21 |
Lal3 |
|
Cream seed |
|
Benin |
|
22 |
BUR 10 |
|
Cream seed |
|
Burkina-Faso |
|
23 |
Kah 2 |
|
Cream seed |
|
Benin |
|
24 |
Gbo3 |
|
Cream seed |
|
Benin |
|
25 |
Gbo1 |
|
Cream seed |
|
Benin |
|
26 |
Itk 2 |
|
Cream seed |
|
Benin |
|
27 |
Akl 1 |
|
Cream seed |
|
Benin |
|
28 |
Kno 1 |
|
Cream seed |
|
Benin |
|
29 |
Lal2 |
|
Black seed |
|
Benin |
|
30 |
Tow1 |
|
Cream seed |
|
Benin |
|
31 |
BUR 15 |
|
Cream seed |
|
Burkina-Faso |
|
32 |
LeAd1 |
|
Cream seed |
|
Benin |
|
33 |
Itk |
|
Cream seed |
|
Benin |
|
34 |
Kno 2 |
|
Cream seed |
|
Benin |
|
35 |
Add |
|
Cream seed |
|
Benin |
|
36 |
Lam 1 |
|
Cream seed |
|
Benin |
|
37 |
Gbo4 |
|
Brown seed |
|
Benin |
|
38 |
Ena2 |
|
Cream seed |
|
Benin |
|
39 |
Hay 1 |
|
Cream seed |
|
Benin |
|
40 |
Agc |
|
Cream seed |
|
Benin |
|
41 |
Bin |
|
Cream seed |
|
Benin |
|
42 |
Oua |
|
Cream seed |
|
Benin |
|
43 |
Sag 2 |
|
Cream seed |
|
Benin |
|
44 |
Zku |
|
Cream seed |
|
Benin |
|
45 |
BUR 7 |
|
Cream seed |
|
Burkina-Faso |
|
46 |
Ena1 |
|
Cream seed |
|
Benin |
|
47 |
Gbn 2 |
|
Cream seed |
|
Benin |
|
48 |
Itk 1 |
|
Cream seed |
|
Benin |
|
49 |
BUR 8 |
|
Black seed |
|
Burkina-Faso |
|
50 |
Agn1 |
|
Cream seed |
|
Benin |
|
51 |
Zhla3 |
|
Cream seed |
|
Benin |
|
52 |
Tos |
|
Cream seed |
|
Benin |
|
53 |
Lgz |
|
Cream seed |
|
Benin |
|
54 |
Zhla1 |
|
Cream seed |
|
Benin |
|
55 |
Gta1 |
|
Cream seed |
|
Benin |
|
56 |
Dog |
|
Cream seed |
|
Benin |
|
57 |
BUR 12 |
|
Cream seed |
|
Burkina-Faso |
|
58 |
Gbo2 |
|
Cream seed |
|
Benin |
|
59 |
Kin |
|
Cream seed |
|
Benin |
|
60 |
TON |
|
Cream seed |
|
Benin |
|
61 |
Dov |
|
Cream seed |
|
Benin |
|
62 |
Kem |
|
Cream seed |
|
Benin |
|
63 |
Adj |
|
Cream seed |
|
Benin |
|
64 |
Zhla2 |
|
Black seed |
|
Benin |
|
65 |
Ali 1 |
|
Cream seed |
|
Benin |
|
66 |
Ako |
|
Cream seed |
|
Benin |
|
67 |
Hay 2 |
|
Cream seed |
|
Benin |
|
68 |
BUR 16 |
|
Black seed |
|
Burkina-Faso |
|
69 |
LeAd2 |
|
Black seed |
|
Benin |
|
70 |
Kah 1 |
|
Cream seed |
|
Benin |
|
71 |
Zke |
|
Cream seed |
|
Benin |
|
72 |
Dra |
|
Cream seed |
|
Benin |
|
73 |
Bod |
|
Cream seed |
|
Benin |
|
74 |
Agb |
|
Cream seed |
|
Benin |
|
75 |
Sem2 |
|
Cream seed |
|
Benin |
|
76 |
MLK |
|
Cream seed |
|
Benin |
|
77 |
Sem1 |
|
Cream seed |
|
Benin |
|
78 |
Atc |
|
Cream seed |
|
Benin |
|
79 |
Fol |
|
Cream seed |
|
Benin |
|
80 |
BUR 3 |
|
Cream seed |
|
Burkina-Faso |
|
81 |
Gta3 |
|
Cream seed |
|
Benin |
Table 2: Name, seed color and origin of Kersting’s groundnut accessions used in this study.
Data collection and analysis
Seventeen quantitative traits [germination percentage, number of leaves per plant, number of flowers per plant, number of pods per plant, yield, number of branches per plant, days to 50% flowering, 100-seed weight, seed length, seed width, seed thickness, leaf length, leaf width, petiole length, pod length, pod width, and number of seeds per pod and 12 qualitative traits were evaluated (Table 3).
|
Qualitatives traits |
|
Levels of qualitative traits |
|
|
Growth habit |
|
Erect |
|
|
|
Semi- erect |
||
|
|
Prostrate |
||
|
Stem pigmentation |
|
Present |
|
|
|
Absent |
||
|
Terminal leaflet shape |
|
Suborbicular |
|
|
|
Oblong-eliptic |
||
|
Leaflet color |
|
Green-dark |
|
|
|
Green-intermediate |
||
|
Flower color |
|
White tinged with purple |
|
|
|
|||
|
|
Greenish white |
||
|
Pod shape |
|
narrow top |
|
|
|
large top |
||
|
Pod color |
|
White |
|
|
|
|||
|
|
White tinged with purple |
||
|
Pod texture |
|
Many grooves |
|
|
|
A few groove |
||
|
Easy Pod detachment |
Yes |
||
|
|
|
||
|
|
|
No |
|
|
Seed shape |
|
Elongated |
|
|
|
Spherical |
||
|
Seed color |
|
Black |
|
|
|
Cream |
||
|
|
red-brown |
||
|
Seed Eye shape |
|
Triangular |
|
|
|
butterfly |
||
Table 3: Qualitative morphological traits evaluated.
The traits measured were adapted from the lists of descriptors of closely related and similar subterranean legume species, such as Bambara groundnut [Vigna subterranea (L.) Verdc] and peanut (Arachis hypogaea L.), described in IPGRI et al., [17] and IBPGR and ICRISAT [18], respectively. Observations were made on 20 randomly selected plants within each plot. Standardized Shannon-Weaver index (H') was calculated for the qualitative traits [22,23]. For the quantitative traits, descriptive statistics (mean, standard deviation, minimum, maximum, coefficient of variation) were calculated.
Although studies have used the standardized Shannon-Weaver diversity index (H’) for both quantitative and qualitative traits [22,23], this study used coefficient of variation for quantitative traits. In fact, the calculation of H’ requires recording continuous data into a set of discrete categories (i.e., binning). However, evidence shows that binning often results in loss of information because of reduction in data points [24,25]. Besides, the choice of the cut-off point and the amplitude of the defined phenotypic classes are totally arbitrary and left to the discretion of the researcher, leading to difficulties in comparing results across studies.
Coefficient of Variation (CV) was computed as the ratio between standard deviation and the mean, multiplied by 100, which was used to assess the level of genetic variation in quantitative traits.
CV = (S/x) *100 [26]
where CV = the Coefficient of Variation, S = the standard deviation and x = the mean.
H' for qualitative traits was calculated in Microsoft Excel based on phenotypic frequencies of each trait to evaluate the variability among accessions using the following formula
 where H' is the standardized Shannon-Weaver diversity index, k is the number of phenotypic classes for a given qualitative trait, n is the frequency of the phenotypic class for each trait and N is the total number of observations.
Analysis of Variance (ANOVA) using a linear mixed model for alpha lattice designs was used to test for differences among accessions for quantitative traits. The linear mixed model used was as follows (genotypes were considered fixed effects and replications and blocks random effects):
 Pearson's correlation was used to examine the relationship between yield and other quantitative traits. Further, quantitative trait data were subjected to stepwise discriminant analysis to determine the traits that best discriminated the accessions. Canonical discriminant analysis was performed to describe seed and flower color based on discriminating traits. Principal Component Analysis (PCA) was performed to determine the patterns of agro-morphological variation. Hierarchical classification was done to group the accessions. Thereafter, descriptive statistics and Analysis of Variance (ANOVA) were used to describe the clusters. All analyses were performed in R software 3.5.2 [28].
Results And Discussion
The standardized Shannon Weaver diversity index (H′) values ranged from 0.16 to 0.68 (Table 4). There was a high level of phenotypic variation among accessions for plant growth habit (H’=0.68) and flower color (H’=0.50). Moderate variation was observed for seed eye shape, easy pod detachment, stem pigmentation and seed coat color. Pod color, terminal leaflet shape, terminal leaflet color, pod shape and pod texture exhibited a relatively low level of variation (Table 4). Growth habit and flowers color could be used as key qualitative descriptors for Kersting’s groundnut.
The majority (73%) of the accessions in the collection exhibited prostrate growth habit. This was insightful and could inform breeding strategies. For instance, Ndiang et al., [29] reported prostrate growth habit as a good yield predictor in Bambara groundnut, a subterranean legume crop similar to Kersting’s groundnut. In addition, all accessions from Burkina Faso had elongated seed (Table 4), which could be used for yield improvement and selection for big seed.
|
Qualitative traits |
|
Levels of variables |
|
Accessions |
||||||||||
|
Benin |
|
Burkina |
|
Collection |
||||||||||
|
Frequency |
Proportion |
H’ |
Frequency |
Proportion |
H’ |
Frequency |
Proportions |
H’ |
||||||
|
Growth habit
|
erect |
5 |
7.14 |
0.67 |
1 |
9.09 |
0.68 |
6 |
7.4 |
0.67 |
||||
|
prostrate |
49 |
70 |
10 |
90.9 |
59 |
72.83 |
||||||||
|
semi- erect |
16 |
22.85 |
0 |
0 |
16 |
19.75 |
||||||||
|
Stem pigmentation
|
Present |
5 |
7.14 |
0.40 |
7 |
63.63 |
0.41 |
12 |
14.81 |
0.40 |
||||
|
Absent |
65 |
92.85 |
4 |
36.36 |
69 |
85.18 |
||||||||
|
Terminal leaflet form
|
Suborbicular |
69 |
98.57 |
0.22 |
9 |
81.81 |
0.23 |
78 |
96.29 |
0.22 |
||||
|
Oblong-eliptic |
1 |
1.42 |
2 |
18.18 |
3 |
3.70 |
||||||||
|
Leaflet color
|
Green-dark |
68 |
97.14 |
0.22 |
10 |
90.9 |
0.23 |
78 |
96.29 |
0.22 |
||||
|
Green-intermediate |
2 |
2.85 |
1 |
9.09 |
3 |
3.70 |
||||||||
|
Flower color
|
White tinted with purple |
6 |
8.57 |
0.50 |
3 |
27.27 |
0.50 |
9 |
11.11 |
0.50 |
||||
|
Greenish white |
64 |
91.42 |
8 |
72.72 |
72 |
88.88 |
||||||||
|
Pod shape
|
narrow top |
68 |
97.14 |
0.22 |
10 |
90.90 |
0.23 |
78 |
96.29 |
0.22 |
||||
|
large top |
2 |
2.85 |
1 |
9.09 |
3 |
3.70 |
||||||||
|
Pod color
|
White |
66 |
94.28 |
0.28 |
11 |
100 |
0.28 |
77 |
95.06 |
0.28 |
||||
|
White tinted withe purple |
4 |
5.71 |
0 |
0 |
4 |
4.93 |
||||||||
|
Pod texture
|
Many grooves |
69 |
98.57 |
0.16 |
10 |
90.90 |
0.16 |
79 |
97.53 |
0.16 |
||||
|
A few grooves |
1 |
1.42 |
1 |
9.09 |
2 |
2.46 |
||||||||
|
Easy Pod detachment
|
Yes |
31 |
44.28 |
0.47 |
6 |
54.54 |
0.46 |
45 |
55.55 |
0.47 |
||||
|
No |
39 |
55.71 |
5 |
45.45 |
36 |
44.44 |
||||||||
|
Seed shape |
Elongated |
67 |
95.71 |
0.22 |
11 |
100 |
0.23 |
78 |
96.29 |
0.22 |
||||
|
Spherical |
3 |
4.28 |
0 |
0 |
3 |
3.7 |
||||||||
|
Seed coat color
|
Black |
3 |
4.28 |
0.32 |
4 |
36,36 |
0.33 |
7 |
8.64 |
0.32 |
||||
|
Cream |
66 |
94.28 |
7 |
63.63 |
73 |
90.12 |
||||||||
|
Brown |
1 |
1.42 |
0 |
0 |
1 |
1.23 |
||||||||
|
Seed Eye shape
|
Irregular |
0 |
0 |
0.47 |
6 |
54.54 |
0.47 |
6 |
7.4 |
0.47 |
||||
|
Triangular |
2 |
2.85 |
4 |
36.36 |
6 |
7.4 |
||||||||
|
|
butterfly |
|
68 |
97.14 |
|
1 |
9.09 |
|
69 |
85.18 |
||||
Table 4: Phenotypic variability observed in accessions based on the calculation of the Standardized Shannon-Weaver index (H’).
Most accessions (88.88%) had greenish-white flowers (Figure 1a) and 11.11% had purple-tinted white flowers (Figure 1b). Similarly, 95.06% of the accessions had white pods (Figure 1c) and only 4.93% had white pods with purple tint (Figure 1d). Three colors of seed coat were observed among the germplasm collection. Most accessions (90.12%) had cream seed coat (Figure 1e), whereas 8.64% had black seed coat (Figure 1f) and 1.23% brown-red seeds (Figure 1g). This result could be explained by the fact that black-seeded and the brown-seeded accessions were rare and produced by a few households at a small scale [30].
Similarly, three variants were observed regarding seed eye shapes. Most accessions (85.18%) had triangular seed eyes (Figure 1i), whereas 7.40% had butterfly-like seed eyes (Figure 1h), and 7.40% had irregular seed eyes (Figure 1j).
 Figure 1: 1a) greenish-white flowers, Fig 1b) purple-tinted white flowers, Fig 1c) white pod Fig 1d) purple tinted-white, Fig 1e) Cream coat seed, Fig 1f) Black coat seed, Fig 1g) brown coat seed, Fig 1h) butterfly shape eyes, Fig 1i) triangular eyes, Fig 1j) irregular eyes.
Grain yield and yield components, such as number of pods, number of flowers and number of branches per plant, showed relatively high coefficients of variation (34.78% - 50.19%) (Table 5). This is consistent with findings from previous studies, which reported high and significant coefficients of variation for number of flower per plant of bambara groundnut [15] cowpea [31], and Kersting’s groundnut [14]. These relatively high CV values are indicative of the existence of substantial diversity among accessions, offering opportunities for yield improvement in the crop. Similarly, the traits, such as number of pods per plant (CV = 50.19%), number of flowers per plant (CV = 49.51%), germination percentage (CV = 37.42%) and grain yield (CV = 57.84%), exhibited relatively high coefficients of variation, suggesting a wide dispersion around the mean for these traits. This is consistent with findings of previous studies on various leguminous crops, where high and significant coefficients of variation were reported for number of flowers per plant in Bambara groundnut [15], in cowpea [30] and Kersting’s groundnut [14]. However, the study showed low variation for seed size (CV= 5.06 %, 4.63 %, and 5.37 % for seed length, width and thickness, respectively). This observation contrasts with the findings of Assogba et al., [14], who assessed diversity among 31 local Kersting’s groundnut accessions and reported higher CV (14.97% and 15.83%) for seed length and width, respectively. Seed size is an important trait for Kersting’s groundnut, since the tiny seeds make harvesting difficult and cause significant yield loss. In fact, harvesting of Kersting’s groundnut is done by hand-picking pods and shelling consists of thrashing dry pods. Hand-picking of pods with tiny seeds is difficult, and the chances of leaving out many pods are high. In addition, tiny seeds lead to increased loss during shelling. The importance of seed size in Kersting’s groundnut has been recognized in previous studies. For instance, Amujoyegbe et al., [32] reported small seed size to be one of the major causes of a decline in Kersting’s groundnut production in Nigeria. Breeding for bigger seeds, in addition to improving yield, would remove women’s drudgery when hand-picking and shelling Kersting’s groundnut pods. Consistent with Assogba et al., [14] [100-seed weight, (10.70 to 14.71 g)] and Akohoue et al., [20] [100-seed weight (7.10 to 16.28 g)], the present study showed significant variation (p < 0.001) for 100-seed weight (8.14 to 18.64 g) (Table 5).
This could be explained by different experimental conditions (climatic and soil conditions), as reported by Khan et al., [33] that accumulation of reserves in seeds depended on the type of genotypes but also climatic factors. In fact, the present study was conducted on a well-watered fallow in the top Kersting’s groundnut-producing area, known as the food basket of southern Benin. Nevertheless, investigations need to be pursued further, with multi-location trials to fully understand the determinants of yield variation in the crop.
|
Descriptors† |
Min |
Max |
Mean ± SE |
CV |
|
PG |
6.98 |
90.7 |
46.37±1.11 |
37.42 |
|
nLe |
21.29 |
132.9 |
65.75±1.27 |
30.05 |
|
nFlw |
3 |
53.8 |
16.47±0.52 |
49.51 |
|
nPd |
12 |
264.86 |
90.32±2.91 |
50.19 |
|
nBrh |
2.3 |
20.8 |
9.51±0.21 |
34.78 |
|
nDFlw |
46 |
56 |
48.83±0.12 |
3.93 |
|
SeWt(g) |
8.14 |
18.64 |
12.92±0.1 |
11.56 |
|
SeL(mm) |
6.91 |
9.69 |
8.21±0.03 |
5.06 |
|
SeW(mm) |
4.74 |
6.42 |
5.68±0.02 |
4.63 |
|
Sth (mm) |
3.33 |
4.92 |
4.26±0.01 |
5.37 |
|
LeL(mm) |
52.71 |
77.96 |
65.75±0.26 |
6.19 |
|
LeW (mm) |
38.03 |
57 |
48.66±0.23 |
7.37 |
|
PeL(mm) |
81.04 |
208.83 |
143.38±1.32 |
14.41 |
|
PoL (mm) |
6.45 |
17.45 |
12.32±0.11 |
13.96 |
|
PdW(mm) |
3.62 |
9.16 |
7.72±0.04 |
8.08 |
|
nSP |
1 |
1.73 |
1.3±0.01 |
13.67 |
|
yield (kg/ha) |
239.47 |
9243.9 |
2466.89±91.54 |
57.84 |
Table 5: Minimum, maximum, mean and variation in traits of Kersting’s groundnut accessions from Benin and Burkina Faso.
Analysis of variance (ANOVA) performed on quantitative traits showed highly significant differences (p < 0.001) among accessions for seed thickness, percentage of germination, number of flowers per plant, number of days to 50% flowering, seed weight, petiole length and pod length (Table 6). Accessions differed significantly for number of branches per plant, leaflet length (p < 0.01), and leaflet width (P<0.05); other traits, viz., number of pods per plant, pod width, number of seeds per pod, number of leaves per plant and grain yield, did not show significant differences. This difference observed could be explained by genetic variation among the accessions, especially since all the accessions in this study did not have a single origin.
|
Mean squares of the 17 quantitative traits of Macrotyloma geocarpum |
||||
|
|
Sources of variation |
|
||
|
Variables† |
Replication |
Block |
Accession |
Residual |
|
|
Df=2 |
Df=8 |
Df=80 |
Df=152 |
|
nPd |
3796.67 ns |
2859.94 ns |
3009.66 ns |
3674.19 |
|
Sth |
0.72 *** |
0.01 ns |
0.07 *** |
0.03 |
|
PdW |
0.85 ns |
0.42 ns |
0.45 ns |
0.35 |
|
nSP |
0.64 *** |
0.02 ns |
0.03 ns |
0.02 |
|
nLe |
11701.59 *** |
892.41 *** |
271.92 ns |
224.76 |
|
LeW |
342.11 *** |
9.12 ns |
12.67 * |
8.22 |
|
PG |
590.31 ** |
456.66 *** |
615.9 *** |
121.36 |
|
nDFlw |
1546.21 *** |
44.24 ns |
84.04 *** |
38.82 |
|
nBrh |
85.67 *** |
37.52 *** |
11.22 ** |
6.83 |
|
nFlw |
20.77 *** |
5.38 ** |
6.03 *** |
2.03 |
|
SeWt |
10.94 *** |
1.93 ns |
3.86 *** |
1.2 |
|
SeL |
0.57 *** |
0.11 ** |
0.34 *** |
0.08 |
|
SeW |
0.28 ** |
0.02 ns |
0.12 *** |
0.04 |
|
LeL |
251.01 *** |
17.98 ns |
19.30 ** |
11.92 |
|
PeL |
10870.68 *** |
1145.13 *** |
519.38 *** |
220.83 |
|
PoL |
19.70 *** |
2.22 ns |
4.06 *** |
2.11 |
|
yield |
122789.82 ns |
165756.29 * |
174349.26 ns |
145845.5 |
Table 6: ANOVA of the 17 quantitative traits of kersting’s groundnut.
The correlation analysis revealed strong relationships between some of the parameters assessed (Table 7). A positive correlation was observed between 100-seed weight and seed length (r = 0.68), leaflet length (r=0.38) and petiole length (r=0.42). This result corroborates the observations made by Gbaguidi et al., [34] on Bambara groundnut. The positive correlation between some of the traits can be exploited in indirect selection. For instance, the positive correlation between number of pods and yield (r=0.59), is an indication that elite plants can be selected based on visual assessment of pod number. On the other hand, moderate negative and significant correlation (r= -0.17) was found between 50% flowering and number of pods per plant (Table 7). These results corroborate results of Assogba et al., and Yadav et al., [14,35].
|
Quantitative traits† |
nPd |
Sth |
PdW |
nSP |
nLe |
LeW |
PG |
nFlw |
nBrh |
nDFlw |
SeWt |
SeL |
SeW |
LeL |
PeL |
PoL |
|
nPd |
|
|
|
|
|
|
|
|
|
|
|
|
|
|
|
|
|
Sth |
0.10ns |
|
|
|
|
|
|
|
|
|
|
|
|
|
|
|
|
PdW |
0.05ns |
0.08ns |
|
|
|
|
|
|
|
|
|
|
|
|
|
|
|
nSP |
0.02ns |
-0.06ns |
0.01ns |
|
|
|
|
|
|
|
|
|
|
|
|
|
|
nLe |
0.08ns |
0.02ns |
0.10ns |
0.11ns |
|
|
|
|
|
|
|
|
|
|
|
|
|
LeW |
0.06ns |
0.02ns |
0.00ns |
0.03ns |
0.46*** |
|
|
|
|
|
|
|
|
|
|
|
|
PG |
0.05ns |
0.24*** |
0.10ns |
0.08ns |
0.07ns |
0.12ns |
|
|
|
|
|
|
|
|
|
|
|
nFlw |
0.12ns |
0.06ns |
-0.04ns |
0.31*** |
0.25*** |
0.21** |
0.23*** |
|
|
|
|
|
|
|
|
|
|
nBrh |
0.00ns |
0.08ns |
-0.06ns |
-0.04ns |
0.75*** |
0.26*** |
-0.01ns |
-0.07ns |
|
|
|
|
|
|
|
|
|
nDFlw |
-0.17** |
0-.18** |
-0.08ns |
-0.04ns |
0.04ns |
0.10ns |
0.30*** |
0.27*** |
0.08ns |
|
|
|
|
|
|
|
|
SeWt |
0.15* |
0.41*** |
0.14* |
0.08ns |
-0.06ns |
0.02ns |
0.29*** |
0.34*** |
-0.14* |
-0.42*** |
|
|
|
|
|
|
|
SeL |
0.12ns |
0.22*** |
0.16* |
0.14* |
0.00ns |
0.13* |
0.31*** |
0.36*** |
-0.14* |
-0.37*** |
0/.00.68*** |
|
|
|
|
|
|
SeW |
0.17** |
0.39*** |
0.21** |
0.07ns |
0.08ns |
0.28*** |
0.35*** |
0.28*** |
-0.04ns |
-0.27*** |
0.66*** |
0.80*** |
|
|
|
|
|
LeL |
0.12ns |
0.18** |
-0.02ns |
0.08ns |
0.23*** |
0.76*** |
0.34*** |
0.43*** |
0.03ns |
-0.26*** |
0.38*** |
0.43*** |
0.46*** |
|
|
|
|
PeL |
0.10ns |
0.25*** |
0.00ns |
0.06ns |
0.30*** |
0.58*** |
0.50*** |
0.50*** |
0.13* |
-0.41*** |
0.42*** |
0.47*** |
0.51*** |
0.77*** |
|
|
|
PoL |
0.08ns |
0.03ns |
0.59*** |
0.76*** |
-0.02ns |
-0.02ns |
0.18** |
0.29*** |
-0.12ns |
-0.19** |
0.29*** |
0.34*** |
0.27*** |
0.12ns |
0.12ns |
|
|
yield |
0.59*** |
0.12ns |
0.05ns |
0.35*** |
0.17** |
0.17** |
0.07ns |
0.30*** |
0.01ns |
-0.17** |
0.33*** |
0.23*** |
0.32*** |
0.31*** |
0.22*** |
0.38*** |
Table 7: Correlations between agronomic traits for 81 accessions of Kersting’s groundnut.
Stepwise Discriminant Analysis (SDA) performed on quantitative traits revealed 8 traits, viz., seed width, seed thickness, number of branches per plant, petiole length, days to 50% flowering, number of seeds per pod, pod width, and pod length, which discriminated the accessions (Table 8). These discriminating traits could be used as descriptors for describing Kersting’s groundnut accessions. In fact, being under-researched, Kersting’s groundnut does not have a list of described descriptors to be used for characterizations, unlike many well-studied crops, whose lists of descriptors for morphological traits have been developed and made available by IPGRI, Bioversity International, USDA, ICRISAT or other well-known or international agricultural research institutes. The eight discriminating traits that were identified constitute a starting point for the establishment of a list of descriptors for the crop.
|
Step |
Traits† |
Wilks.lambda |
F.statistics.overall |
p.value.overall |
F.statistics.diff |
p.value.diff |
Can1 |
Can2 |
|
1 |
PG |
0.319 |
4.31 |
0 |
4.31 |
0 |
0.31 |
-0.64 |
|
2 |
SeL |
0.11 |
4 |
2.39E-26 |
3.72 |
0 |
0.69 |
-0.08 |
|
3 |
Sth |
0.04 |
3.56 |
1.22E-32 |
2.81 |
0 |
-0.33 |
-0.43 |
|
4 |
SeW |
0.01 |
3.47 |
4.15E-41 |
3.23 |
0 |
-0.27 |
0.29 |
|
5 |
nDFlw |
0 |
3.11 |
1.36E-42 |
1.92 |
0 |
-0.26 |
0.6 |
|
6 |
SeWt |
0 |
2.84 |
6.08E-43 |
1.69 |
0 |
0.45 |
-0.49 |
|
7 |
nBrh |
0 |
2.6 |
7.80E-42 |
1.4 |
0.03 |
0.69 |
-0.34 |
Table 8: Summary of the stepwise discriminant analysis identifying quantitatives traits that differentiated of kersting’s groundnut accessions and correlation between discriminating traits and the canonical axes.
Canonical Discriminant Analysis (CDA), performed to describe seed color of accessions based on discriminating traits, showed two axes that explained 100% of the variation, with the axis 1 capturing 96.6% of the variation (Figure 2). Seed thickness, number of branches per plant and days to 50% flowering were correlated with the first axis on the positive side, whereas seed width, petiole length, number of seeds per pod was on the negative side. Thus, axis 1 can be considered indicative of vegetative growth. Seed width, seed thickness, pod length and pod width were correlated with the second axis on the positive side, whereas number of branches per plant and petiole length were correlated with the second axis on the negative side. Most of these traits were related to yield. Thus, axis 2 can be considered a yield-components axis (Figure 2). Overall, black-seeded accessions had wide seed, long pods, a high number of seeds per pod and long petioles; brown seeds had high pod width, whereas cream-colored seed took more days to reach 50% flowering, and had higher number of branches and thicker seeds (Figure 2).
 Figure 2: Projection of discriminating traits with seed coat color onto the canonical axes 1 and 2.
Overall, accessions with white flowers had thick seeds, whereas accessions with purple flowers had thin seed, and low seed length, leaflet width and petiole length (Figure 3). Thus, white-flower accessions exhibited higher performance for yield components and could be used as donor parents in breeding programs.
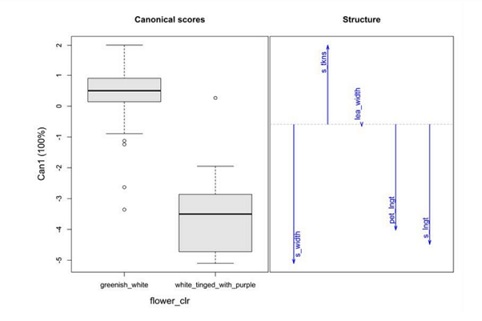 Figure 3: Boxplots showing relationship between flower color and quantitative traits.
In total, significant morphological variation, beyond seed and flower colors, existed among accessions of Kersting’s groundnut. However, the genetic nature of such variation can only be understood if molecular characterization using appropriate marker systems, such as Simple Sequence Repeat (SSR) or Single Nucleotide Polymorphism (SNP) is performed. To date, only one molecular diversity study has been reported using isozymes in this species and no diversity was observed [36]. This state of knowledge needs to be improved and the use of the Next Generation Sequencing Technology may help broaden our knowledge of the genetic diversity in the species.
Principal Component Analysis (PCA) revealed that the first three components had eigenvalues of >1.00 and accounted for 56.4 % of the total variability. The first Principal Component (PC1), which explained 33.3% of the total variation, was positively associated with seed width, petiole length, leaflet length, germination percentage, pod length, seed length, number of flowers per plant and 100-seed weight; whereas days to 50% flowering was correlated with PC1 on the negative side. The first principal component (PC1) explained yield traits. The PC2 explained 13.8 % of the total variation and was positively correlated with number of branches per plant, number of leaves per plant and leaflet width. Seed thickness was correlated with the second PC on the negative side (Figure 4).
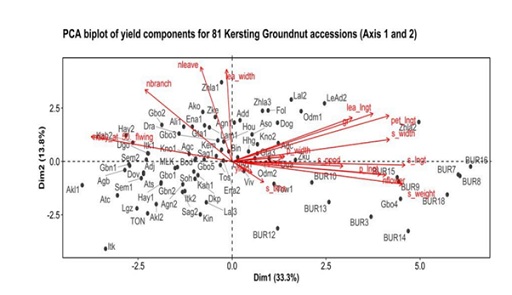 Figure 4: PCA biplot of quantitative trait for 81 Kersting's groundnut accessions (Axis 1 and 2).
The second Principal Component (PC2) explained vegetative growth. The third PC accounted for 9.3 % of the total variation and was positively correlated with pod width and leaflet width; whereas yield and number of pods per plant were negatively correlated with the third principal component (Figure 5). The PCA showed that accessions with a high number of flowers also had long pods, long and heavy seeds, long leaflets and high 100-seed weight. Most of the accessions in that group were from Burkina Faso (BUR3, BUR7, BUR8, BUR9, BUR13, BUR14, BUR15, BUR16 and BUR18) and a few from Benin (Gbo4, LeAd2 and Zhla2) (Figure 4). Moreover, the accessions that had a high leaflet length also had high number of leaves and branches. Accessions falling into this category were from Benin (Zhla1, Ako and Zke) (Figure 5). In addition, accessions that had high seed thickness also had high leaflet width and high number of pods per plant (Figure 5). Such accessions were Odm2, Agn1, Aso, Kno2, Fol, and Tos, all from Benin.
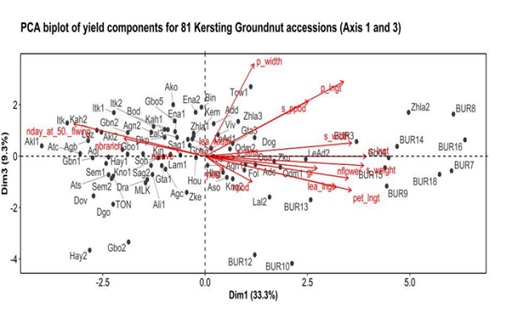 Figure 5: PCA biplot of quantitative trait for 81 Kersting's groundnut accessions (Axis 1 and 3).
The UPGMA (un weighted pair group method with arithmetic mean) dendrogram based on discriminating quantitative traits classified the accessions into three clusters (Figure 6).
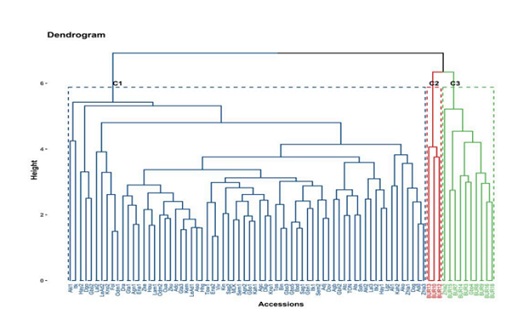 Figure 6: Hierarchical clustering of Kersting's groundnut accessions based on quantitative traits.
The first, second and third clusters contained 68, 3 and 10 accessions, respectively. The first cluster (C1) was composed of high number of branches per plant (10.03 ± 0.23), high number of leaves per plant (67±1.3), high number of days to 50% flowering (49.26 ± 0.13) and wide leaflet width (49.03±0.21 mm). Accessions belonging to cluster C1 also had low 100-seed weight (12.54 ± 0.09 g), small seed length (8.11 ± 0.03 mm) and low number of flowers per plant (14.7 ± 0.39) (Table 9). Overall, cluster C1 was characterized by accessions with high vegetative growth and late flowering. Cluster C2 was characterized by a significant (p<0.001) germination percentage (60.47 ± 4.72), high number of flowers per plant (25.8±0.6) and wide petiole length (165.82 ± 2.53 mm), and lower number of days to 50% flowering (46.11 ± 0.11). In addition, accessions in cluster 2 had medium number of branches per plant (7.57 ± 1.17) and medium seed length (8.30 ± 0.12 mm) (Table 9) compared to accessions in clusters 1 and 3. Cluster C3 was characterized by high 100-seed weight (15.18 ± 0.29g), high seed length (8.88 ± 0.12 mm), high pod width (7.94± 0.06), wide leaflet length (69.4 ± 0.71) and wide seed width (6 ± 0.06 mm) but low number of branches per plant (6.56 ± 0.37). Overall, cluster C3 was characterized by accessions with high performance for yield components (Table 9). In Benin, accessions with cream seed coat and eye color (pure cream) are preferred the most. Accessions in cluster 3 showed high performances for yield-related traits, such as seed weight, seed length and seed width. These accessions were Zhla 2, Gbo 4, BUR 3, BUR 7, BUR 8, BUR 9, BUR 14, BUR 16 and BUR 18, all having black or brown seed coat or black-eyed seeds; none of these accessions had pure cream color. Breeding efforts could therefore perform backcross between pure cream accessions and accessions from cluster 3 to obtain improved pure cream varieties with high yield performance.
|
Variables† |
Cluster 1(n=68) |
|
Cluster 2(n=3) |
|
Cluster 3(n=10) |
F-test |
|||||||||
|
Mean ±SE |
CV(%) |
Min |
Max |
|
Mean ±SE |
CV(%) |
Min |
Max |
|
Mean ±SE |
CV(%) |
Min |
Max |
|
|
|
PdW |
7.73±0.04a |
4.52 |
6.27 |
8.28 |
|
6.84±0.36b |
9.06 |
6.22 |
7.46 |
|
7.94±0.06a |
2.39 |
7.72 |
8.39 |
*** |
|
nLe |
67.53±1.30a |
15.92 |
38.11 |
94.3 |
|
55.73±3.19b |
9.92 |
49.37 |
59.33 |
|
56.61±2.92b |
16.31 |
40 |
72.1 |
** |
|
LeW |
49.03±0.21a |
3.53 |
44.88 |
53.25 |
|
43.76±0.88b |
3.48 |
42.34 |
45.37 |
|
47.57±0.88a |
5.87 |
43.08 |
53.06 |
*** |
|
PG |
44.61±1.71a |
31.66 |
20.93 |
79.84 |
|
60.47±4.72a |
13.51 |
51.94 |
68.22 |
|
54.11±4.25a |
24.82 |
37.21 |
78.29 |
* |
|
nFlw |
14.72±0.39b |
22.12 |
9.03 |
23.25 |
|
25.8±2.06a |
13.84 |
21.7 |
28.23 |
|
25.59±1.54a |
19.03 |
17.63 |
33.67 |
*** |
|
nBrh |
10.03±0.23a |
18.58 |
6.31 |
15.2 |
|
7.57±1.70ab |
38.95 |
4.17 |
9.4 |
|
6.56±0.37b |
17.66 |
5.2 |
8.46 |
*** |
|
nDFlw |
49.26±0.13a |
2.21 |
47.33 |
53 |
|
46.11±0.11b |
0.42 |
46 |
46.33 |
|
46.7±0.27b |
1.79 |
46 |
48.33 |
*** |
|
SeWt |
12.54±0.09b |
5.71 |
11.06 |
13.87 |
|
14.03±0.19a |
2.34 |
13.83 |
14.41 |
|
15.18±0.29a |
6 |
13.63 |
16.73 |
*** |
|
SeL |
8.11±0.03b |
2.6 |
7.61 |
8.67 |
|
8.3±0.12ab |
2.58 |
8.08 |
8.5 |
|
8.88 ± 0.12a |
4.12 |
8.36 |
9.29 |
*** |
|
SeW |
5.64±0.02b |
2.83 |
5.31 |
6.16 |
|
5.58±0.06b |
1.91 |
5.51 |
5.7 |
|
6 ±0.06a |
3.07 |
5.72 |
6.29 |
*** |
|
LeL |
65.21±0.26b |
3.32 |
59.88 |
70.44 |
|
65.8±0.94b |
2.46 |
64.56 |
67.64 |
|
69.4±0.71a |
3.23 |
66.1 |
72.82 |
*** |
|
PeL |
140.29±1.30b |
7.65 |
110.42 |
165 |
|
165.82±2.53a |
2.64 |
160.78 |
168.56 |
|
157.6±3.3a |
6.62 |
140.41 |
175.8 |
*** |
|
PoL |
12.05±0.11b |
7.49 |
9.36 |
14.35 |
|
11.55±0.56b |
8.36 |
10.73 |
12.61 |
|
14.41±0.25a |
5.54 |
13.07 |
15.75 |
*** |
Table 9: Mean values and standard errors of discriminating traits in Kersting’s groundnut accessions.
Conclusion
The evaluation of 81 KG accessions based on the 29 traits revealed high diversity, both for qualitative and quantitative traits. Three diversity groups were identified based on the quantitative traits. Three clusters were characterized by late flowering, good vegetative growth, high germination percentage and high yield performance. Besides, the study identified seed width, seed thickness, number of branches per plant, petiole length, days to 50% flowering, number of seeds per pod, pod width, and pod length as the quantitative traits that best discriminate the accessions. This could be a starting point for the establishment of a list of descriptors to be measured while studying the crop. Additional accessions should be investigated and molecular characterization studies be conducted to fully understand diversity patterns.
Acknowledgement
The authors are grateful to NOW-WOTRO for financial support that enabled field experiments. Acknowledgment goes to the Regional Universities Forum for Capacity Building in Agriculture (RUFORUM) for funding part of the experiments through Carnegie Cooperation of New York. We are grateful to The World Academy of Science (TWAS) for its support. We are grateful to the Benin Institute of Agricultural Research (INRAB) that has provided site and technical support for the experiments.
Conflict of Interest Statement
The authors declare that the research was conducted in the absence of any commercial or financial relationships that could be construed as a potential conflict of interest.
Authors contributions
AEE, SFAK, HS and VR designed the study. CYG, AEE and HS conducted the experiments. CYG and SA actively participated in data collection. KK and SA analysed the data with support from AEE. HAT provided study site and technical guidance. CYG, AEE, KK, HS and SFAK developed the manuscript. VR, AS, AA, CJF, AAE and BS provided guidance throughout experiment, data collection and management, and manuscript development. All authors reviewed, improved the manuscript and agree to be accountable for the final manuscript.
References
- Padulosi S, Thompson J, Rudebjer P (2013) Fighting poverty, hunger and malnutrition with neglected and underutilized species: needs, challenges and the way forward: neglected and underutilized species. Bioversity International, Rome.
- Mabhaudhi T, Chimonyo VGP, Hlahla S, Massawe F, Mayes S, et al. (2019) Prospects of orphan crops in climate change. Planta 250: 695-708.
- Andrew HP, Barbara KM, Lifeng L (2009) The Comparative Genomics of Orphan Crops. Afr Technol Dev Forum J 6: 8.
- Gyamfi RA, Fearon J, Bayorbor TB, Dzomeku IK, Avornyo VK (2011) The Status of Kersting’s Groundnut (Macrotyloma Geocarpum) [Harms] Marechal and Baudet): An Underexploited Legume in Northern Ghana. Outlook Agric 40: 259-262.
- Abiola V, Oyetayo O (2015) Proximate and Anti-nutrient Contents of Kersting’s Groundnut (Macrotyloma geocarpum) Subjected to Different Fermentation Methods. Br Microbiol Res J 10: 1-10.
- Gyamfi RA, Dzomeku I, Lardi J (2012) Evaluation of growth and yield potential of genotypes of Kersting’s groundnut (Macrotyloma geocarpum harms) in Northern Ghana. Int Res J Agric Sci Soil Sci 2: 509-515.
- Dansi A, Vodouhè R, Azokpota P, Yedomonhan H, Assogba P, et al. (2012) Diversity of the Neglected and Underutilized Crop Species of Importance in Benin. Sci World J 2012: 1-19.
- Dako EGA, Vodouhè SR (2006) Macrotyloma geocarpum (Harms) Maréchal and Baudet. Brink M Belay G Ed PROTA 1.
- Ajayi OB, Oyetayo FL (2009) Potentials of Kerstingiella geocarpa as a Health Food. J Med Food 12: 184-187.
- Leung TW, Busson F, Jardin C (1968) Food composition table for use in Africa. FAO, Rome.
- Adazebra GA (2013) Yield, Quality and Nodulation Studies of Kersting’s Groundnut [Macrotyloma geocarpum, (Harms) Merachal and Baudet] in the Coastal Savannah Agro- Ecological Zone of Ghana. Master of philosophy, University of Ghana, Ghana.
- Agoyi EE, Sognigbe N, Kafoutchoni M, Ayena M, Sodedji FAK, et al. (2019) Kersting’s Groundnut [Macrotyloma geocarpum (Harms) Maréchal & Baudet] Crop Attracts More Field Pests and Diseases than Reported Before. Agric Res Technol Open Access 21: 556180.
- Ayenan MAT, Ezin VA (2016) Potential of Kersting’s groundnut [Macrotyloma geocarpum (Harms) Maréchal & Baudet] and prospects for its promotion. Agric Food Secur 5: 10.
- Assogba P, Ewedje EEBK, Dansi A, Loko YL, Adjatin A, et al. (2015) Indigenous knowledge and agro-morphological evaluation of the minor crop Kersting’s groundnut (Macrotyloma geocarpum (Harms) Maréchal et Baudet) cultivars of Benin. Genet Resour Crop 63: 513-529.
- Boyé MAD, Kouassi NJ, Soko DF, Ballo EK, Tonessia, DC, et al. (2016) Evaluation des composantes du rendement de 16 variétés de niébé (Vigna unguiculata (L.) Walp, Fabaceae) en provenance de quatre régions de la Côte d’Ivoire. Int J Innov Sci Res 25: 628-636.
- Radhouane L (2004) Etude de la variabilité morpho-phénologique chez Pennisetum glaucum (L.) R. Br Not Recur Fitogeneticos 18-22.
- IPGRI, IITA, BAMNET (2000) Descripteurs du pois bambara (Vigna subterranea). Inst. Int Ressour Phytogénétiques Rome Italy.
- IBPGR, ICRISAT (1992) Descriptors for groundnut. [Monograph]. Int Board for Plant Genet Resour.
- IBPGR, ICRISAT (1981) Descriptors for pigeonpea. Int Board Plant Genet Resour Crops Res Inst Semi-Arid Trop.
- Akohoue F, Dako EGA, Coulibaly M, Sibiya J (2019) Correlations, path coefficient analysis and phenotypic diversity of a West African germplasm of Kersting’s groundnut [Macrotyloma geocarpum (Harms) Mare ´chal & Baudet]. Genet Resour Crop Evol 66: 1825-1842.
- Bayorbor T, Dzomeku I, Avornyo V, Agyeman MO (2010) Morphological variation in Kersting’s groundnut (Kerstigiella geocarpa Harms) landraces from northern Ghana. Agric Biol J N Am 1: 290-295.
- Ghimire KH, Joshi BK, Dhakal R, Sthapit BR (2017) Diversity in proso millet (Panicum miliaceum L.) landraces collected from Himalayan mountains of Nepal. Genet Resour Crop Evol.
- Yadav RK, Adhikari AR, Gautam S, Ghimire KH, Dhakal R (2018) Diversity sourcing of foxtail millet through diversity assessment and on-farm evaluation. Cogent Food Agric Agric 4: 1482607.
- Anderson PE, Reo NV, DelRaso NJ, Doom TE, Raymer ML (2008) Gaussian binning: a new kernel-based method for processing NMR spectroscopic data for metabolomics. Metabolomics 4: 261-272.
- Sengupta N, Sil J (2020) Discretization. Instrusion Detection. Springer Singapore 27-46.
- Abdi H (2010) Coefficient of Variation. In: Salkind N (Ed.). Encyclopedia of Research Design. Thousand Oaks, USA.
- Ashraf A, Abd ElM, Samir R. Abo H (2013) Comparing the relative efficiency of two experimental designs in wheat field trials. WEJ 1: 101-109.
- R Core Team (2019) R: A language and environment for statistical computing. Vienna, Austria.
- Ndiang Z, Bell JM, Missoup AD, Fokam PE, Amougou A (2012) Étude de la variabilité morphologique de quelques variétés de voandzou [Vigna subterranea (L.) Verdc] au Cameroun. Journ Al Appl Biosci 60: 4410-4420.
- Akohoue F, Sibiya J, Dako EGA (2018) On-farm practices, mapping, and uses of genetic resources of Kersting’s groundnut [Macrotyloma geocarpum (Harms) Maréchal et Baudet] across ecological zones in Benin and Togo. Genet Resour Crop Evol 66: 195-214.
- Gbaguidi A, Assogba P, Dansi M, Yedomonhan H, Dansi A (2015) Caractérisation agromorphologique des variétés de niébé cultivées au Bénin. Int J Biol Chem Sci 9: 1050.
- Amujoyegbe BJ, Obisesan IO, Ajayi AO, Aderanti FA (2007) Disappearance of Kersting’s groundnut (Macrotyloma geocarpum (Harms) Marechal and Baudet) in south-western Nigeria: an indicator of genetic erosion. Plant Genet Resour Newsl 152: 45-50.
- Khan K, Bari A, Khan S, Shah NH, Zada I (2010) Performance of cowpea génotypes at higher altitude of nwfp. Pak J Bot 42: 2291-2296.
- Gbaguidi AA, Dansi A, Aminon ID, Gbemavo DSJC, Orobiyi A, et al. (2017) Agromorphological diversity of local Bambara groundnut (Vigna subterranea (L.) Verdc.) collected in Benin. Genet Resour Crop Evol 65: 1159-1171.
- Yadav R, Singh R, Kumar S, Prasad TV, Bharadwaj R, et al. (2015) Genetic Diversity Among Indigenous Germplasm of Brassica juncea (L.) Czern and Coss, Using Agro-Morphological and Phenological Traits. Natl Acad Sci 87: 1125-1131.
- Pasquet RS, Mergeai G, Baudoin JP (2002) Genetic diversity of the African geocarpic legume Kersting’s groundnut, Macrotyloma geocarpum (Tribe Phaseoleae: Fabaceae). Biochem Syst Ecol 30: 943-952.
Citation: ChodatonGY, AgoyiEE,HoundétéTA, KafoutchoniKM, SossouHS (2021) Morphological variation among and discriminating traits of Kersting’s groundnut accessions. J Genet Genomic Sci 6: 031.
Copyright: © 2021 Gilles Y Chodaton, et al. This is an open-access article distributed under the terms of the Creative Commons Attribution License, which permits unrestricted use, distribution, and reproduction in any medium, provided the original author and source are credited.