Multivariate Probit Regression Analysis of Beekeepers Market Outlet Choices: The Case of Abuna Gindeberet District of Oromia Region, Ethiopia
*Corresponding Author(s):
Besha Teresa BorenaLecturer At Department Of Agribusiness And Value Chain Management, School Of Business And Economics, Ambo University, Ethiopia
Tel:+251 0910909229,
Email:beshatrs75@gmail.com
Abstract
Apiculture sector has crucial role in improving the livelihoods of honey producers through family income, employment generation and poverty alleviation. The study aimed to conduct analyzing determinants of beekeepers market outlet choice decisions in Abuna Gindeberet district. The primary data for this study were collected from 150 honey producer households, and the data obtained were analyzed by using multivariate probit model. There were four market outlet choices in the study district such as collector, wholesaler, processor (local drink makers) and consumer. The results of the models indicated that, among the twelve (12) variables included in the model about six (6) variables namely household head educational level, agro ecology, market distance, frequency of extension contact, market information and volume of honey marketed were found to have significant effects on the willingness to choose honey market outlets. Improving production of honey to be marketed (volume) needs government and support service provider interventions, provide equal infrastructures for the distant producer, improve DAs capacity through training and supporting them by separating from other administrative activities to increase frequency of extension for farmers were policy remarks of the study.
Keywords
Abuna Gindeberet; Honey; Market Outlet Choices; Multivariate Probit; Stakeholders
Introduction
Ethiopia is among the major producer of honey both in Africa and in the world. For instance, in 2013, the country produced about 45,000 tons which accounted for about 27% and 3% of African and world honey production respectively, which make the country the largest producer in Africa and the tenth in the world [1]. It is one of the oldest farming practices in Ethiopia as a result of its forests and woodlands which contain diverse plant species that provide nectar and pollen to foraging bees [2].
Improved information and marketing facility enable farmers to plan their production more in line with market demand and to decide which market to sell their produce. However, current knowledge on bee product marketing is poor and inadequate to overcome perceived problems in the marketing system [3]. Enhancing the ability of poor smallholder farmers to reach markets and actively engaging them is one of the most pressing development challenges [4]. Without having convenient marketing conditions, the possible increment in output, rural incomes and foreign exchange resulting from the introduction of improved honey production technologies could not be effective.
Marketing outlet choice is one of the most important farm household decisions to sell their produce in different marketing outlets and has a great impact on household income [5]. Market outlet choices are a household-specific decision, and several drivers have to be considered as a basis for such decision. Various empirical studies revealed that smallholder farmers" decision to choose market outlets can be affected by household characteristics, resource endowments, and access to different market outlets, prices, and transportation cost [6-8].
Metagas et al., [8] study in masha district using multivariate probit models shows that education level and family size have significant effect on market outlets choices of producers. The study result also showed that there are four major honey market outlets choices such as tej makers, cooperatives, traders and exporters. However, according to kassa et al., [9] study in Chena district using multivariate probit models education level and family size have no significant effect on market outlet choices of honey producers. Additionally honey producer market outlets choices are; retailers, cooperatives, collectors, and consumers. Additionally, Ayantu [10] study on honey value chain analysis in Gera District, Jimma zone of Oromia national regional state, Ethiopia revealed that educational level of the household head significantly affect market outlet choice of honey producers, but family size has no effect on market choices decision of farmers.
Even though both honey and honey by-products are economically and socially important, no study has been conducted to improve the sector, to identify market outlet choices of producers in the particular study district. Therefore, this needs to conduct honey market outlet choice decisions of honey producers and the criticalness of honey production and marketing to the livelihood of Abuna Gindeberet people initiate an interest in the mind of the researcher. Hence, this study would be conducted in order to come up with determinants of beekeepers market outlet choice of honey of honey in Abuna Gindeberet distric of Oromia national regional state, Ethiopia.
Methodology
- Description of the Study Area
This study was conducted in Abuna Gindeberet district of West shewa zone, Oromia regional state, Ethiopia. The district is located at about 170 km from West of Addis Ababa and 128km from zonal town Ambo. It is characterized as midland (32%) and low land (68%) which is about 13 midland and 28 low land kebeles. The district has a total of 44 kebeles of which 41 are rural administrative kebeles and 3 are city administration with total population of 181,853, where 49.93% were male and 50.07 were female. Beekeeping practiced with about 14,569 honey bee colony which is about 299 Modern hive, 1114 Transitional hive and 13,156 Traditional hives in the study area (District Livestock and Fishery Developmen Office, 2018) Figure 1.
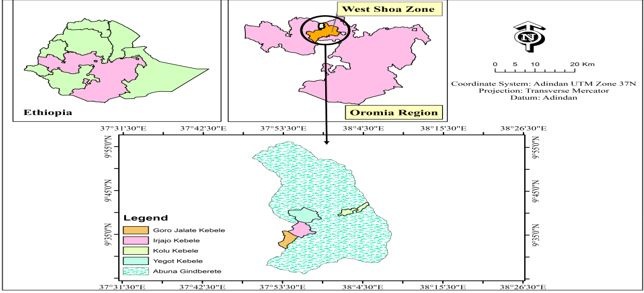 Figure 1: Map of the Study Area
Abuna Gindeberet district is suitable for honey production due to its favorable agro ecology and beekeeping activities as it houses for bee forage. Honey production is commonly practiced during two production cycles in the district, but more intensively used among the two production cycles in which more of the farmers are engaged for honey production is from September up to November that is during flowering season. The first season runs from September to November and the second season runs from April to May and peak honey harvesting months is at the end of October and beginning of November.
- Types, Source and Method of Data Collection
The data were conducted using survey questionnaires from sampled households of honey producers in the study district using personnel interview. Data were collected using structured questionnaire from honey producer sampled households focusing on factors affecting market outlet choices of households. Before data collection the enumerators were trained on the techniques of data collection and the questionnaire were pre-tested to evaluate the appropriateness, simplicity, understanding and relevance of the questions, and time taken for an interview.
- Sampling Procedures and Sample Size
A three-stage sampling technique was employed for this study. First, kebeles were classified in to midland and lowland agro ecology because the district has about 13 midland and 28 lowland kebeles and all kebeles were honey producers. Second, two kebeles among each agro ecology were selected randomly; namely Goro jalate and Kolu from lowland, and Yagot and Irjajo from midland. Third stage, honey producers and non-producers identified and then sampled 150 households were randomly selected from honey producers using probability proportional to sample size.
Formula for sample size determination for heterogeneous population is given by [11].
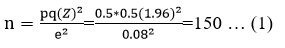
Where, n = sample size; p = 0.5; q = 1-p and e = (8%) allowable error. Z = the value of standard variate at a given confidence level and to be worked out from table showing area under normal curve is 95% zα/2 = 1.96
Methods Of Data Analysis
- Descriptive Analysis: Inferential statistics such as chi-2 test and t-test were used in the process of examining and describing sampled household characteristics.
- Econometric Analysis: The base for market outlet choice is the theory of rational choice which assumes that farmers are rational and would rank alternative marketing channel for utility maximization. The choice of marketing outlet was based on producers’ socioeconomic characteristics and relevant factors influencing the choice imbedded in each outlet. The producers’ market outlet choice can be conceptualized using a Random Utility Model (RUM). RUM is particularly applicable for discrete choice decisions like market outlet choices. It is an indirect utility function where an individual with specific characteristics associates an average utility level with each alternative outlet in a choice set [9].
The honey producers were mapped into four marketing channels. Namely; sales to consumers, collectors, wholesalers and processors (local drink makers i.e. birth and ‘tenaye/keneto’). Honey producing sample household i was able to choose from a set of alternatives (j = 1, 2, 3, and 4) which provided a certain level of utility Uij from each alternative. Hence, the utility was divided into deterministic and random:
Uij = Vij + εij ……… (2)
Where; Uij = utility from each alternative, Vij = deterministic and εij = random error.
Since it was not possible to observe εij and predict exactly choice of marketing outlet, probability of any particular outlet choice was used in which a farmer selected a marketing outlet j = 1 if:
Uik > Ui∀j≠k …………… (3)
Where, Uik = a random utility associated with the market outlet j = k, Vij = an index function denoting the decision-makers’ average utility associated with this alternative.
It is assumed that given producer i in making a decision considering not exclusive alternatives that constituted the choice set Kth of honey marketing outlets, the choice sets may differ according to the decision maker. The ith producers (i=1, 2…... N), facing a decision problem on whether or not to choose available market outlets. Let Uk represent the benefits to the sampled households who choose the Kth market outlet: where K denotes choice of collectors (Y1), wholesalers (Y2), processors (Y3) and consumers (Y4). The sampled households decide to choose the Kth market outlet if Yik*= Uk* – U0 > 0. The net benefit (Y*ik) that the households derive from choosing a market outlet is a latent variable determined by observed explanatory variables (Xi) and the error term (ei) [12] model specified as:
Yik*= Xi βk + ei ………………….. (4)
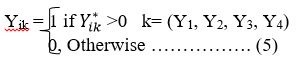
- Hypothesized variable: The dependent variables indicate that, whether sales are made through the relevant marketing outlet for each honey producers can use one or more marketing outlet. Where, Yik the dependent variables which are actually observable, it can be empirically specified to be one when a sampled household i sell at least once a year to the kth market outlet. The matrix X includes a set of explanatory variables representing households market outlet choice characteristics, βik denote the parameters to be estimated, and Σ ik are error terms as multivariate normal, N(0, Σ) where Σ has values of 1 on the leading diagonal and correlations ρjk = ρkj as off- diagonal elements. Following [12] (Table 1) the log-likelihood function is identified as;
lnL= Σni-1 ωilnφ(µi;Ω) ……………… (6)
Where, ωi is an optional weight for observation i, and φ is the multivariate standard normal distribution with arguments µi and Ω, where µi can be denoted as;
μi = (ki1β1X1i, ki2β2X2i, ki3β3X3i, ki4β4X4i), while Ωik = 1 for j = k and ……………… (7)
Ωjk = Ωkj = kijkikρij for j ≠ k, k = 1,2,3,4 with kij = 2yik-1 ……………………………. (8)
|
Variable |
Description |
Type |
Measurement |
Market outlet choices |
|||
|
Y1 |
Y2 |
Y3 |
Y4 |
||||
|
|
|
|
|
+ |
+ |
- |
- |
|
HHSz |
Household size |
Continuous |
Adult equivalent |
- |
+ |
+ |
+ |
|
EDLHH |
Education level of HH |
Continuous |
Years of schooling |
- |
+ |
+ |
+ |
|
AECOL |
Agro ecology |
Dummy |
1=Midland,0= Lowland |
- |
+ |
- |
+ |
|
DISNM |
Distance from market |
Continuous |
Hours |
+ |
- |
- |
+ |
|
MINFO |
Market information |
Dummy |
1= if get info, 0= if not |
- |
- |
+ |
+ |
|
EXPR |
Beekeeping experience |
Continuous |
Years |
+ |
+ |
+ |
- |
|
COLONY |
Number of colony |
Continuous |
Number |
+ |
+ |
+ |
- |
|
VHS |
Honey supplied to market |
Continuous |
kilograms |
+ |
+ |
+ |
+ |
|
ACREDIT |
Access to credit |
Dummy |
1 = yes, 0 = No |
- |
+ |
+ |
- |
|
FEXTCO |
Frequency of extension |
Continuous |
Number |
- |
+ |
+ |
- |
|
TBH |
Type of beehive used |
Categorical |
1=trad,2=Trad & Trans, 3= Trad & Modern and 4 = All |
+ |
+ |
+ |
+ |
Note: Trad. = Traditional hive, Trans. = Transitional hive, Y1= Collector, Y2=Wholesaler, Y3=Processor, Y4=Consumer
Table 1: Summary of variable determining producers market outlet choices
Result and Discussion
- Characteristics of Sampled Household
According to table 2 below family size of sampled household results revealed that the mean of the family size of household in adult equivalent was 7.30 in midland and 5.54 in lowland agro ecology with an aggregate of 6.47. Since honey is not labor intensive agricultural activity, the large number of family size is not as much important because it increases the level of consumption at home. The t-test results showed that household size was statistically significant at 10% significant level, meaning that, the household size between lowland and midland agro ecology was not equal. In case of distance to the nearest market in the study district, the average distance needed for the farmer to travel to the nearest market was about 1.12 (1:07) hour and 1.89 (1:53) walking hour for midland and lowland agro ecology, respectively with an overall average of 1.49 (1:29) walking hour per trip. This creates variation among the sampled households to purchase inputs and to sell their produce at the required period of time and at affordable prices. The t- value inferred that there were significant differences in distance traveled to the nearest market center at a 10% level of significance. This depicts that, there is a difference in walking hour for agro ecology in honey marketing.
Another importance attribute was the educational status attained by the household head in years of schooling. Education also enables the person with the ability to do basic communications for business purposes as well as production practices. From all sampled household heads the average educational status was found to be 5 years of schooling approximately with an average of 6 and 4 years of schooling for midland and lowland agro ecology, respectively. In other words, some sampled farmers did not attend formal education while others attended formal education from up to 15 years in the district. These result of the two tail t-test shows that education level was statistically significant at 10% level of significance. This implies that there was a significant difference in educational status of low land and midland agro ecology. In other case, the number of colonies owned by sampled household, there were on average about 6.22 and 9.37 number of honey bee colonies exist in midland and lowland agro ecology, respectively with an aggregate of 7.71 numbers of hives in the study area. This implies that there were household those having a large number of colony to produce ample volume of honey for marketing as well as for his/her economic growth. The result of the two tail t-test shows that the number of colonies owned was statistically significant in between low land and midland agro ecology at a 5% level of significance. This infers that there is a significant difference between agro ecology for owning number of beehives.
Regarding types of beehives owned; 71.33% of sampled household owned only traditional hives with 30% from midland and 41.33% from lowland agro ecology. About 8.67% of sampled household had both traditional and modern hives. However, 13.33% of midland and 3.33% of lowland with a total of 16.67% sampled household owned all types of beehive that means traditional hive, transitional hive and modern hives in one. According to Table 2 below result, the types of beehives owned were statistically significant on the chi-squared results at 1%. This infers, there was a significant difference in having traditional hives, transitional hives, modern hives and combination of all beehives in one between midland and lowland.
|
Variables |
Category |
Midland (N=79) |
Lowland (N=71) |
Both (N=150) |
t-/χ2 value |
|||
|
Sex of the household head |
Male |
71(47.33) |
65(43.33) |
136(90.67) |
0.1241 |
|||
|
Female |
8(5.33) |
6(4.00) |
14(9.33) |
|||||
|
Family size (man equivalent) |
|
7.30 |
5.54 |
6.47 |
-4.154* |
|||
|
Education of household head |
|
5.62 |
4.03 |
4.87 |
-3.112* |
|||
|
Distance from nearest market |
|
1.12 |
1.89 |
1.49 |
5.625* |
|||
|
Market information |
Yes |
50(33.33) |
41(27.33) |
91(60.67) |
0.4818 |
|||
|
|
No |
29(19.33) |
30(20.00) |
59(39.33) |
|
|||
|
Experience in beekeeping |
10.23 |
9.11 |
9.70 |
-0.9768 |
||||
|
Training |
Yes |
53(35.33) |
50(33.33) |
103(68.67) |
0.1932 |
|||
|
|
No |
26(17.33) |
21(14.00) |
47(31.33) |
|
|||
|
Access to credit |
Yes |
18(12.00) |
10(4.67) |
28(18.67) |
1.8644 |
|||
|
|
No |
61(40.67) |
61(40.67) |
122(81.33) |
|
|||
|
Number of beehives owned |
|
6.22 |
9.37 |
7.71 |
2.5678** |
|||
|
Volume of honey supply |
|
66.84 |
79.45 |
72.81 |
0.8781 |
|||
|
Frequency of extension contact |
|
1.98 |
1.66 |
1.84 |
-1.3403 |
|||
|
Types of beehives Owned |
Traditional hive |
45(30.00) |
62(41.33) |
107(71.33) |
17.76 *** |
|||
|
Traditional and transitional |
3(2.00) |
2(1.33) |
5(3.33) |
|
||||
|
Traditional and modern |
11(7.33) |
2(1.33) |
13(8.67) |
|
||||
|
All in one (all hive types in one) |
20(13.33) |
5(3.33) |
25(16.67) |
|
||||
Source: Computed from survey data, 2019
Table 2: Mean and proportion of household characteristics by agro ecology
- Determinants of Honey Market Outlet Choices
As reported below (Table 3), the Multivariate Probit (MVP) model estimates the parameters by drawing the samples as many times as possible. In this case, the samples are drawn 100 times. That is why they are simulated maximum likelihood (SML) estimators computed from the parameters estimated from the samples drawn. The expected multivariate interdependence of selection of particular market outlet choices of collector, wholesaler, processor and consumer was accounted for by employing the multivariate Probit model (Table 3). The Wald chi-square (χ 2 (56) = 141.01, p = 0.0000) statistic that was used to test for the overall significance of the variables included in the model is significant at 1% significance level. This result implied that the subsets of coefficients are jointly significant and the explanatory power of the factors included in the model is satisfactory, thus MVP model fits the data reasonably well.
|
Variables |
Collector |
Wholesaler |
Processor |
Consumer |
||||||||||||||||||
|
Coeff. |
SE |
Coeff. |
SE |
Coeff. |
SE |
Coeff. |
SE |
|||||||||||||||
|
Sex of household |
0.158 |
0.448 |
0.801 |
0.738 |
-0.263 |
0.395 |
-0.206 |
0.423 |
||||||||||||||
|
Household size |
-0.008 |
0.070 |
0.028 |
0.085 |
0.013 |
0.053 |
0.015 |
0.058 |
||||||||||||||
|
Education level |
-0.012 |
0.056 |
0.219** |
0.105 |
0.005 |
0.046 |
0.013 |
0.050 |
||||||||||||||
|
Mark. Info. |
-0.165 |
0.365 |
-0.327 |
0.545 |
0.643** |
0.291 |
0.031 |
0.327 |
||||||||||||||
|
Agro ecology |
-0.936*** |
0.358 |
0.915* |
0.520 |
-0.058 |
0.305 |
0.454 |
0.301 |
||||||||||||||
|
Market distance |
0.474** |
0.200 |
-0.419* |
0.249 |
-0.058 |
0.153 |
0.260 |
0.164 |
||||||||||||||
|
Experience |
0.016 |
0.024 |
0.016 |
0.028 |
0.022 |
0.017 |
-0.024 |
0.018 |
||||||||||||||
|
Colony number |
0.058 |
0.061 |
0.031 |
0.092 |
-0.005 |
0.049 |
0.061 |
0.053 |
||||||||||||||
|
Volume of supply |
0.019*** |
0.006 |
0.037*** |
0.014 |
0.002 |
0.004 |
0.010* |
0.005 |
||||||||||||||
|
Access to credit |
-0.505 |
0.414 |
0.407 |
0.639 |
0.189 |
0.345 |
-0.109 |
0.370 |
||||||||||||||
|
Freq. of extn. cont. |
-0.041 |
0.119 |
0.557** |
0.225 |
0.163 |
0.101 |
-0.101 |
0.103 |
||||||||||||||
|
Type of bee hive own |
Traditional |
-1.335 |
0.900 |
0.986 |
2.333 |
0.065 |
0.743 |
-0.147 |
0.748 |
|||||||||||||
|
Trad & trans |
-1.060 |
0.834 |
-0.939 |
2.392 |
-0.007 |
0.715 |
-0.005 |
0.685 |
||||||||||||||
|
Trad & modern |
-0.349 |
0.956 |
1.075 |
2.445 |
0.146 |
0.802 |
0.225 |
0.791 |
||||||||||||||
|
Combination |
-1.125 |
0.903 |
1.636 |
21.231 |
-0.118 |
0.774 |
0.061 |
0.757 |
||||||||||||||
|
_cons |
-0.067 |
1.236 |
-4.463 |
2.726 |
-0.852 |
0.982 |
-0.851 |
1.090 |
||||||||||||||
|
Predicted probability |
0.6195 |
0.6881 |
0.5082 |
0.5862 |
||||||||||||||||||
|
Joint probability(Success) |
0.1805835 |
|||||||||||||||||||||
|
Joint probability(failure) |
0.0367264 |
|||||||||||||||||||||
|
Number of simulation (Draws) |
100 |
|||||||||||||||||||||
|
Number of observation |
150 |
|||||||||||||||||||||
|
Wald χ2(56) |
141.01 |
|||||||||||||||||||||
|
Log likelihood |
-255.90215 |
|||||||||||||||||||||
|
Prob > chi2 |
0.0000*** |
|||||||||||||||||||||
|
Estimation correlation matrix |
||||||||||||||||||||||
|
|
ρ1 |
ρ2 |
ρ3 |
ρ4 |
||||||||||||||||||
|
ρ1 |
1 |
|
|
|
||||||||||||||||||
|
ρ2 |
-0.4836*(0.232) |
1 |
|
|
||||||||||||||||||
|
ρ3 |
-0.1785(0.180) |
-0.6015**(0.183) |
1 |
|
||||||||||||||||||
|
ρ4 |
-0.0943(0.190) |
-0.1218(0.306) |
-0.2910*(0.144) |
1 |
||||||||||||||||||
|
Likelihood ratio test of: ρ21 = ρ31 = ρ41 = ρ32 = ρ42 = ρ43 = 0: |
||||||||||||||||||||||
|
χ2 (6) = 24.4066 |
|
|
|
|
||||||||||||||||||
|
Prob > χ2 = 0.0004*** |
|
|
|
|
||||||||||||||||||
Note: *, **, ***= Significant at 10%, 5% and 1%, respectively. SE = Standard error, Coeff. = Coefficient, Mark. Info = market information, Freq.of extn.cont= frequency of extension contact, Trad. = Traditional hive, Trans. = Transitional hive
Source: Own computation from survey result, 2019
Table 3: Multivariate probit estimation result for determinants of market outlet choices
The likelihood ratio test result (LR χ2 (6) = 24.4066, χ2 > p= 0004) of the null hypothesis of independence of the market outlet choice (ρ21 = ρ31 = ρ41 = ρ32 = ρ42 = ρ43 = 0) is significant at 1% level. Therefore, the null hypothesis that all the ρ (rho) values are jointly equal to 0 is rejected, indicating the goodness-of-fit of the model or implying that the decisions to choose these market outlets are interdependent. Hence, the use of multivariate probit model is justified to determine factors determining choice of market outlet. Moreover, there are differences in market outlet choice behavior among farmers, which are reflected in the likelihood ratio statistics. Separately considered, the ρ values (ρij) indicate the degree of correlation each pair of dependent variables. The ρ21 (correlation between the choice for wholesaler and collector), ρ32 (correlation between the choice for processor and wholesaler) and ρ43 (correlation between the choice for consumer and processor) are all negative and statistically significant at 10%, 5% and 10% significant level respectively. This finding leads to; farmers delivering to the wholesaler are less likely to deliver to collector and processor (ρ21, ρ32) respectively. Equally, producers delivering to consumer are less likely to processors (ρ43).
The simulation results also indicate that the marginal success probability for each outlet choice decision is reported below (Table 3). Around 50.82% of producers choose processor (local drink makers like birth and tenaye/keneto) as honey marketing outlet which is the lowest among other outlets. One of the most commonly used market outlets chosen by producers is wholesaler (68.81%), whereas about 61.95% of respondents sold to collectors. This is an indicator that wholesaler is the most likely chosen market outlet by honey producers and the low capacity of collector outlet to purchase more honey produce at a time. As consumers are also common honey marketing outlets in the study area, around 58.62% of sample households sold to consumer. The joint probabilities of success or failure of choosing those outlets suggests that the likely of households to jointly choose the four outlets is high. The likelihood of households to jointly choose the outlets was 18.06% which is relatively higher compared to their failure to jointly choosing them (3.67%).
The results of the models in Table 3 indicated that about six (6) variables were found to have significant effects on the willingness to choose honey market outlets.
Educational Level of The Household: An Education level of the households head affects positively the wholesaler outlet choice at 5% significant level. It implies that, when farmers have more education the probability of selling honey to wholesaler would increase. Because, educated producer gets market information simply than less educated through different media and wholesalers buy honey in large volume at once. This result is consistent with [8] and [13] which reveal education level affects cooperative and traders outlet choices positively and significantly.
Market Information about Each Outlet: Another variable that may affect a producer decision is market information of the household in which differences in having information about market of honey producer household influence decision making. It affects positively the processor outlet choice at 5% significant level. From this we infer that, access to current market information improves processors buying amount; because market information helps processors to analyze the price difference in their locality and the nearby main market that decreases the cost to use (process) in another time by storing at home. The finding of [8] revealed that information access affects processor market outlets positively which was similar with this result.
Agro Ecology: Agro ecology was related with collector and wholesaler outlet negatively and positively at 1% and 10% level of significance, respectively. This implies that, being in lowland may decrease the probability of honey supplied to the market at market day because almost all honey market of the district exist in midland. Doe to this, the chance of getting wholesaler outlet is low and they sold to collectors. In other wards according to the topography of the study area, as the agro ecology becomes midland the probability of gating honey market increases. However, being in midland for honey producers create opportunity for wholesaler to get honey at market place, because honey produced in midland by sampled producers provide their honey to the market without difficulty. This result is related with [14] finding which indicates that Agro ecology was positively and significantly related with assembler outlet.
Distance from the Nearest Market: It is positively associated with likelihood of producers selling to collector and negatively with wholesaler at 5% and 10% significance level, respectively. This result reflects that household located far away from the nearest market center faces difficulty in delivering honey to the markets due to poor transport facility and labour requirements. Hence, they sold to available honey market outlets in their locality. As
a result, supplying honey to markets requires transportation cost, but collectors purchase honey at farm gate from beekeepers by going door to door during the harvesting season which reduces transportation cost and labour for producers. This result is in line with [9] and [10] finding that showed distance to nearest market was positively and significantly related to the outlet choice of collectors and negatively with wholesaler outlet.
Volume of Honey Supply to the Market: It influences positively the likelihood of choosing collector and wholesaler at 1% and consumer market outlet at 10% significance level. This indicated that producers with large volume of honey marketed were more likely to sell to collector, wholesaler and consumer. This is because the wholesalers have the capacity to purchase large quantity of honey as well as consumers can buy from producers at market place. This result is in line with [9] and [10] findings that showed volume of honey supply influences positively the cooperative and wholesaler outlet choices, respectively.
Frequency of Extension Contact: It has a positive and significant influence on wholesaler outlet choice decision at 5% level of significance. Extension services increase the ability of farmers to acquire important market information. Thus, producers who were visited more by extension agents were more likely to deliver honey via wholesaler, because extension service is related with good production, product handling and marketing. In other case wholesalers can buy in large volume with reasonable price. This result is similar to the study by [8] and [9] that confirms regular contact with extension functionaries had a positive influence on the likelihood of cooperative and trader market outlets.
Summary, Conclusion and Recommendation
- Summary and Conclusion
The study focused on determining factors affecting market outlet choice of honey producers in the study area. Quantitative methodologies were used and the data were collected from a total of 150 producers using structured questionnaires. Inferential statistics and econometric (multivariate probit) models were used to analyze the data collected using STATA Software and excel sheet.
Most producers sell their products to traders while some sales to consumers and processors. However, it is also indicated that wholesalers and collectors directly purchase honey from producers and additionally wholesalers purchase from collectors. The correlations between honey producers choice of collector and wholesaler outlet were negative and statistically significant like the correlation between the processor and consumer outlet. The model result also revealed that the likelihood of households to choose collector, wholesaler, processor and consumer market outlet were 61.95%, 68.81%, 50.81% and 58.62%, respectively, with 18.06% and 3.67% joint probability of success and failure, respectively. The model also confirms that household head educational level, agro ecology, market distance, frequency of extension contact, market information and volume of honey marketed have a significant effect on market outlet choices of sampled households.
- Recommendation
From the result of the finding, the following recommendation can be made for policy measures. The volume of honey supply affects about three outlets which were an indication for improving the production of honey to be marketed needs government and support service provider interventions to promote and establish honey collection centers (cooperative) in potential production areas for effective marketing of honey.
Distance to the nearest market and agro ecology of honey producers affects two market outlets. This implies that there is variation in facility available depending on agro ecology differences and distances from the district honey market which needs great concern to be facilitated. Therefore, the government and NGOs should give attention to provide infrastructures for the distant producer as well as equally for lowland as midland honey producers. This will motivate a lot of farmers to participate in the honey market supply by increasing their income and choice of appropriate outlets.
Educational status of the household head, access to market information and frequency of extension contact significantly and positively affect market outlet choices of producers. Because of this, the government should improve DAs capacity through training and supporting DAs by separating them from other administrative activities to support and aware farmers only by extension provision in order to get market information, to create initiation and competition between farmers for honey market outlet choices.
Declaration of Interest
The Authors declare that they have no competing interest.
Funding
None
Authors’ Contribution
The data collection, data analyzing, and drafting of the manuscript was done by Besha Teresa Borena. Fikadu Mitiku and Chala Hailu primary role in the paper is the revision of the drafted manuscript and guidance on additional interpretation of the results. All authors have read and approved the final manuscript.
Acknowledgements
I would like to appreciate and thanks sampled beekeepers and Abuna Gindeberet Livestock and Fisher Development office staff members and other collaborated individuals those helped me during the survey period for their support and cooperation in giving necessary information.
References
- FAOSTAT (2015) FAOSTAT (Database). Food and Agriculture Organization of the Nations, USA.
- Workneh AW (2011) Identification and Documentation of Indigenous Knowledge of Beekeeping Practices in Selected Districts of Ethiopia. Journal of Agricultural Extension and Rural Development 3: 82-87.
- Awraris GS, Yemisarach G, Degan A, Nuri A, Gebayo G, et al. (2012) Honey Production Systems (Apis mellifera L.) in Kaffa, Sheka and Bench-Maji zones of Ethiopia. Journal of Agricultural Extension and Rural Development 4: 528-541.
- Ministry of Agriculture (MoA) and International Livestock Research Institute (ILRI) (2013) Apiculture Value Chain Vision and Strategy for Ethiopia (2). Addis Ababa, Ethiopia.
- Shewaye A (2016) Econometric Analysis of Factors Affecting Haricot Bean Market Outlet Choices in Misrak Badawacho District, Ethiopia. International Journal of Research Studies in Agricultural Sciences 2: 6-12.
- Berhanu K, Derek B, Kindie G, Belay K (2013) Factors Affecting Milk Market Outlet Choices in Wolaita Zone, Ethiopia. African Journal of Agricultural Research 8: 2493-2501.
- Moti J, Berhanu G (2012) Interdependence of Smallholders’ Net Market Positions in Mixed Crop-Livestock Systems of Ethiopian Highlands. Journal of Development and Agricultural Economics 4: 199-209.
- Metages B, Zekariyas Sh, Tinsae D (2017) Determinants of Beekeepers Market Outlet Choice of Honey: In Case of Masha Woreda Sheka Zone, Southwestern Ethiopia. Journal Food Science and Quality Management 64.
- Kasa T, Jamal H, Bosena T (2017) Determinants of honey producer market outlet choice in Chena District, southern Ethiopia: a multivariate probit regression analysis. Agricultural and food economics 5: 20.
- Ayantu A (2018) Honey Value Chain Analysis in Gera District, Jimma Zone of Oromia National Regional State, Ethiopia. Haramaya University, Ethiopia.
- Cochran WG (1977) Sampling Techniques, 2nd Ed., New York: John Wiley and Sons, Inc.
- Cappellari L, Jenkins SP (2003) Multivariate Probit Regression Using Simulated Maximum Likelihood. The Stata Journal 3: 278-294.
- Addis NM (2016) Value Chain Analysis of Honey: Samien Shewa Zone of Amhara Ethiopia; Case of Basona Worena Woreda (Doctoral dissertation, St. Mary's University).
- Taye M (2016) Determinants of Market Supply and Outlet Choices by Smallholder Onion Farmers in Fogera District Amhara Region, Northwestern Ethiopia. Gondar University, Ethiopia.
Citation: Borena BT, Mitiku F, Hailu C (2023) Multivariate Probit Regression Analysis of Beekeepers Market Outlet Choices: The Case of Abuna Gindeberet District of Oromia Region, Ethiopia. J Agron Agri Sci 6: 044
Copyright: © 2023 Besha Teresa Borena, et al. This is an open-access article distributed under the terms of the Creative Commons Attribution License, which permits unrestricted use, distribution, and reproduction in any medium, provided the original author and source are credited.