Our Experiences with Bi-Planar Mastopexy-Augmentation
*Corresponding Author(s):
Recep AnlaticiDepartment Of Aesthetic Plastic And Reconstructive Surgery, Sanko University, Gaziantep, Turkey
Tel:+90 05326760599,
Email:recepanlatici@hotmail.com
Abstract
By observing some restrictions with the widely performed mastopexy-augmentation operation solely involving the subglandular plane, we modified the method into a two-plane intervention in a number of selected cases. In this retrospective clinical study, we aimed to share our experiences with single stage bi-planar mastopexy-augmentation.
Methods
We performed a vertical mammoplasty and dissected both the subglandular plane, to fix the glandular tissue to a higher pectoral fascial level, and the submuscular plane to insert the implant. Additionally, we utilized either the superior-median dermofat or the dermoglandular flap to cover the implants completely or incompletely, aiming for a more stabilized vertical closure. The results were assessed retrospectively and statistically.
Results
Thirty-six cases (72 breasts) were included in the study. The average age was 42 years and the average follow-up period was 13 months. The mean sizes of the implants were 211.81±67.48cc for the right breasts and 213.19±66.41cc for the left breasts. Twenty-eight cases (77.78%) were classified as primary and the remaining eight (22.22%) as secondary. Revision operations were demanded in five (13.89%) cases, three (10.71%) in the primary and two (25%) in the secondary group. Postoperative complications were observed in 50% of the study population and also 50% of each group. However, whereas all complications were identified as major in the secondary group, only three cases (10.71%) of major complications were reported in the primary group. There was a significant statistical relationship between the grade of ptosis and minor complications (for which the grade 3 ptosis group was responsible). Problems due to previous breast operations of the secondary group were significantly correlated with the major problems in our study population. However, the grade of ptosis, implant volume, and previous mastopexy-augmentation operation were not related with the revision operations and postoperative complications.
Conclusion
We believe that, in select cases, it is feasible to perform bi-planar mastopexy-augmentation to overcome the limitations of the widely performed one-plane method. However, potential postoperative complications should be taken into consideration and more caution in secondary cases is needed due to higher complication rates.
Keywords
INTRODUCTION
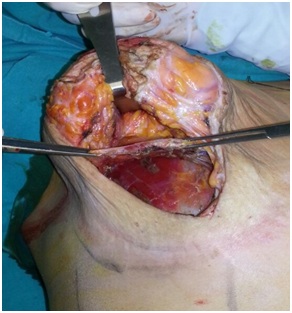 Figure 1: Submuscular and subglandular pockets during superior pedicle vertical mastopexy-augmentation. The pectoralis muscle is grasped and elevated, and the glandular tissue is retracted.
MATERIALS AND METHODS
Double pocket mastopexy-augmentation was employed in cases where the classical single plane method was not possible; the restriction of the subglandular space following Lejour’s fixing suture [9,10] and existence of severe capsular contraction in secondary cases were the two main factors. We used a vertical mammaplasty technique and fixed the breast tissue at the areola-nipple level to the uppermost part of the pectoral fascia as described by Lejour; [9,10] the rationale behind the use of this technique was to improve the stability of the results and gain increased fullness in the upper portion of the breasts. The implants were placed in the subpectoral pockets after the medial-inferior origins of the pectoralis muscles were detached. Evaluation of the tightness of the vertical suture line and the decision on the necessity of additional skin removal was made by testing different volumes of implant sizers and temporary staplers. Limited elevation of the skin edges on the lateral pillars was carried out if required in order to reduce the tension on the suture lines. Placing the implant in the desired position enabled the superomedian dermoglandular or dermofat flap to cover the implant completely or incompletely (Figure 2); this reduced the risk of implant injury during wound closure of the wound or, with regards to postoperative wound healing, the risk of implant exposure.
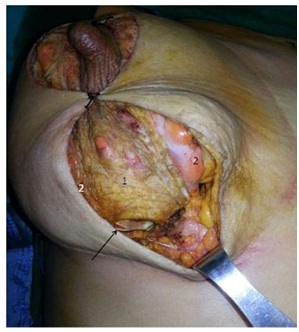 Figure 2: The superomedian flap and the lateral pillars are indicated as 1 and 2, respectively. The implant (arrow) is covered with the superomedian flap.
STATISTICAL ANALYSIS
RESULTS
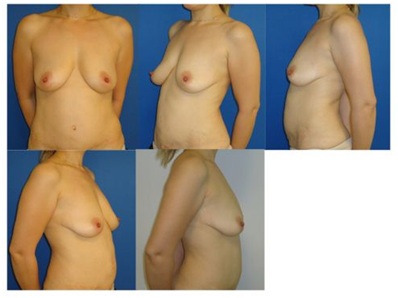
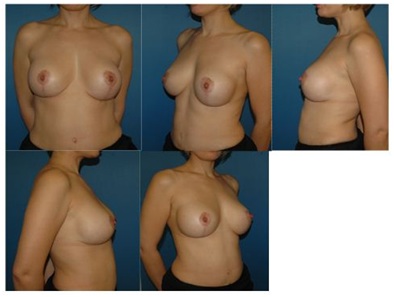 Figure 4: Postoperative images of case 28 after 12 months (250cc smooth high-profile implants).
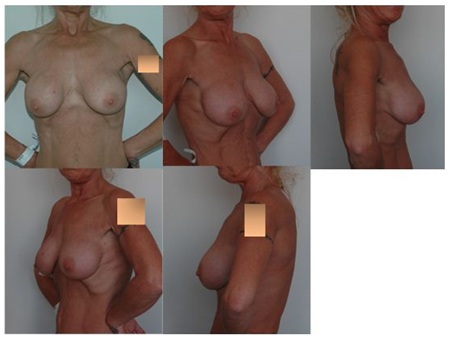 Figure 5: Preoperative images of case 29, who was admitted with deformities due to capsule contraction after an augmentation procedure. Implants were removed with their surrounding capsules (small image, bottom right).
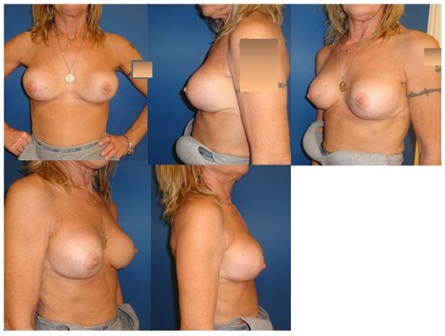 Figure 6: Postoperative images of case 29 after 22 months (smooth high profile 2x250cc new implants).
|
Case # |
Diagnosis and Grade of ptosis |
Primary (P)orSecondary (S) |
Implant cc (right) |
Implant |
|
1 |
3 |
P |
100 |
100 |
|
2 |
1 |
P |
125 |
125 |
|
3 |
1 |
P |
125 |
125 |
|
4 |
2 |
P |
125 |
125 |
|
5 |
Pseudoptosis |
P |
125 |
125 |
|
6 |
1 |
P |
150 |
175 |
|
7 |
1 |
P |
150 |
175 |
|
8 |
1 |
S |
150 |
150 |
|
9 |
3 |
P |
150 |
150 |
|
10 |
pseudoptosis and gr 3 contracture |
S |
150 |
150 |
|
11 |
2 |
P |
175 |
175 |
|
12 |
3 |
P |
175 |
200 |
|
13 |
3 |
P |
175 |
150 |
|
14 |
3 |
P |
175 |
175 |
|
15 |
pseudoptosis |
P |
175 |
175 |
|
16 |
2 |
P |
200 |
200 |
|
17 |
2 |
P |
200 |
200 |
|
18 |
3 |
P |
200 |
200 |
|
19 |
1 |
P |
225 |
225 |
|
20 |
2 |
P |
225 |
250 |
|
21 |
2 |
P |
225 |
225 |
|
22 |
Pseudoptosis |
P |
225 |
225 |
|
23 |
2 |
P |
250 |
250 |
|
24 |
2 |
P |
250 |
250 |
|
25 |
2 |
P |
250 |
250 |
|
26 |
2 |
P |
250 |
250 |
|
27 |
3 |
P |
250 |
250 |
|
28 |
3 |
P |
250 |
250 |
|
29 |
capsule contracture, malposition |
S |
250 |
250 |
|
30 |
capsule contracture |
S |
250 |
250 |
|
31 |
2 |
P |
275 |
250 |
|
32 |
pseudoptosis and gr 3 contracture |
S |
275 |
275 |
|
33 |
1, malposition |
S |
300 |
300 |
|
34 |
1 |
P |
300 |
300 |
|
35 |
pseudoptosis and gr 3 contracture |
S |
350 |
350 |
|
36 |
Pseudoptosis |
S |
400 |
400 |
|
Descriptive Statistics |
|||||
|
|
N |
Minimum |
Maximum |
Mean |
Std. Deviation |
|
Implant cc R |
36 |
100 |
400 |
211,81 |
67,476 |
|
Implant cc L |
36 |
100 |
400 |
213,19 |
66,409 |
|
Valid N (listwise) |
36 |
|
|
|
|
|
|
|||
|
Primary (P) and Secondary (S) Groups |
Implant cc R |
Implant cc L |
|
|
Primary group |
N |
28 |
28 |
|
Mean |
196,43 |
198,21 |
|
|
Std. Deviation |
53,017 |
51,787 |
|
|
Secondary group |
N |
8 |
8 |
|
Mean |
265,63 |
265,63 |
|
|
Std. Deviation |
87,564 |
87,564 |
|
|
Total |
N |
36 |
36 |
|
Mean |
211,81 |
213,19 |
|
|
Std. Deviation |
67,476 |
66,409 |
|
|
Group Statistics |
|||||
|
|
Primary (P) or Secondary (S) |
N |
Mean |
Std. Deviation |
Std. Error of Mean |
|
Implant cc R |
Primary |
28 |
196,43 |
53,017 |
10,019 |
|
Secondary |
8 |
265,63 |
87,564 |
30,958 |
|
|
Implant cc L |
Primary |
28 |
198,21 |
51,787 |
9,787 |
|
Secondary |
8 |
265,63 |
87,564 |
30,958 |
|
|
Case # |
Revision performed for |
Major postoperative complications |
Minor postoperative complications |
|
1 |
Widened scar |
Widened scar |
|
|
5 |
Asymmetry |
Mild Asymmetry |
|
|
7 |
Mild Asymmetry |
||
|
9 |
Mild Asymmetry |
||
|
10 |
Wound opening managed by operation + asymmetry |
||
|
11 |
Mild sagging |
||
|
13 |
Mild sagging |
||
|
14 |
Mild sagging |
||
|
16 |
Implant exposure |
||
|
17 |
Asymmetry |
Asymmetry |
|
|
23 |
Hematoma |
||
|
25 |
Mild sagging |
||
|
26 |
Mild Asymmetry |
||
|
27 |
Wound problem with secondary healing |
||
|
28 |
Mild sagging |
||
|
32 |
Implant exposure |
||
|
33 |
Capsule contracture gr 3 + asymmetry |
Capsule contracture grade 3 + asymmetry |
|
|
35 |
Asymmetry |
Wound problem with secondary healing + asymmetry |
We investigated whether the number of revision operations and postoperative complications (minor, major, or total) were significantly correlated with the ptosis level, implant volume, and previous mastopexy-augmentation operation (Tables 5-16). Results demonstrated a significant relationship between the grade of ptosis and the minor complications (for which the grade 3 ptosis group was responsible). Major complications were seen significantly more frequent in the secondary group. All other correlations were insignificant.
|
Crosstab |
|||||
|
|
Revision performed |
Total |
|||
|
No |
Yes |
||||
|
Grade of ptosis |
Grade 1 |
Count |
7 |
1 |
8 |
|
% within Grade of ptosis |
87,5% |
12,5% |
100,0% |
||
|
% of Total |
19,4% |
2,8% |
22,2% |
||
|
Grade 2 |
Count |
10 |
1 |
11 |
|
|
% within Grade of ptosis |
90,9% |
9,1% |
100,0% |
||
|
% of Total |
27,8% |
2,8% |
30,6% |
||
|
Grade 3 |
Count |
7 |
1 |
8 |
|
|
% within Grade of ptosis |
87,5% |
12,5% |
100,0% |
||
|
% of Total |
19,4% |
2,8% |
22,2% |
||
|
Pseudoptosis |
Count |
7 |
2 |
9 |
|
|
% within Grade of ptosis |
77,8% |
22,2% |
100,0% |
||
|
% of Total |
19,4% |
5,6% |
25,0% |
||
|
Total |
Count |
31 |
5 |
36 |
|
|
% within Grade of ptosis |
86,1% |
13,9% |
100,0% |
||
|
% of Total |
86,1% |
13,9% |
100,0% |
||
|
Crosstab |
|||||
|
|
Major postoperative complications |
Total |
|||
|
No |
Yes |
||||
|
Grade of ptosis |
Grade 1 |
Count |
7 |
1 |
8 |
|
% within Grade of ptosis |
87,5% |
12,5% |
100,0% |
||
|
% of Total |
19,4% |
2,8% |
22,2% |
||
|
Grade 2 |
Count |
8 |
3 |
11 |
|
|
% within Grade of ptosis |
72,7% |
27,3% |
100,0% |
||
|
% of Total |
22,2% |
8,3% |
30,6% |
||
|
Grade 3 |
Count |
8 |
0 |
8 |
|
|
% within Grade of ptosis |
100,0% |
0,0% |
100,0% |
||
|
% of Total |
22,2% |
0,0% |
22,2% |
||
|
Pseudoptosis |
Count |
6 |
3 |
9 |
|
|
% within Grade of ptosis |
66,7% |
33,3% |
100,0% |
||
|
% of Total |
16,7% |
8,3% |
25,0% |
||
|
Total |
Count |
29 |
7 |
36 |
|
|
% within Grade of ptosis |
80,6% |
19,4% |
100,0% |
||
|
% of Total |
80,6% |
19,4% |
100,0% |
||
|
Crosstab |
|||||
|
|
Minor postoperative complications |
Total |
|||
|
No |
Yes |
||||
|
Grade of ptosis |
Grade 1 |
Count |
7 |
1 |
8 |
|
% within Grade of ptosis |
87,5% |
12,5% |
100,0% |
||
|
% of Total |
19,4% |
2,8% |
22,2% |
||
|
Grade 2 |
Count |
8 |
3 |
11 |
|
|
% within Grade of ptosis |
72,7% |
27,3% |
100,0% |
||
|
% of Total |
22,2% |
8,3% |
30,6% |
||
|
Grade 3 |
Count |
2 |
6 |
8 |
|
|
% within Grade of ptosis |
25,0% |
75,0% |
100,0% |
||
|
% of Total |
5,6% |
16,7% |
22,2% |
||
|
Pseudoptosis |
Count |
8 |
1 |
9 |
|
|
% within Grade of ptosis |
88,9% |
11,1% |
100,0% |
||
|
% of Total |
22,2% |
2,8% |
25,0% |
||
|
Total |
Count |
25 |
11 |
36 |
|
|
% within Grade of ptosis |
69,4% |
30,6% |
100,0% |
||
|
% of Total |
69,4% |
30,6% |
100,0% |
||
|
Crosstab |
|||||
|
|
Total postoperative complications |
Total |
|||
|
No |
Yes |
||||
|
Grade of ptosis |
Grade 1 |
Count |
6 |
2 |
8 |
|
% within Grade of ptosis |
75,0% |
25,0% |
100,0% |
||
|
% of Total |
16,7% |
5,6% |
22,2% |
||
|
Grade 2 |
Count |
5 |
6 |
11 |
|
|
% within Grade of ptosis |
45,5% |
54,5% |
100,0% |
||
|
% of Total |
13,9% |
16,7% |
30,6% |
||
|
Grade 3 |
Count |
2 |
6 |
8 |
|
|
% within Grade of ptosis |
25,0% |
75,0% |
100,0% |
||
|
% of Total |
5,6% |
16,7% |
22,2% |
||
|
Pseudoptosis |
Count |
5 |
4 |
9 |
|
|
% within Grade of ptosis |
55,6% |
44,4% |
100,0% |
||
|
% of Total |
13,9% |
11,1% |
25,0% |
||
|
Total |
Count |
18 |
18 |
36 |
|
|
% within Grade of ptosis |
50,0% |
50,0% |
100,0% |
||
|
% of Total |
50,0% |
50,0% |
100,0% |
||
|
Group Statistics |
|||||
|
|
Revision performed for |
N |
Mean |
Std. Deviation |
Std. Error Mean |
|
Implant cc R |
No |
31 |
211,29 |
61,182 |
10,989 |
|
Yes |
5 |
215,00 |
108,397 |
48,477 |
|
|
Implant cc L |
No |
31 |
212,90 |
59,816 |
10,743 |
|
Yes |
5 |
215,00 |
108,397 |
48,477 |
|
|
Group Statistics |
|||||
|
|
Major postoperative complications |
N |
Mean |
Std. Deviation |
Std. Error Mean |
|
Implant cc R |
No |
29 |
203,45 |
65,712 |
12,202 |
|
Yes |
7 |
246,43 |
68,357 |
25,836 |
|
|
Implant cc L |
No |
29 |
205,17 |
64,566 |
11,990 |
|
Yes |
7 |
246,43 |
68,357 |
25,836 |
|
|
Group Statistics |
|||||
|
|
Minor postoperative complications |
N |
Mean |
Std. Deviation |
Std. Error Mean |
|
Implant cc R |
No |
25 |
223,00 |
70,312 |
14,062 |
|
Yes |
11 |
186,36 |
55,186 |
16,639 |
|
|
Implant cc L |
No |
25 |
225,00 |
68,465 |
13,693 |
|
Yes |
11 |
186,36 |
55,186 |
16,639 |
|
|
Group Statistics |
|||||
|
|
Total postoperative complications |
N |
Mean |
Std. Deviation |
Std. Error Mean |
|
Implant cc R |
No |
18 |
213,89 |
70,826 |
16,694 |
|
Yes |
18 |
209,72 |
65,943 |
15,543 |
|
|
Implant cc L |
No |
18 |
216,67 |
68,599 |
16,169 |
|
Yes |
18 |
209,72 |
65,943 |
15,543 |
|
|
Crosstab |
|||||
|
|
Revision performed for |
Total |
|||
|
No |
Yes |
||||
|
Primary (P) or Secondary (S) |
Primary |
Count |
25 |
3 |
28 |
|
% within Primary (P) |
89,3% |
10,7% |
100,0% |
||
|
% of Total |
69,4% |
8,3% |
77,8% |
||
|
Secondary |
Count |
6 |
2 |
8 |
|
|
% within Primary (P) |
75,0% |
25,0% |
100,0% |
||
|
% of Total |
16,7% |
5,6% |
22,2% |
||
|
Total |
Count |
31 |
5 |
36 |
|
|
% within Primary (P) |
86,1% |
13,9% |
100,0% |
||
|
% of Total |
86,1% |
13,9% |
100,0% |
||
|
Crosstab |
|||||
|
Major postoperative complications |
Total |
||||
|
No |
Yes |
||||
|
Primary (P) or Secondary (S) |
Primary |
Count |
25 |
3 |
28 |
|
% within Primary (P) Secondary (S) |
89,3% |
10,7% |
100,0% |
||
|
% of Total |
69,4% |
8,3% |
77,8% |
||
|
Secondary |
Count |
4 |
4 |
8 |
|
|
% within Primary (P)Secondary (S) |
50,0% |
50,0% |
100,0% |
||
|
% of Total |
11,1% |
11,1% |
22,2% |
||
|
Total |
Count |
29 |
7 |
36 |
|
|
% within Primary (P)Secondary (S) |
80,6% |
19,4% |
100,0% |
||
|
% of Total |
80,6% |
19,4% |
100,0% |
||
|
Crosstab |
|||||
|
|
Minor postoperative complications |
Total |
|||
|
No |
Yes |
||||
|
Primary (P) or Secondary (S) |
Primary |
Count |
17 |
11 |
28 |
|
% within Primary (P) |
60,7% |
39,3% |
100,0% |
||
|
% of Total |
47,2% |
30,6% |
77,8% |
||
|
Secondary |
Count |
8 |
0 |
8 |
|
|
% within Primary (P) |
100,0% |
0,0% |
100,0% |
||
|
% of Total |
22,2% |
0,0% |
22,2% |
||
|
Total |
Count |
25 |
11 |
36 |
|
|
% within Primary (P) |
69,4% |
30,6% |
100,0% |
||
|
% of Total |
69,4% |
30,6% |
100,0% |
||
|
Crosstab |
|||||
|
|
Total postoperative complications |
Total |
|||
|
No |
Yes |
||||
|
Primary (P) or Secondary (S) |
Primary |
Count |
14 |
14 |
28 |
|
% within Primary (P)Secondary (S) |
50,0% |
50,0% |
100,0% |
||
|
% of Total |
38,9% |
38,9% |
77,8% |
||
|
Secondary |
Count |
4 |
4 |
8 |
|
|
% within Primary (P)Secondary (S) |
50,0% |
50,0% |
100,0% |
||
|
% of Total |
11,1% |
11,1% |
22,2% |
||
|
Total |
Count |
18 |
18 |
36 |
|
|
% within Primary (P)Secondary (S) |
50,0% |
50,0% |
100,0% |
||
|
% of Total |
50,0% |
50,0% |
100,0% |
||
DISCUSSION
In two-plane mastopexy-augmentation, positioning the implant on a desired higher level may enable the surgeon to cover the implant with muscle superiorly and superomedian dermoglandular or dermofat flap inferiorly, decreasing the risk of implant exposure during wound healing. We also believe that the submuscular plane enables the surgeon to use smooth surface implants, which can slide inside and adapt to postoperative changes in the breast shape.
Beale et al., [11] investigated Rohrich’s 83 mastopexy-augmentation cases retrospectively and determined a number of important safety criteria, these included precise preoperative marking, the use of 8cm vertical limbs with broad pedicle base, limited undermining of thick skin flaps, small subpectoral implants (<200ml), and the movement of nipple no more than 4cm. They stated that the use of smaller subpectoral implants results in minimal skin flap and nipple loss. They also advocated minimal capsule removal in secondary cases so as not to compromise the vascular network of the flaps. We agree with these points and additionally, we would like to contribute that the capsule is an ideal tissue to fix the lifted breast to; this results in a safer wound closure, especially in cases that involve closing the skin just above the implant surface. In cases where there is severe capsule contraction in the subglandular plane, a second plane (the submuscular plane) would be an ideal place to insert the implant. Furthermore, the capsule itself would be a very effective tissue on which to hold the lifting sutures. Therefore, the two-plane method may be a suitable option to manage secondary cases with severe capsule contractions.
In our study, the rates of revision operations and postoperative major complications were 13.89% and 19.44%, respectively. Khavanin et al., [3] performed a meta-analysis of single stage mastopexy-augmentation by reviewing 23 studies. They found the approximate reoperation rate to be 10.7% (6.7%-15.4%) and the complication rate to be 13.1% (6.7%-21.3%). Our results are comparable with these findings. However, we believe that the patients should be informed profoundly about all potential problems after one stage mastopexy-augmentation operations.
We observed that asymmetries and bad scar formation were the most frequently reported complications. Most asymmetries were due to tissue laxity and sagging, especially on the inferior pole of the breast. This has the potential to create a dilemma in that the tightness of the lateral pillars may result in wound healing issues, even as severe as implant exposure; on the other hand, the laxity of the lateral pillars may cause sagging. Excision of the sagged area as a secondary procedure is usually sufficient to obtain the desired shape.
We found that major complications were significantly more frequent in the secondary group; this could be due to the larger implant volumes in the secondary group. However, there was no statistical correlation between the implant volumes and the major complications. Nevertheless, it should be taken into consideration that the main limitation of this study was the lower number of cases in the secondary group. On the other hand, Beale et al., [11] recommended smaller implants to avoid the aforementioned complications. In spite of small study population of the second group, we recommend caution for the secondary mastopexy-augmentation cases.
CONCLUSION
CONFLICTS OF INTEREST AND SOURCE OF FUNDING
REFERENCES
- Spear SL (2006) Augmentation/Mastopexy: "surgeon, beware". Plast Reconstr Surg 118: 133-134.
- Spear SL, Boehmler JH 4th, Clemens MW (2006) Augmentation/mastopexy: A 3-year review of a single surgeon’s practice. Plast Reconstr Surg 118:136-147.
- Khavanin N, Jordan SW, Rambachan A, Kim JY (2014) A systematic review of single-stage augmentation-mastopexy. Plast Reconstr Surg 134: 922-931.
- Castello MF, Silvestri A, Nicoli F, Dashti T, Han S, et al. (2014) Augmentation mammoplasty/mastopexy: Lessons learned from 107 aesthetic cases. Aesthetic Plast Surg 38: 896-907.
- Stevens WG, Stoker DA, Freeman ME, Quardt SM, Hirsch EM, et al. (2006) Is one-stage breast augmentation with mastopexy safe and effective? A review of 186 primary cases. Aesthet Surg J 26: 674-681.
- Swanson E (2013) Prospective comparative clinical evaluation of 784 consecutive cases of breast augmentation and vertical mammaplasty, performed individually and in combination. Plast Reconstr Surg 132: 30-45.
- Lee MR, Unger JG, Adams WP Jr. (2014) The tissue-based triad: A process approach to augmentation mastopexy. Plast Reconstr Surg 134: 215-225.
- Stevens WG, Macias LH, Spring M, Stoker DA, Chacón CO, et al. (2014) One-Stage Augmentation Mastopexy: A Review of 1192 Simultaneous Breast Augmentation and Mastopexy Procedures in 615 Consecutive Patients. Aesth Surg J 34: 723-732.
- Lejour M (1994) Vertical mammaplasty and liposuction of the breast. Plast Reconstr Surg 94: 100-114.
- Lejour M (1999) Vertical mammaplasty: Update and appraisal of late results. Plast Reconstr Surg 104: 771-781.
- Beale EW, Ramanadham S, Harrison B, Rasko Y, Armijo B, et al. (2014) Achieving predictability in augmentation mastopexy. Plast Reconstr Surg 133: 284-292.
Citation: Anlat?c? R (2019) Our Experiences with Bi-Planar Mastopexy-Augmentation, J Surg Curr Trend Innov 3: 019.
Copyright: © 2019 Recep Anlatici, et al. This is an open-access article distributed under the terms of the Creative Commons Attribution License, which permits unrestricted use, distribution, and reproduction in any medium, provided the original author and source are credited.