Performance of Soybean Genotypes under Rhizobia Inoculation across Three Agro Ecologies of Nigeria
*Corresponding Author(s):
Tolorunse KDDepartment Of Crop Production, Federal University Of Technology, Minna, Nigeria
Tel:+234 07036411724,
Email:kehinde.tolorunse@futminna.edu.ng
Abstract
Keywords
INTRODUCTION
Soybean contains a good quality protein of 42 % and 19.5 % oil [2]. Soybean protein is considered complete, because it supplies sufficient amounts of the types of amino acids that are required by the body for building and repair of tissues [4]. Essential amino acids found in soybean are methionine, isoleucine, lysine, cystine, phenylalanine, tyrosine, theonine, tryphophan as well as valine [5]. Amino acids are used in the formation of protoplasm, the site for cell division and therefore facilitate plant growth and development. Soybean has been found to have different uses; for example in food industry, soybean is used for flour, oil, cookies, candy, milk, vegetable cheese, lea thin and many other products [6].
There is need to improve on soybean yield potentials per unit area in the tropics, at least to the world average productivity level. To achieve this, attention has to be paid to the selection of high yielding and stable genotypes through plant breeding/improvement programmes. In plant improvement programmes, knowledge of the genetic variability and the adequate eva1uation of breeding materials under several environments are of paramount importance. With the identification of high-yielding and well-adapted soybean genotypes, breeders can make recommendations to farmers, for soybean production in specific environments and across environments, which is expected to address the yield gap presently experienced in Nigerian agro ecologies. Therefore the objectives0of the study was to eva1uate the performance of soybean lines in individual environments and across environments, evaluate yield stability of the lines across the three environments and select superior advanced lines in the test environments for yield evaluation trial.
METHODOLOGY
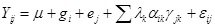
Cypermethrin (Best) at the rate of 0.14 kg a.i ha-1 [7] was applied once on the seedlings with knapsack sprayer to control insect pests infestation. In each of the location and year of research, seed yield was taken in which seeds were separated from the husk and kept in labelled bags representing respective plots and then converted to kilogram per hectare. Data collected were subjected to Analysis of Variance (ANOVA) using General Linear Model (GLM) procedure of SAS [8]. Level of significance was determined at 5%. Means were separated using Duncan Multiple Range Test at p = 0.05. To determine genotypic sensitivity and stability, linear regression and correlation model was used. Additive Main Effect and Multiplicative Interaction (AMMI) were used to determine the stability pattern of the genotypes across the locations. The AMMI model is
RESULTS AND DISCUSSION
|
Treatment |
2015 |
2016 |
Combined |
|
Genotypes (G) |
|||
|
TGx 1989-11F |
1659.2cd |
1545.1dc |
1602.1c |
|
TGx 1990-110FN |
2717.5ab |
1839.0ab |
2278.3a |
|
TGx 1989 -42FN |
1590.6cd |
1676.5bc |
1633.6c |
|
TGx 1990 -95F |
1514.2d |
1544.6cd |
1529.4c |
|
TGx 1989-45F |
1989.8ab |
1820.1ab |
1905.0ab |
|
TGx 1990-114FN |
1558.8cd |
1611.3cd |
1585.0c |
|
TGx 1989-53FN |
1613.0cd |
1498.9d |
1556.0c |
|
TGx 1993-4FN |
1581.8cd |
1601.0cd |
1591.4c |
|
TGx 1989-75FN |
1573.1cd |
1592.3cd |
1582.7c |
|
TGx 1990-78F |
1563.6cd |
1582.8cd |
1573.2c |
|
TGx 1967-62F(Check) |
1722.7bc |
1738.6bc |
1730.7bc |
|
TGx 1448-2E(Check) |
1658.7cd |
1655.7bc |
1657.2c |
|
TGx 1989-40F |
1583.3cd |
1647.0bc |
1615.2c |
|
TGx 1990-52F |
1657.3cd |
1693.2bc |
1675.3c |
|
TGx 1989-48FN |
1752.9bc |
1816.5bc |
1784.7bc |
|
TGx 1990-40F |
1699.1bc |
1762.7bc |
1730.9bc |
|
TGx 1989-49FN |
1996.4ab |
1982.3ab |
1989.4ab |
|
TGx 1990-57F |
1707.4bc |
1771.1bc |
1739.2bc |
|
TGx 1989-68FN |
1696.7bc |
1727.0bc |
1711.9bc |
|
TGx 1990-46F |
2060.0a |
2145.9a |
2102.9a |
|
TGx 1990-55F |
1859.5ab |
1801.0bc |
1830.2bc |
|
TGx 1987-10F(Check) |
1741.8bc |
1794.4bc |
1768.1bc |
|
TGx 1835-10E(Check) |
1743.7bc |
1851.9ab |
1797.8bc |
|
TGx 1485-1D(Check) |
1753.0bc |
1872.2ab |
1812.6bc |
|
±SE |
112.7 |
109.3 |
122.2 |
|
Inoculation(I) |
|||
|
Without inoculation |
1204.0c |
1250.2b |
1239.7c |
|
Nodu Max |
1882.1b |
1912.8a |
1892.0b |
|
Legume Fix |
1988.1a |
2008.3a |
1991.0a |
|
±SE |
38.3 |
42 |
39.5 |
|
Interaction |
|||
|
G x I |
NS |
* |
NS |
|
Genotypes |
Without |
Nodu Max |
Legume Fix |
|
TGx 1989-11F |
1189.1j |
1530.9f |
1915.2b |
|
TGx 1990-110FN |
1299.4i |
2118.3a |
2099.3a |
|
TGx 1989 -42FN |
1236.1i |
1777.5d |
2016.0a |
|
TGx 1990 -95F |
1185.6j |
1836.3c |
1611.8e |
|
TGx 1989-45F |
1122.7j |
1965.6b |
1772.1d |
|
TGx 1990-114FN |
1172.6j |
1746.4d |
1915.0b |
|
TGx 1989-53FN |
1158.9j |
1701.9d |
1636.0e |
|
TGx 1993-4FN |
1197.9j |
1828.7c |
1776.4d |
|
TGx 1989-75FN |
1270.5i |
1743.7d |
1762.6d |
|
TGx 1990-78F |
1181.5i |
1696.4e |
1870.7c |
|
TGx 1967-62F(Check) |
1238.1i |
1814.3c |
2163.5a |
|
TGx 1448-2E(Check) |
1317.6h |
1734.7d |
1914.9b |
|
TGx 1989-40F |
1317.8h |
1874.3c |
1748.8d |
|
TGx 1990-52F |
1244.3i |
1931.3b |
1904.0b |
|
TGx 1989-48FN |
1345.6h |
2125.2a |
1978.7b |
|
TGx 1990-40F |
1212.7i |
2148.9a |
1926.5b |
|
TGx 1989-49FN |
1168.3j |
2229.3a |
2549.3a |
|
TGx 1990-57F |
1329.9h |
1904.0b |
2079.1a |
|
TGx 1989-68FN |
1341.6h |
1759.0d |
2080.3a |
|
TGx 1990-46F |
1326.8h |
2588.8a |
2521.9a |
|
TGx 1990-55F |
1144.8i |
1911.6b |
2346.3a |
|
TGx 1987-10F(Check) |
1314.1h |
1987.0b |
2081.8a |
|
TGx 1835-10E(Check) |
1245.0i |
2025.7a |
2284.7a |
|
TGx 1485-1D(Check) |
1443.7g |
1929.2b |
2243.7a |
|
1 |
2 |
3 |
4 |
5 |
6 |
7 |
8 |
9 |
10 |
|
|
1 |
1 |
|||||||||
|
2 |
0.564* |
1 |
||||||||
|
3 |
0.621* |
0.719* |
1 |
|||||||
|
4 |
0.581* |
0.603* |
0.709* |
1 |
||||||
|
5 |
0.156* |
0.298* |
0.253* |
0.186* |
1 |
|||||
|
6 |
0.599* |
0.696* |
0.752* |
0.589* |
0.240* |
1 |
||||
|
7 |
0.599* |
0.696* |
0.752* |
0.589* |
0.240* |
0.000* |
1 |
|||
|
8 |
0.242* |
0.335* |
0.340* |
0.307* |
0.145* |
0.333* |
0.333* |
1 |
||
|
9 |
0.478* |
0.424* |
0.539* |
0.393* |
0.177* |
0.455* |
0.455* |
0.199* |
1 |
|
|
10 |
0.591* |
0.597* |
0.696* |
0.509* |
0.234* |
0.789* |
0.789* |
0.264* |
0.889* |
1 |
Note: *= Significant at 5%, ns= not significant, 1= Chlorophyll content, 2= Plant height, 3= Number of leaves, 4= Number of pods per plant, 5= Number of branches per plant, 6= Above ground biomass yield, 7= Total biomass yield, 8= Harvest index, 9= 100-seed weight, 10= Seed yield
|
Genotype |
Mean |
Sensitivity |
Static |
Mean square |
|
TGx 1989-53FN |
1493 |
0.7377 |
62849 |
909 |
|
TGx 1989-45F |
1631 |
0.7381 |
64383 |
3846 |
|
TGx 1989-75FN |
1571 |
0.8235 |
79986 |
12118 |
|
TGx 1990-114FN |
1539 |
0.8239 |
83799 |
4325 |
|
TGx 1990-110FN |
1594 |
0.8509 |
91675 |
17353 |
|
TGx 1485-ID(CK) |
1570 |
0.8553 |
98997 |
32982 |
|
TGx 1993-4FN |
1564 |
0.9010 |
100316 |
19412 |
|
TGx 1989-68FN |
1537 |
0.9180 |
100367 |
7392 |
|
TGx 1990-78F |
1488 |
0.9270 |
102786 |
973 |
|
TGx 1989-42F |
1568 |
0.9485 |
104917 |
3565 |
|
TGx 1987-62F(CK) |
1585 |
0.9533 |
105135 |
1887 |
|
TGx 1835-10E(CK) |
1567 |
0.9676 |
118586 |
22522 |
|
TGx 1990-95F |
1607 |
0.9848 |
118601 |
61738 |
|
TGx 1989-40F |
1577 |
1.0000 |
124557 |
4196 |
|
TGx 1990-40F |
1592 |
1.0414 |
136271 |
426 |
|
TGx 1989-11F |
1579 |
1.0881 |
139353 |
18149 |
|
TGx1987-10F(CK) |
1566 |
1.0900 |
142051 |
125 |
|
TGx 1990-52F |
1587 |
1.0970 |
144824 |
2772 |
|
TGx 1448-2E(CK) |
1596 |
1.1146 |
146514 |
8178 |
|
TGx 1990-55F |
1632 |
1.1271 |
149189 |
7093 |
|
Grand mean |
1570 |
The genotype and environment interaction clearly plays a significant role in breeding adaptable genotypes to the wide environment. This interaction was validated by the highly significant difference for seed yield. These results relate the findings of Gebeyehu and Assefa [9] who reported that selections based on the highest yielding genotypes appeared less stable than the average of all genotypes. Furthermore, Gebeyehu and Assefa [9] stated that selection solely for seed yield could result in rejection of several stable genotypes. TGx 1989-45F and TGx 1990-110FN out yielded others because of its yield components such as plant height, number of leaves, number of pods per plant and some other growth traits that have contributed to the high yield. In contrast, Arslanglu and Aytac [10] reported contrary finding on the effect of genotype, environment and genotype by environment interaction on soybean pod number per plant, whereby plant height, seed yield and one hundred-seed weight were found to be significant at (P = 0.01). From the findings of this study, it was evident that total biomass yield and seed yield declined in the same trend. The mean performance analysis revealed that high yielding genotypes across the environments over the two years were TGx 1989-45F, TGX 1990-110FN and TGx 1989-53FN. Thus, the outstanding performance by TGx 1989-45F in terms of yield and yield related traits made it the best performer across the three environments over two years. These conform to [11] explanation for soybean performance that yield variation across environments and years was associated with changes in number of seeds per unit area. A contrary explanation is that an ideal soybean cultivar is one that achieves the greatest yield across many environments [12]. The exhibited non-significance by these traits, number of branches per plant, number of pods per plant and one hundred-seed weight was confirmed by Baker [13] who defined the non-significant difference as failure of genotypes to achieve the same relative performance in different environment. Thus, the genotype by environment interaction might have made it difficult for breeders to identify the best genotypes, during selection and recommendation. The positive and significant correlation estimated between seed yield and other traits agreed with the findings of Malik, et al., [14]. This implies that selections aimed at increasing seed yield would invariably select for higher plant height, higher leaf number and earliness to flower and as against one hundred-seed weight, number of branches per plant and number of pod per plant. This finding was in agreement with Karasu, et al., [15], who revealed that crop yield variations are strongly influenced by growth and yield parameters. Th positive correlation reported agrees with Maesri, et al., [16], whereas, Rajanna, et al., [17], were of the view that one hundred-seed weight had negative association with seed yield. The positive correlation of number of pods per plant with seed yield obtained conformed to Karasu, et al., [15], study in Turkey. But Haliloglu, et al., [18], reported a contradictory result that the number of pods per plant indicated a positive association with seed yield. On the other hand, the positive correlation estimated between number of branches per plant and seed yield, total biomass yield, number of pods per plant agrees with Malik, et al., [14]. Thus the correlation estimation in this study clearly defines the contribution of various other traits such as plant height, number of leaves, branches per plant and total biomass yield to seed yield through path analysis. The highest and the lowest seed yields level attained by the genotypes were mostly due to plant height, number of leaves, number of branches per plant and number of pods per plant. In this study, it could be cited that the correlation coefficient of the genotypes across the environments in two years indicated that plant height had significant correlation with seed yield. This finding conformed to the report of Rajanna, et al., [17]. Although number of branches per plant correlated non-significantly with other traits, positive trend was recorded. The chlorophyll content was significantly associated with seed yield. This indicated that with the greenish nature of the leaves more efficient utilization of solar radiation could be achieved. The finding was in agreement with [19] who explained that the higher the chlorophyll content, the more improved the yield due to increased intercepted solar radiation and enhanced carbon exchange rate. The little variability recorded among genotypes was due to their response to climate changes in the three environments. This agrees with [20] findings that environment played major role in phenotypic expressions of agronomic traits. To overcome genotype by environment effect, [21] partitioned genotype by environment interaction into two; adaptability and phenotypic stability. These researchers defined adaptability as the capability that a genotype has to make use of the environmental effects that warrants a high yield level and phenotypic stability was related to yield maintenance or yield predictability in diverse environment. However, in the present study, genotype by environment was not partitioned. Phenotypically, all the studied genotypes followed similar trend of performance over two years. The non-significant differences posed by genotype by environment were confirmed by [22] who reported that traits do influence performance and seed yield. The yield variations explained by environments indicates that the environments were diverse, with large differences between environmental means contributing most of the variations in yield. According to [23], an ideal cultivar would have both a high average performance over a wide range of environments plus stability. Although genotypic main effect was highly significant this shows difference in genotypic performance across environments resulting in genotype by environment interaction. The existence of genotype by environment interaction raised the need to identify stable and high yielding genotypes.
CONCLUSION AND RECOMMENDATIONS
REFERENCES
- Laswai HS, Mpagalile JJ, Silayo VK, Ballegu WR (2005) Use of soybeans in food formulation in Tanzania. In: Myaka FA, Kirenga G, Malema B (eds.). 2006. Proceedings of the First National Soybean Stakeholders Workshop, Morogoro, Tanzania. Pg no: 52-59.
- Wilcox JR, Shibles RM (2001) Interrelationships among seed quality attributes in Soybean. Crop Sciences 41: 11-14.
- Asrat A, Fistum A, Fekadu G, Mulugeta A (2009) AMMI and SREG GGE biplot analysis for matching varieties onto soybean production environment in Ethiopia. Journal of Scientific Research and Essay, 4: 1322-1330.
- Jinze X (2010) Tanzania soybean development strategy (TSDS) 2010 to 2020.
- Bellaloui N, Hanks JE, Fisher DK, Mengistu A (2009) Soybean seed composition is influenced by within-field variability in soil nutrients. Crop Management 8.
- Coskan A, Dogan K (2011) Symbiotic Nitrogen Fixation in Soybean. Soybean Physiology and Biochemistry 1-18.
- Afolayan SO, Braimoh AK (1991) Effect of tillage operation on the yield of okra. National Horticultural Research Institute, Ibadan,
- SAS (Statistical Analytical Software) (2003) Version 9.1. SAS Institute Inc., North Carolina.
- Gebeyehu S, Assefa H (2003) Genotype × environment interaction and stability analysis of seed in bean genotypes. Africa Crop Science Journal 11: 1-7.
- Arslanoglu F, Aytac S (2010) Determination of stability and genotype × environment interactions of some agronomic properties in the different soybean cultivars. Bulgarian Journal of Agricultural Sciences 16: 181-195.
- Egli DB (1998) Seed biology and the yield of grain crops. CAB International, Pg no: 232.
- Fasoula VA, Fasoula DA (2002) Principles underlying genetic improvement for high yield and stable crop yield potential. Field Crops Research, 75: 191-209.
- Baker RJ (1988) Tests for crossover genotype x environment interactions. Canadian Journal of Plant Science 68: 405-410.
- Malik MFA, Qureshi AS, Ashraf M, Ghafoor A (2006) Genetic variability of the main yield related characters in soybean. International Journal of Agriculture and Biology 8: 815-819.
- Oz M, Karasu A, Goksoy TA, Turan ZM (2009). Interrelationships of agronomical characteristics in soybean (Glycine max) grown in different environments. International Journal of Agriculture and Biology 11: 85-88.
- Maestri DM, Labuckas DO, Guzman CA, Giorda LM (1998) Correlation between seed size, protein and oil contents, and fatty acid composition in soybean genotypes. Grasas Aceites 49: 450-453.
- Rajanna MP, Viswanatha SR, Kulkarni RS, Ramesh S (2000) Correlation and path analysis in soybean. Crop Research Hisar 20: 244-247.
- Haliloglu H, Beyyavas V, Cevheri CI, Boydak E, Yilmaz A (2007) Genetic variability of the main yield related characters in soybean. International Journal of Agriculture and biology 8: 815-819.
- Kumudini S, Hume D J, Chu G (2001) Genetic improvements in short season soybean dry matter accumulation, partitioning and leaf area duration. Crop Science 41: 391-398.
- Kang M (2002) Quantitative genetics, genomics and plant breeding, CABI, USA.
- Cucolotto M, Valeria CP, Deoclecio DG, Nelson SF, Deonisio D, et al. (2007) Genotype x environment interaction in soybean: Evaluation through three methodologies. Crop Breeding and Applied Biotechnology 7: 270-277.
- Faisal GA (1986) Influence of sowing and harvesting, timing, seed position and storage on the quality of soybean. Thesis submitted to University of Khartoum in partial fulfilment of requirement for the degree of M. Sc. (agriculture). University of Khartoum, Al Khurtum, Sudan.
- Kang MS (2002) Genotype-Environment interaction: Progress and prospects. CAB International, Wallingford, UK.
Citation: Tolorunse KD, Gana AS, Sangodele EA, Ngwu CH (2019) Performance of Soybean Genotypes under Rhizobia Inoculation across Three Agro Ecologies of Nigeria. J Plant Sci Curr Res 3: 008
Copyright: © 2019 Tolorunse KD, et al. This is an open-access article distributed under the terms of the Creative Commons Attribution License, which permits unrestricted use, distribution, and reproduction in any medium, provided the original author and source are credited.