Perfusion Index Trajectory Analysis: Predictive Ability for Short-Term Complications in Preterm Newborns
*Corresponding Author(s):
Julián Alfredo Fernández-NiñoDepartamento De Salud Publica, Universidad Del Norte, Barranquilla, Atlántico, Colombia
Tel:+57 3222710145,
Email:aninoj@uninorte.edu.co
Abstract
The aim of this study was to determine the predictability of clinical complications by analyzing the perfusion index historical behavior patterns with polynomial group-based trajectory model. A longitudinal analysis was performed in 80 preterm newborns (gestational age 24 to 36 weeks) in a neonatal intensive care unit. The perfusion index was measured continuously at the pre-ductal level in the upper right limb, using the Masimo Radical-7 pulse oximeter during the first 72 hours of life. Measurements were made every two seconds, but for analysis purposes, these data were smoothed using the perfusion index mean per minute and the monitoring time was divided into 6-hour periods. Logistic regression models were used to assess the perfusion index ability to predict a complication in each of the 6-hour periods. Additionally, polynomial group-based trajectory model was conducted to determine behavior patterns and to explore their association with each clinical complication that occurred during the first seven days of life. We found the perfusion index significantly reduced the likelihood of necrotizing enterocolitis at the 42-48 (OR = 0.16; CI95% 0.04-0.68) and 48-54 (OR = 0.17; CI95% 0.04-0.72) hours periods after birth. The trajectory analysis identified two trajectory profiles, so that membership to the trajectory 1profile was significantly associated with the presence of a clinical complication (OR = 8.85; IC95% 1.03-76.51). The use of a trajectory analysis with standardized individual trends of the perfusion index historical behavior allowed the identification of patterns that predict clinical complications in preterm infants.
Keywords
Arterial Inflow; Interquartile range; Neonatal intensive care unit; Photoplethysmogram
Introduction
Newborns, particularly preterm infants, have a number of characteristics that make them more vulnerable to certain situations of clinical instability. One of them, and perhaps the most critical, is circulatory deterioration. The physiological responses to such events differ from those of other population groups, making them more vulnerable to tissue hypoxia and organ failure. This makes it imperative for early recognition and therapeutic intervention in situations that compromise cardiovascular function.
One of the measures that can be used to evaluate and monitor the hemodynamic status of a newborn is the perfusion Index (PI), which is a relative, indirect and non-invasive measure of the strength of the peripheral perfusion. The PI is the ratio between the pulsatile component during Arterial Inflow (AC) and the non-Pulsatile Component (DC) of the Photoplethysmogram (PPG) signal, which are both derived from the amount of absorbed infrared light (940-nm)emitted by a pulse oximeter [1,2]. Additionally, the PPG waveform can also be used to assess the microcirculation of neonates. The technological progress of pulse oximeters has enabled a reliable and safe monitoring of the PI for clinical analysis of blood flow. Furthermore, the literature has recently been focused on understanding the relationship between this new clinical monitoring tool and the complex neonatal cardiovascular physiology, as described in a 2014 review [1].
Thus, PI shows the relationship between heart function and peripheral vascular resistance, thereby assessing the pulsating force at a specific monitoring site (e.g. hand, finger or toe). PI depends mainly on the amount of blood at the site where it is measured, so it becomes an indirect, non-invasive measurement of the peripheral perfusion. In summary, it is a relative assessment of the strength of the arterial pulse at the monitoring site, which quantifies its amplitude and yields clinically useful information about the peripheral perfusion status.
A low PI represents less flow at the sensor site, which may be attributed to local compression, peripheral vasoconstriction, hypovolemia, or reduced cardiac function; where as a high PI suggests vasodilation. The PI varies according to the monitoring area and the physiological and pathological conditions the patient has. For instance, situations such as vasoconstriction, vasodilatation and temperature variation at the monitoring site, administration of vasoactive drugs, tone of the sympathetic nervous system (pain, anxiety), changes in stroke volume, compression of the extremities, and positional changes (prone/supine) [3-5], affect its value. Similarly, other studies have reported that circadian rhythm, feedings, intravenous treatments and jaundice may also affect the reported value of PI in hemodynamically stable preterm newborns during the first week of life [6,7]. Additionally, various authors have shown that PI may change with racial and regional factors.
It has been also reported that PI values appear to reach equilibrium on the fifth day of life. This might be attributable to postnatal maturation of the sympathetic nervous system, which plays a key role in the regulation of the peripheral perfusion in premature newborns. This way, the established PI median for preterm newborns in the first week of life is highly variable, ranging from 0.7% to 1.35%, with values between 0.29% and 2% depending on postnatal age and clinical stability of the patient [6,8-11]. To date, it is not possible to determine with certainty a reference value that serves as a cutoff point between healthy and sick newborns.
The divergence in reported values and the multiple conditions that may affect their measurement have limited the full use of such a valuable tool as PI in daily clinical practice, although the best recommendation is to individualize the results and to rely on the data trend, not on isolated measurements [1]. Some studies have shown associations between variations in the PI and some clinical alterations, such as ductus arteriosus with hemodynamic significance, intracranial hemorrhage, sepsis, Necrotizing Enterocolitis (NEC), cardiorespiratory arrest, ventilatory support and death [12-20]. However, little has been extrapolated to clinical neonatal care. In most studies, the predictive ability of the PI has been studied considering its absolute values at a single point in time or its mean over different periods of time. However, it has not been studied whether the full trajectory of PI predicts short-term clinical complications.
Early warning scoring systems are physiologic scoring systems for bedside patient assessment. Early detection of changes in a patient’s vital signs can make a life-saving difference because it leads to early intervention, thereby helping to prevent critical events before they occur. Early indicators of serious illness may not be recognized or acted upon, leading to rapid subsequent clinical deterioration with important implications for critical care, morbidity, and mortality. Automatically acquiring and analyzing vital signs, in which observations are compared to a “normal” range, can help to identify early patient deterioration, often hours before an adverse event, which makes the PI trend more important than an isolated PI value because it can reveal subtle changes in perfusion that are not as evident in variables from static screens. Moreover, these changes provide immediate feedback in real time about the perfusion state and the effectiveness of therapeutic interventions, thereby guiding clinical management.
The objective of the present study was to determine if certain patterns of historical PI behavior predict the occurrence of clinical alterations or morbidity in preterm infants cared for in intensive care units. To achieve this goal, we first describe graphically the behavior of individual PI trajectories, subsequently exploring the association between changes in PI standard deviations in various periods and the occurrence of clinical complications. Finally, we identify complete trajectory groups as predictors of these same morbidities.
Methods
Study population
A longitudinal and prospective study was conducted in the neonatal Intensive Care Unit (ICU) of Medicina Alta Complejidad (MACSA) of the Niño Jesús Hospital in Barranquilla, Colombia. Newborns with a gestational age of 24-36 weeks; who were admitted between September 2016 to October 2017; and whose PI monitoring, gestational age determination and complications occurrence vigilance started within the first six hours after birth were included. Newborns with confirmed or probable congenital heart disease, major dysmorphic syndromes or malformations without favorable prognosis of life, and those with monitoring interruptions of more than six continuous hours were excluded.
Variables
The PI was measured continuously at the pre-ductal level in the right upper limb, using the pulse oximeter Masimo Radical-7® (Irvine, California USA) during the first 72 hours of life. The device measured the PI every two seconds over the monitoring period and automatically recorded it in a database for later use. The monitoring period (72 hours) was divided into six-hour segments, giving 12 periods in total. For analysis purposes, the data were smoothed using the PI’s mean per minute.
Gestational age was determined using the Ballard score at the time of admission to the neonatal ICU. Gender and initial diagnosis of complications during the first seven days of life were also evaluated. They included hemodynamically significant patent ductus arteriosus; sepsis; requirement for ventilatory support; cardiac arrest; NEC; and death.
Medical personnel of the neonatal ICU were responsible for the patients’ recruitment and for the measurement of all variables of interest after being informed about the study protocol (inclusion and exclusion criteria, data collection and register procedures) and criteria standardization. Nurses were also informed about the study protocol and were given instructions to ensure continuous PI monitoring during patient care. These instructions comprised: to not change the place of the pulse oximeter; in case of interruption of the PI measurement because of some routine procedure (weight measurement or sampling, venous access placement, among others), to ensure the interruption did not last longer than one hour; to prevent that situations such as positional changes or crying of the newborn interrupted the PI measurement for more than one hour; and to avoid blood pressure measurement and venous accesses in the upper right limb, where the pulse oximeter was placed. A written record was made if any of the previously listed issues were necessary due to medical needs and also of every complication that might have developed during the ICU stay and the given management.
Statistical Analysis
A descriptive analysis was performed in which the quantitative variables were summarized with central tendency (mean and median) and dispersion (standard deviation and interquartile range) measures, while categorical variables were described using proportions and 95% Confidence Intervals (CI95%). Additionally, we used graphical methods to assess the PI trend throughout the monitoring period and to compare participant-specific historical means to the global mean. Trends were also explored using spaghetti plots for each panel (individuals). For the bivariate analysis, non-parametric tests were used because the PI did not display a normal distribution (Shapiro-Wilk test p>0.10). Spearman's correlation and the Mann-Whitney U test were used to explore the association of the median PI of the complete monitoring period of each patient with the gestational age, as well as with each categorical variable previously described (gender and complications), respectively.
Analyses were conducted to assess the predictive ability of the PI at the different six-hour periods. In each of the 12 monitoring periods, the PI was summarized with its mean for all individuals. Then, the PI mean of each period was standardized using the individual-specific mean and Standard Deviation (SD) in order to consider the change with respect to the own historical mean of each patient in a standardized way. Thus, 12 measurements were obtained per patient, which corresponded to the Z score of the PI in each six-hour period. Subsequently, logistic regression models were constructed for each period, in which the response variable was each of the complications evaluated (yes vs. no). The main independent variable was the specific Z score of the period and the adjustment covariates to evaluate the PI’s ability to predict clinical outcomes in each period were gender and gestational age.
Additionally, all models were adjusted for the PI means of the three previous periods (lags 1, 2 and 3), i.e., for each subject, the analyzed PI mean of each period was adjusted for the PI mean values of the three preceding periods, thereby constituting a third order self-regressive structure. The aim of this analysis was to be able to identify the period in which the PI mean showed the best ability to predict the clinical outcomes.
Furthermore, a dichotomous variable of a composite outcome was constructed, so that it was 1 in newborns who had at least one of the evaluated complications and 0 in those who had no complications. This way, a model was constructed for each six-hour period, in which the response variable was the composite outcome and the predictors were the PI Z-score, gender and gestational age.
Also, a polynomial group-based trajectory analysis (polynomial group-based trajectory model) [21] was conducted. These models facilitate classifying subjects into trajectory profiles by considering a specific sub-model for each group of different polynomial order. These models not only allow using polynomial models, but also having different distributions of the response variable. The model assumed a normal censored distribution of the PI with a maximum value of 10 and allowed multiple polynomial orders for each group. We identified two trajectory profiles: one of quadratic order and other of cubic order. The order of each submodel was selected starting with sixth-order models and consecutively reducing it, verifying the maintenance of the explanatory capacity through the Akaike (AIC) and Bayesian Information (BIC) criteria. The polynomial predictors’ coefficients for each order by group and the probability of assignment to each group by subject were obtained, being assigned to those with a higher probability. The classification ability of the model with the identified profiles was ascertained by comparing the predicted probabilities of membership to each group, which had a high discriminative capacity. Finally, a distal outcome model was constructed in an equations system simultaneous with the trajectory model, in which the main predictive variable was the group membership (identified in the trajectory analysis); the final response was the development of a complication and the adjustment covariate was the gestational age. This allowed estimating the adjusted Odds Ratio (aOR) of presenting any complication.
The goodness of fit (χ2 of Pearson) and the appropriate specification of all models were evaluated and all analyses were performed using Stata 15 (StataCorp, College Station, Texas, USA) and used a significance level of 0.05. For the trajectory analysis, the “traj” program designed by Bobby L. Jones for Stata was used [22].
Ethics Statement
The protocol of this research was submitted and approved by the Ethics Committee of the Health Division of the Universidad del Norte. The medical care of the enrolled patients was not altered. Routine clinical management for premature newborns includes continuous monitoring and recording of biological variables such as oxygen saturation, heart rate and PI, among others. Therefore, the committee that reviewed the protocol did not consider necessary to obtain informed consent. The PI data were extracted from the equipment used to measure it and analyzed without subject identification.
Results
During the study period, 86 infants were recruited, of which 80 (93.02%) conformed the analytical sample, since they had complete information for all the variables of interest. Out of all the participants, 55% were female. The PI global mean was 1.04 (SD= 0.59) and the gestational age mean was 32.45 (SD= 2.92). Figure 1 depicts the PI behavior of the included newborns.
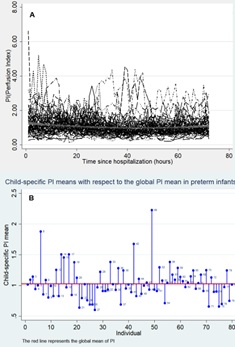 Figure 1: Patients’ perfusion index behavior.
(A) Perfusion index trajectory during the study period. (B) Specific perfusion index average of each preterm infant with respect to the index global average.
The most frequent complications in the first seven days of life were the requirement of ventilatory support (46.25%; CI95%: 35.45%-57.42%), sepsis (27.50%; CI95%: 18.68%-38.51%) and patent ductus arteriosus (17.50%; CI95%: 10.53%-27.66%). NEC (13.75%; CI95%: 7.68%-23.40%), death (7.50%; CI95%: 3.35%-15.95%) and cardiac arrest (6.25%; CI95%: 2.58%-14.39%) were less frequent.
Upon evaluating the PI and complications according to gender and gestational age (Table 1), it was seen that the PI median of the girls as well as its variability were slightly larger (median= 0.94; IQR= 0.71-1.30) than those of boys (median= 0.90; IQR= 0.67-1.20). When stratifying into older and younger than 28 weeks, it was found that the median was similar for both groups (0.92; IQR= 0.69-1.20 vs. 0.91; IQR=0.60-1.30, respectively), although there was greater variability throughout the complete monitoring period in infants with less than 28 weeks. Additionally, the bivariate analysis only showed a marginal association between the PI and the presence of sepsis (p = 0.08).
|
Male n = 36 % (CI95%) |
Female n = 44 % (CI95%) |
< 28 weeks n = 7 % (CI95%) |
≥ 28 weeks n = 73 % (CI95%) |
|
|
PI during monitoring1, 2 |
0.90 (0.67-1.20) |
0.94 (0.71-1.30) |
0.91 (0.60-1.30) |
0.92 (0.69-1.20) |
|
PI by hour2 |
||||
|
0-24 |
0.95 (0.67-1.30) |
1.10 (0.84-1.40) |
1.20 (0.92-1.70) |
1.00 (0.75-1.40) |
|
24-48 |
0.83 (0.65-1.10) |
0.85 (0.63-1.20) |
0.73 (0.46-1.10) |
0.85 (0.65-1.10) |
|
48-72 |
0.91 (0.70-1.10) |
0.89 (0.68-1.20) |
0.80 (0.56-1.10) |
0.91 (0.70-1.20) |
|
Ductus (%) |
19.44 (9.21-36.49) |
15.91 (7.54-30.49) |
71.43 (21.50-95.80) |
12.33 (6.44-22.32) |
|
Sepsis (%) |
30.56 (17.28-48.10) |
25 (14.08-40.41) |
42.86 (9.06-84.95) |
26.03 (17.08-37.54) |
|
Ventilatory support (%) |
58.33 (41.11-73.74) |
36.36 (23.17-51.99) |
85.71 (25.67-99.05) |
42.47 (31.45-54.28) |
|
Stop (%) |
8.33 (2.56-23.93) |
4.55 (1.08-17.25) |
42.86 (9.06-84.95) |
2.74 (0.66-10.62) |
|
ECN (%) |
22.22 (11.12-39.48) |
6.82 (2.11-19.86) |
14.29 (0.95-74.33) |
13.70 (7.42-23.92) |
|
Death Death (%) |
11.11 (4.03-27.14) |
4.55 (1.08-17.25) |
42.86 (9.06-84.95) |
4.11 (1.30-12.28) |
Table 1: Descriptive analysis of perfusion index and complications according to sex and gestational age.
1The summary measure of the perfusion index is shown throughout the study period (72 hours).
2Median and Interquartile Range (IQR) are presented.
In the multivariable analysis, it was found that the PI was associated with a statistically significant reduction of the aOR of NEC in the 42-48 and 48-54 hour periods. Thus, for each increase in the SD of PI, the aOR of presenting NEC declined by84% (aOR = 0.16; CI95% 0.04-0.68) and 83% (aOR = 0.17; CI95% 0.04-0.72) in the 42-48 and 48-54 hour periods, respectively. Moreover, each SD increase in the PI was significantly associated with an 83% increase in the aOR of requiring ventilatory support (aOR = 1.83%; CI95% 1.02-3.27) in the 18-24 hour period after birth (Figure 2).
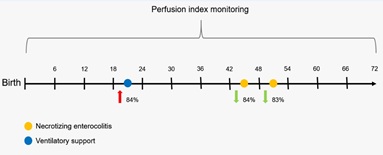 Figure 2: Percentage change of presenting specific complications.
The estimates represent the percentage change in the adjusted odds ratio (aOR) of presenting specific complications as a result of a 1 SD increase in the perfusion index for each subject.
Table 2 shows the model results for each complication and figure 3 shows the trends of point estimates and of CI 95% at the time of the most frequent complications.
|
Ductus aOR (CI95%) |
Sepsis aOR (CI95%) |
Ventilatory support aOR (CI95%) |
Cardiac arrest aOR (CI95%) |
ECN aOR (CI95%) |
Death aOR (CI95%) |
||
|
Z score of PI in each 6-hour period |
|||||||
|
0-6 |
0.58 (0.27-1.26) |
1.07 (0.65-1.77) |
0.95 (0.58-1.56) |
1.11 (0.20-6.33) |
0.91 (0.47-1.74) |
0.92 (0.26-3.19) |
|
|
6-12a |
0.95 (0.46-1.95) |
1.20 (0.74-1.94) |
1.18 (0.74-1.88) |
0.74 (0.16-3.48) |
0.94 (0.50-1.76) |
0.70 (0.22-2.21) |
|
|
12-18b |
1.76 (0.74-4.17) |
0.95 (0.54-1.66) |
1.19 (0.69-2.07) |
0.55 (0.09-3.22) |
2.01 (0.90-4.47)† |
0.79 (0.23-2.70) |
|
|
18-24 |
0.87 (0.38-1.99) |
1.24 (0.72-2.14) |
1.83 (1.02-3.27)* |
2.02 (0.37-10.95) |
1.75 (0.87-3.54) |
2.30 (0.61-8.73) |
|
|
24-30b |
1.06 (0.48-2.34) |
1.57 (0.93-2.63)† |
1.19 (0.71-1.99) |
1.75 (0.18-17.43) |
1.73 (0.89-3.37) |
4.88 (0.88-27.13)† |
|
|
30-36 |
1.54 (0.67-3.54) |
1.35 (0.75-2.45) |
1.54 (0.83-2.84) |
2.09 (0.28-15.37) |
1.57 (0.69-3.59) |
3.46 (0.68-17.54) |
|
|
36-42 |
0.83 (0.35-2.00) |
0.87 (0.48-1.58) |
0.76 (0.42-1.39) |
2.26 (0.39-13.17) |
0.82 (0.38-1.78) |
1.20 (0.34-4.28) |
|
|
42-48 |
1.93 (0.78-4.81) |
0.76 (0.39-1.48) |
1.03 (0.55-1.95) |
0.19 (< 0.01-8.39) |
0.16 (0.04-0.68)* |
0.18 (0.02-1.89) |
|
|
48-54 |
1.03 (0.40-2.69) |
0.67 (0.33-1.37) |
0.59 (0.29-1.21) |
0.06 (< 0.001-11.99) |
0.17 (0.04-0.72)* |
0.12 (0.01-2.39) |
|
|
54-60 |
1.13 (0.45-2.84) |
0.60 (0.31-1.18) |
0.82 (0.45-1.50) |
0.93 (0.11-8.00) |
0.70 (0.31-1.58) |
0.89 (0.19-4.12) |
|
|
60-66 |
0.99 (0.44-2.23) |
0.97 (0.56-1.68) |
0.64 (0.36-1.14) |
0.54 (0.08-3.64) |
1.26 (0.63-2.52) |
0.39 (0.07-2.17) |
|
|
66-72b |
0.62 (0.31-1.28) |
0.82 (0.50-1.34) |
0.74 (0.45-1.21) |
1.64 (0.31-8.84) |
0.86 (0.44-1.66) |
1.06 (0.38-2.96) |
|
Table 2: Association between standard deviation (Z score) and the presence of complications evaluated over time in preterm infants of neonatal ICU in Barranquilla, 2016-2017.
Note: A model was constructed for each outcome using as predictors the standard deviation (z score) of each six-hour period and adjusting for gestational age and gender.
*α< 0.05; †α < 0.10; Periods with n = 80; a n = 78; b n = 79.
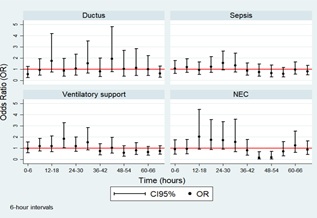 Figure 3: Adjusted odds ratios and CI95% of the most frequent complications in preterm infants.
The models for the composite outcome revealed that the aOR of presenting some complication gradually increased from the beginning of monitoring up until 30-36 hours after birth (reaching its maximum during this period); then progressively decreased. Nevertheless, statistical significance was only observed in the 18-24 hour period, so each increase of 1 SD of the PI was associated with a 93% increase in the aOR of presenting some complication (aOR = 1.93; CI95% 1.11-3.36). This trend is shown in figure 4.
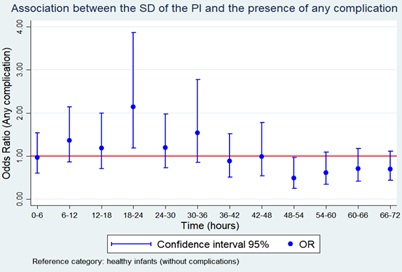 Figure 4: Adjusted odds ratios and CI95% of the composite outcome models in preterm infants.
For the trajectory analysis (Figure 5), two profiles were identified, one of quadratic order and one of cubic order. The first profile included 76.4% of newborns; and the second, 23.6%. Furthermore, the trajectories had a clearly different behavior, with the second presenting greater variability but with average oscillations towards larger values. To verify this correspondence, the simultaneous equations model yielded a statistically significant positive correlation between the membership to the profile of trajectory 1 and the presence of a complication (aOR= 8.85; CI95% 1.03-76.51). This was not seen with trajectory 2, which suggests that having a profile of the trajectory 1 increases the probability of any clinical complication. All the results from the trajectories submodels and the simultaneous equations models (correspondence analysis) are presented in table 3.
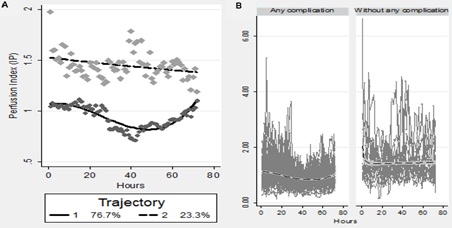 Figure 5: Trajectory analysis.
(A) Identification of two profiles: One of cubic order (trajectory 1) and one of quadratic order (trajectory 2). (B) Correspondence analysis between membership to trajectory 1 and the presence of any clinical complication
|
Group Parameter |
Estimate |
Error |
Parameter = 0 |
Prob > T |
|
Trajectory #1 |
||||
|
Intercept |
1.070 |
0.032 |
32.927 |
0.000 |
|
Linear |
0.005 |
0.004 |
1.233 |
0.218 |
|
Quadratic |
−0.001 |
0.000 |
−4.400 |
0.000 |
|
Cubic |
0.002 |
0.000 |
6.072 |
0.000 |
|
Trajectory #2 |
||||
|
Intercept |
1.500 |
0.042 |
35.604 |
0.000 |
|
Linear |
−0.003 |
0.003 |
−1.107 |
0.268 |
|
Quadratic |
0.000 |
0.000 |
0.578 |
0.563 |
|
Sigma |
0.491 |
0.005 |
106.445 |
0.000 |
|
Group membership |
||||
|
1 (%) |
76.383 |
4.746 |
16.093 |
0.000 |
|
2 (%) |
23.617 |
4.746 |
4.976 |
0.000 |
|
Outcome: logit model for any complication* |
||||
|
OR |
CI95% |
p value |
||
|
Group/Trajectory #1 |
8.85 |
1.02-76.51 |
0.05 |
|
|
Group/Trajectory #2 |
2.45 |
0.24-25.48 |
0.45 |
|
Table 3: Trajectory analysis of the perfusion index and correspondence between the identified profiles and the presence of any clinical outcome.
Estimators for each submodel identified in the trajectory analysis of the perfusion index, for identified groups and for association of group membership with final outcome are presented.
*Adjusted by gender and gestational age.
Discussion
This study was aimed at investigating the usefulness of PI when monitored continuously in preterm infants and when trends and changes are standardized and carefully evaluated. We found that each increase of the PI’s SD significantly reduced the likelihood of presenting NEC in the 42-48 and 48-54 periods after birth. Likewise, the membership to the trajectory 1 profile increased the likelihood of having any clinical complication.
The dissociation between the macro and micro circulatory compartments was defined by Ince as “a loss of hemodynamic coherence” [23] and the authors suggested that this is the rationale for monitoring the microcirculation. Peripheral tissue perfusion measured continuously using the PI could be used as triage tool in the early stages of neonatal complications in preterm newborns [24,25]. Individualized and standardized assessment as the one performed in our analyses may reduce the unnecessary use of invasive devices and vasopressors, both of which have potential side effects. Conversely, preterm newborns with PI alterations could be good candidates for early therapeutic approaches targeting microcirculation.
Risk score scales have been shown of value in clinical medicine. The potential of standardized systems of early warning scores that include PI from the moment of birth could improve the quality of data used to anticipate complications in preterm newborns. However, most existing approaches are based on cross-sectional “snapshots” at distinct times, rather than taking advantage of the longitudinal behavior of the measurement.
In contrast, trajectory analysis allows predictions that consider all the information about the combined behavior of repetitions of a response variable from a subject throughout time; in this case, the PI. These analyses differ from traditional longitudinal ones using linear generalized models with mixed effects based on the variance within and between subjects (during the whole monitoring time or in different periods) in that the analysis of the polynomial trajectory uses all the information from the full time series per subject, seeking to identify a pattern to which the patient may belong. This in turn reflects a complex physiological trajectory that does not necessarily have to be linear or monotonic, and that allows the incorporation of more information for the prediction of complications.
In the trajectory analysis used in this study, the prediction was based on more parameters than the PI’s historical mean at different points in time. The identification of a polynomial function that best describes the temporal PI behavior, by grouping the subjects with profiles, is an effective basis for predicting the patients’ clinical behavior. The identified profiles facilitated classification of the subjects into risk groups, adding more clinical parameters. This analysis could be incorporated into an artificial intelligence system that makes non-parametric predictions of clinical complications, making it a simple, but effective, means of alerting healthcare personnel about the future severity of the disease.
The interplay between clinical methods, such as clinical skills of history taking, careful physical examination and judicious selection of diagnostic tests together with numerical methods like the one presented here, with careful assessment of PI trends, could be proven to be very worthwhile. Besides, it is consistent with the ongoing trend in medicine towards evidence-based practice that emphasizes efficiency and algorithmic approaches toward diagnosis and treatment. Such approaches have a number of potential benefits including cost-saving, standardization of practice, and improvement in the quality of care [26].
Previous studies have reported an association between the state of sympathetic stimulation and a decreased PI [27-29]. We speculate that increases in sympathetic activity could be the explanation for the association between the increase of PI’s standard deviation and the decrease in the aOR for NEC.
Weaknesses and Strengths
To the best of our knowledge, there are no previous reports analyzing PI using polynomial group-based trajectory model in a similar manner to this one. Most studies have looked at a PI determination at a single point in time, except for two previous studies which looked at values during the first 24 hours and the first 72 hours of life [24,25]. For analysis, those studies used longitudinal mixed-effects modeling and linear, quadratic, and cubic models but not polynomial group-based trajectory model. Therefore, we can make no comparisons to findings by others.
All data in our study were obtained at a single center and this is a limitation. Additionally, the findings in this study were obtained with a single monitor (Masimo, Irvine, California USA) and we do not know if they can be extrapolated to other monitors, because there is great variability in measurement between oximeters. According to our findings, the Masimo device may be a promising tool for evaluation and predictability.
Tuten et. al recently showed that high lactate levels (> 4 mg/dl) and small PI (<0.5) during the first 24 hours of life could be used as early indicators for the prediction of retinopathy of prematurity and bronchopulmonary dysplasia in very low birth weight infants [30]. Lactate levels require blood samples and are determined intermittently. We believe that continuous non-invasive monitoring of PI could be more valuable. Based on our findings, we believe that the greatest value of the PI for sick premature infants is to continuously measure it and record any change.
Future research should be conducted at more than one center and focus on a larger sample size of newborns with different gestational ages and birth weights. It should also explore the value of our method of analyzing PI for other groups, such as hypertensive, anemic, infected, and postoperative neonates and evaluate whether drugs targeting microcirculation could improve the outcome for selected newborns with persistent peripheral hypoperfusion, as this could lead to less organ dysfunction and significant morbidities.
Conclusion
In conclusion, the PI can be continuously monitored non-invasively at the bedside. Trends and changes of the PI analyzed over time during the first 72 hours of life in preterm newborns with a polynomial group-based trajectory model improve predictability. However, further studies are needed to reproduce this association and thus use it systematically in neonatal intensive care units for sick infants. Hopefully, the implementation of bedside continuous perfusion assessment will be shown to improve management and outcomes in the future.
The study, statistic analysis and the results are the sole responsibility of all the authors.
Funding
This work was funded in part by Medicina Alta Complejidad S.A. (MACSA) and by Ibero American Society of Neonatology (SIBEN). No funding nor equipment were provided by Masimo Corporation.
Conflict of interest
Dr. Augusto Sola holds a part time salaried position as VP for Medical Affairs in Neonatology at Masimo Corporation, Irvine, CA.
Acknowledgment
We would like to thank Medicina Alta Complejidad SA (MACSA) for the contribution of biomedical devices and the time of its officials.
References
- Piasek CZ, Van Bel F, Sola A (2014) Perfusion index in newborn infants: A noninvasive tool for neonatal monitoring. Acta Paediatr 103: 468-473.
- Sanabria DLPI, Martelo OM, Latorre HB, Reyes JA [2017] Índice de perfusión periférica en la UCI neonatal: Una respuesta a la monitorización no invasiva del recién nacido crítico. Perinatol y Reprod Humana 31: 85-90.
- Lima AP, Beelen P, Bakker J (2002) Use of a peripheral perfusion index derived from the pulse oximetry signal as a noninvasive indicator of perfusion. Crit Care Med 30: 1210-1213.
- Hakan N, Dilli D, Zenciroglu A, Aydin M, Okumus N (2014) Reference values of perfusion indices in hemodynamically stable newborns during the early neonatal period. Eur J Pediatr 173: 597-602.
- Kroese JK, van Vonderen JJ, Narayen IC, Walther FJ, Hooper S, et al. (2016) The perfusion index of healthy term infants during transition at birth. Eur J Pediatr 175: 475-479.
- Cresi F, Pelle E, Calabrese R, Costa L, Farinasso D, et al. (2010) Perfusion index variations in clinically and hemodynamically stable preterm newborns in the first week of life. Ital J Pediatr 36: 1-5.
- Turan O, Akkoyun I, Ince DA, Doganay B, Tugcu AU, et al. (2019) Effect of breast milk and sucrose on pain and perfusion index during examination for retinopathy of prematurity. J Matern Neonatal Med 34: 1138-1142.
- Kinoshita M, Hawkes CP, Ryan CA, Dempsey EM (2013) Perfusion index in the very preterm infant. Acta Paediatr Int J Paediatr 102: 398-401.
- De Felice C, Latini G, Vacca P, Kopotic RJ (2002) The pulse oximeter perfusion index as a predictor for high illness severity in neonates. Eur J Pediatr 161: 561-562.
- Granelli ADW, Östman-Smith I (2007) Noninvasive peripheral perfusion index as a possible tool for screening for critical left heart obstruction. Acta Paediatr 96: 1455-1459.
- Hawkes GA, O’Toole JM, Kenosi M, Ryan CA, Dempsey EM (2015) Perfusion index in the preterm infant immediately after birth. Early Hum Dev 91: 463-465.
- Khositseth A, Muangyod N, Nuntnarumit P (2013) Perfusion index as a diagnostic tool for patent ductus arteriosus in preterm infants. Neonatology 104: 250-254.
- Gomez-Pomar E, Makhoul M, Westgate PM, Ibonia KT, Patwardhan A, et al. (2017) Relationship between perfusion index and patent ductus arteriosus in preterm infants. Pediatr Res 81: 775-779.
- Balla KC, John V, Rao PNS, Varghese K (2016) Perfusion index-bedside diagnosis of hemodynamically significant patent ductus arteriosus. J Trop Pediatr 62: 263-268.
- Terek D, Koroglu OA, Ulger Z, Yalaz M, Kultursay N (2016) The serial changes of perfusion index in preterm infants with patent ductus arteriosus: Is perfusion index clinically significant? Minerva Pediatr 68: 250-255.
- Vidal M, Ferragu F, Durand S, Baleine J, Batista-Novais AR, et al. (2013) Perfusion index and its dynamic changes in preterm neonates with patent ductus arteriosus. Acta Paediatr Int J Paediatr 102: 373-378.
- Navarro-Guzmán EA, Ledezma-Bautista I, Rubio-Hernández ME, Escalante-Padrón FJ, Lima-Roguel V, et al. (2019) Correlation of perfusion index with patent ductus arteriosus repercussion in premature newborns. Arch Cardiol Mex 89: 123-129.
- Ismail J, Sankar J (2019) Peripheral perfusion index - magic wand in prediction of shock? Indian J Pediatr 86: 879-880.
- Sivaprasath P, Gounder RM, Mythili B (2019) Prediction of shock by peripheral perfusion index. Indian J Pediatr 86: 903-908.
- Hariri G, Joffre J, Leblanc G, Bonsey M, Lavillegrand JR, et al. (2019) Narrative review: Clinical assessment of peripheral tissue perfusion in septic shock. Ann Intensive Care 9: 1-9.
- Peristera P, Platts LG, Hanson LLM, Westerlund H (2018) A comparison of the B-spline group-based trajectory model with the polynomial group-based trajectory model for identifying trajectories of depressive symptoms around old-age retirement. Aging Ment Heal 24: 445-452.
- Jones B, Nagin DS (2012) A stata plugin for estimating group-based trajectory models. Pg no: 1-29.
- Ince C (2015) Hemodynamic coherence and the rationale for monitoring the microcirculation. Crit Care 9: 8.
- Laere DV, O’Toole JM, Voeten M, McKiernan J, Boylan GB, et al. (2016) Decreased variability and low values of perfusion index on day one are associated with adverse outcome in extremely preterm infants. J Pediatr 178: 119-124.
- Alderliesten T, Lemmers PMA, Baerts W, Groenendaal F, Van Bel F (2016) Perfusion index in preterm infants during the first 3 days of life: Reference values and relation with clinical variables. Neonatology 107: 258-265.
- Challener DW, Prokop LJ, Abu-Saleh O (2019) The proliferation of reports on clinical scoring systems - Issues about uptake and clinical utility. JAMA 321: 2405-2406.
- Atef HM, Fattah SA, Gaffer MEA, Rahman AAA (2013) Perfusion index versus non-invasive hemodynamic parameters during insertion of i-gel, classic laryngeal mask airway and endotracheal tube. Indian J Anaesth 57: 156-162.
- Nishimura T, Nakae A, Shibata M, Mashimo T, Fujino Y (2014) Age-related and sex-related changes in perfusion index in response to noxious electrical stimulation in healthy subjects. J Pain Res 7: 91-97.
- Høiseth L, Hisdal J, Hoff IE, Hagen OA, Landsverk SA, et al. (2015) Tissue oxygen saturation and finger perfusion index in central hypovolemia: Influence of pain. Crit Care Med 43: 747-756.
- Tuten A, Dincer E, Topcuoglu S, Sancak S, Akar S, et al. (2016) Serum lactate levels and perfusion index: Are these prognostic factors on mortality and morbidity in very low-birth weight infants? J Matern Neonatal Med 30: 1092-1095.
Citation: Baquero-Latorre H, Fernández-Niño JA, Bonilla-Tinoco LJ, la Peña ID, Sola A (2021) Perfusion Index Trajectory Analysis: Predictive Ability for Short-Term Complications in Preterm Newborns. J Neonatol Clin Pediatr 8: 067.
Copyright: © 2021 Hernando Baquero-Latorre, et al. This is an open-access article distributed under the terms of the Creative Commons Attribution License, which permits unrestricted use, distribution, and reproduction in any medium, provided the original author and source are credited.