Peripheral Blood Lymphocyte Micronuclei Signify the Quality of Mesenchymal Stem Cells from Bone Marrow in Patients with Liver Cirrhosis
*Corresponding Author(s):
Smitha MathewsStem Cells And Tissue Engineering, Asian Healthcare Foundation, Hyderabad, India
Tel:+91 4023378888,
Email:zmita.mathews@gmail.com, research.aig@gmail.com
Abstract
Background: The quality of Mesenchymal Stem Cells (MSCs) is crucial in autologous transplantation for efficient in vitro expansion and clinical efficacy.
Objective: This study was performed to develop a minimally invasive method to ascertain the quality of Bone Marrow-derived MSCs (BM-MSCs) prior to bone marrow aspiration for autologous transplantation in patients with liver cirrhosis.
Methods: The genetic instability in BM-MSCs and Peripheral Blood lymphocytes (PB-lymphocytes) from cirrhotic patients were determined by enumerating the biomarkers such as Micronuclei (MNi) and Nuclear Buds (NBUDs). The quality of BM-MSCs was assessed by examining their morphology, viability, surface markers, doubling time, proliferation, senescence, and differentiation potential. We further analyzed the association of MNi count with the quality of BM-MSCs.
Results: Both BM-MSCs and PB-lymphocytes showed similar trends in the frequency of MNi. MNi count was found to influence the growth, senescence and differentiation potential of MSCs. The number of MNi was inversely proportional to the proliferation and differentiation potential of BM-MSCs.
Conclusion: As genetic instability in BM-MSCs was reflected in PB-lymphocytes, we propose that screening of PB-lymphocytes for MNi would be an effective method to predict the quality of MSCs prior to bone marrow aspiration from cirrhotic patients opting for autologous transplantation.
Keywords
INTRODUCTION
Mesenchymal Stem or Stromal Cell (MSC) transplantation is emerging as a supportive therapy for liver cirrhosis [1-3]. Bone marrow of the patient is the most common source of MSCs for autologous transplantation. Ascertaining the quality of MSCs is of paramount importance to ensure the post-transplantation safety and functional efficacy. While a recent meta-analysis, based on seven controlled clinical trials on transplantation of autologous BM-MSCs for end-stage liver cirrhosis, revealed promising results [4], the lack of comprehensive quality assessment of MSCs remains to be addressed in this regard [5-8].
Recently, it was reported that genetic instability can affect the quality of MSCs by altering their growth kinetics during ex vivo expansion [9]. Increased genetic instability, indicated by a high number of biomarkers such as Micronuclei (MNi) and Nuclear Blebs (NBs) or Nuclear Buds (NBUDs), contributed to increased senescence and decreased proliferation of MSCs. Therefore, scoring of MNi in MSCs offers an additional quality control measure in clinical transplantation.
Cirrhosis of the liver is associated with altered immune function and progressive cirrhosis can lead to Cirrhosis-Associated Immune Dysfunction (CAID) leading to systemic inflammation and bone marrow dysfunction [10]. A significant decrease in the number of hematopoietic and mesenchymal stem cells was reported in the bone marrow of patients with high (>15) Model for End-Stage Liver Disease (MELD) score [11]. However, there is no study so far correlating the progress of cirrhosis with the quality of BM-MSCs. Similarly, there is no data on the MNi status of BM-MSCs from cirrhotic patients. As genetic stability and quality of the isolated MSCs are critical for efficient upscaling of these cells, developing a screening test predicting the quality of BM-MSCs prior to BM aspiration will be distinctly advantageous in selecting cirrhotic patients for autologous MSC transplantation. Thus, the present study was conducted with the intent of developing an efficient screening method for predicting the quality of BM-MSCs prior to bone marrow aspiration. In this regard, we examined whether the quality and genetic instability of BM-MSCs are reflected in the PB-lymphocytes.
MATERIALS AND METHODS
Blood and bone marrow samples
This study was conducted with the approval of Institutional Ethics Committee (IEC) and Institutional Committee for Stem Cell Research (ICSCR) of the Asian Institute of Gastroenterology, Hyderabad, India. Patients from the Asian Institute of Gastroenterology, Hyderabad, India, diagnosed with liver cirrhosis of non-viral origin, by clinical, imaging and blood test criteria, were included in this study after obtaining their informed written consents. In group I, both bone marrow (3-5ml) and peripheral blood (3ml) samples were collected from patients (n=8) undergoing sampling for diagnostic purposes. Blood and bone marrow from healthy donors served as the control. In group II, only blood samples were collected from patients (n=15) to enumerate MNi and NBUDs in the PB-lymphocytes. The samples were collected in heparinized blood collection tubes (VACUETTE® tube, Greiner Bio-One GmbH, Austria). All the cell culture reagents were purchased from GIBCO (Life Technologies, NY, USA) and the plastic wares from Nunc (Nalge Nunc International, Roskilde, Denmark) if not mentioned otherwise.
Enumeration of micronuclei and nuclear buds in peripheral blood lymphocytes
MNi and NBUDs in peripheral blood lymphocytes were enumerated by Cytokinesis-Block Micronucleus cytome (CBMN) assay mentioned elsewhere [12]. Briefly, lymphocytes isolated from peripheral blood samples were cultured in RPMI 1460 medium supplemented with 10% FBS, 1% glutamax and 0.5% Pen/Strep. Mitotic division of lymphocytes was stimulated by adding phytohemagglutinin (PHA, 30µg/ml) to the culture medium. Cytochalasin B (4.5µg/ml, Sigma Aldrich, St. Louis, MO, USA) was added exactly after 44h of PHA stimulation to obtain cells in a binucleated state by preventing cytokinesis during cell division. After 28h of incubation, the cells were harvested, spread on glass slides, fixed and stained with Giemsa stain (HIMEDIA, Mumbai, India). The slides were mounted and screened under high magnification objective (40X) of a light microscope (Olympus, Tokyo, Japan) for binucleated cells with MNi and NBUDs. MNi and NBUDs counts of at least 1000 binucleated cells were recorded.
MSC isolation and expansion
Bone marrow samples were processed in the stem cell culture facility of Asian Healthcare Foundation, Hyderabad, India, for the MSC isolation by methods mentioned elsewhere [13]. Briefly, diluted bone marrow was layered over density gradient separation media (HisepTM, LSM 1077, HIMEDIA, Mumbai, India) and the Mononuclear Cell (MNC) fraction containing MSCs were separated by density gradient centrifugation. The cells were washed with Dulbecco’s Phosphate Buffered Saline (DPBS) and seeded into appropriate tissue culture plates/flasks in KnockOutTM DMEM (KO-DMEM) supplemented with 10% Fetal Bovine Serum (FBS, Australian origin, HIMEDIA, Mumbai, India), 1% glutamax and 0.5% Pen/Strep. The flasks were cultured at 37°C in a humidified incubator with 5% CO2. Non-adherent cells were removed after 48h and complete media changes were given on the alternate days thereafter till the flasks became 70-80% confluent. Confluent flasks were trypsinized using 0.25% trypsin-EDTA and the cells were further propagated till passage 3. All the experiments were conducted using MSCs at passage 3.
Characterization of MSCs
The MSCs isolated from bone marrow samples were characterized by standard methods for morphology, surface marker expression and differentiation potential [14]. The cells were stained with fluorescent-labeled antibodies for CD90, CD73, CD105, CD166, CD34, CD45 and HLA-DR according to the manufacturer’s instructions (BD Pharmingen, San Diego, USA) and analyzed by flow cytometry in FACS Aria II (BD Biosciences, San Jose, USA) using FACS Diva™ software (BD Biosciences, San Jose, USA) for 10000 gated events. The viability of the cells was also analyzed using flow cytometry by 7-aminoactinomycin D (7-AAD) staining.
The cells were examined for their differentiation potential to osteoblasts, adipocytes, and chondrocytes by culturing them in prescribed differentiation media (HIMEDIA, Mumbai, India) for 21 days. Differentiation to osteoblast, adipocyte, and chondrocyte lineage was confirmed by Von Kossa staining for calcium deposits, Oil Red O staining for oil droplets and Alcian blue staining for glycosaminoglycans respectively. Random images were taken from 10 different areas for evaluating the degree of differentiation.
Enumeration of the MNi and NBUDs in BM-MSCs
The MSCs were seeded onto 6-well plates with coverslips at a density of 5000 cells per cm2. Cells were grown for 96h with a media change after 48h of incubation. Following media removal, the cells were washed with DPBS and fixed with 4% paraformaldehyde. The cells were washed and stained with Giemsa stain as per the manufacturer’s instructions (HiMedia, Mumbai, India). Coverslips mounted on glass slides were screened at high power (40X objective) under a light microscope (Olympus, Tokyo, Japan). The number of MNi and NBUDs were scored for a minimum of 1000 nucleated cells. All the experiments were conducted in triplicates and the data were represented as the mean ± standard deviation (SD), MNi / NBUDs per 1000 cells [9].
Doubling time assay
Culture plates were seeded with the MSCs at a density of 5000 cells per cm2. The cells were trypsinized at specific time points and viable cell counts were determined by trypan blue exclusion method. Doubling Time (DT) was calculated by the formula, DT = t log2/ (log Nt-log N0), where, t is the time, Nt is the number of cells harvested at time t and N0 is the number of cells seeded [10].
Cell proliferation assay
Cell proliferation was determined by the method mentioned elsewhere [9], employing 3-(4, 5-dimethylthiazol-2-yl)-2, 5-diphenyl tetrazolium bromide (MTT, Sigma Aldrich, St. Louis, MO, USA) assay. Briefly, 96-well plates were seeded with an equal number of MSCs in triplicates and incubated at 37°C in a humidified incubator with 5% CO2. A complete media change was given after 48h. At the end of 96h of incubation, MTT (1mg/ml) was added to each well followed by incubation at the same culture conditions for another 3h. MTT was removed and 200µl of Dimethyl Sulfoxide (DMSO) was added to dissolve the formazan salt. The plate was placed in an ELISA plate reader (Bio-Rad, Solna, Sweden) and absorbance was measured at 595nm.
Senescence assay
The MSCs were seeded to 6-well plates at a seeding density of 5000 cells per cm2 and cultured for 96h with a media change after 48h. The plates were further processed for senescence assay using β-galactosidase staining kit (Cell Signaling Technology®, MA, USA) as per manufacturer’s instructions. Experiments were conducted in triplicates and a total of 1000 cells were counted from each plate under a phase contrast microscope (Olympus, Tokyo, Japan) and data were represented as the percentage of β-galactosidase positive senescent cells.
STATISTICAL ANALYSIS
All the experiments were conducted in triplicates and the results were expressed as the mean ± SD. The statistical analysis was done using Microsoft Excel 2016 software and involved a two-tailed, paired Student’s t-test. A p-value < 0.05 was considered significant.
RESULTS
Demographic data
Clinical characters of cirrhotic patients (with a mean age of 54 ± 11 years) in group I are summarized in Table 1. The sample in group I was coded P1 to P8 in the increasing order of their MELD score. The MELD score of patients ranged from 5-24 with a mean of 15 ± 6. The mean value of bilirubin, albumin and creatinine were 3.4 ± 3mg/dL, 3 ± 0.8g/dL and 0.9 ± 0.2 mg/dL respectively. The mean RBC, WBC and platelet counts were 3.34 ± 0.80 × 10⁶, 5189 ± 3277 and 141000 ± 130000 cells/mm3 respectively.
|
Parameters |
C |
P1 |
P2 |
P3 |
P4 |
P5 |
P6 |
P7 |
P8 |
|
|
Age (year) |
37 |
57 |
70 |
52 |
69 |
45 |
62 |
47 |
38 |
|
|
Sex (M/F) |
M |
M |
M |
M |
M |
M |
M |
M |
M |
|
|
Etiology, AL/CR |
NA |
CR |
AL |
CR |
CR |
CR |
CR |
AL |
CR |
|
|
MELD score |
NA |
5 |
7 |
13 |
13 |
15 |
15 |
21 |
24 |
|
|
CTP score, class |
NA |
6, A |
6, A |
6, A |
5, A |
8, B |
7, B |
11, C |
11, C |
|
|
Total bilirubin (mg/dL, 0.3 - 1.2) |
0.6 |
0.6 |
1 |
1.7 |
1.5 |
2.4 |
3 |
7.4 |
9.2 |
|
|
ALT (U/L, 0 - 40) |
10 |
12 |
23 |
27 |
18 |
22 |
19 |
46 |
17 |
|
|
AST (U/L, up to 40) |
12 |
39 |
22 |
46 |
32 |
28 |
36 |
75 |
90 |
|
|
Albumin (mg/dL, 3.5 - 5.2) |
4.5 |
3.3 |
3 |
3.3 |
4.2 |
3.3 |
3.7 |
1.7 |
1.9 |
|
|
I.N.R (<1.1) |
1 |
1.21 |
1.02 |
1.54 |
1.55 |
1.59 |
1.47 |
1.76 |
2.18 |
|
|
Creatinine (mg/dL, 0.7 - 1.3) |
0.6 |
1.1 |
1 |
0.7 |
0.9 |
0.7 |
0.7 |
1.1 |
1 |
|
|
Ascites |
Nil |
Nil |
Nil |
Nil |
Mild |
Moderate |
Nil |
Mild |
Moderate |
|
|
WBCs (cells/mm3, 4000 - 10000) |
6200 |
2900 |
6800 |
3400 |
5900 |
2100 |
3100 |
5400 |
12900 |
|
|
RBCs (×106 cells/mm3, 4.5 - 5.5) |
4.7 |
2.7 |
3.3 |
3.6 |
4.9 |
4.2 |
3.1 |
3 |
2.2 |
|
|
Platelets (cells/mm3, 150000 -450000) |
230000 |
150000 |
75000 |
60000 |
80000 |
70000 |
120000 |
80000 |
370000 |
|
|
MNi /1000 BN cells (Mean ± SD) |
1±0 |
29±3 |
39±5 |
5±3 |
23±3 |
5±1 |
5±2 |
2±1 |
13±3 |
|
|
NBUDs /1000 BN cells (Mean ± SD) |
0±0 |
7±1 |
14±1 |
8±3 |
10±3 |
0±0 |
4±4 |
4±0 |
3±1 |
Table 1: Clinical characteristics and the frequency of MNi and NBUDs in peripheral blood lymphocytes of the healthy control and patients (group I). The patients in group I was named P1-P8 in the increasing order of their MELD score and C indicates a healthy control. CBMN assay was used to enumerate MNi and NBUDs in the peripheral blood lymphocytes. Other test methods used include Jendrassik and Grof (total bilirubin), Kinetic IFCC (ALT and AST), Bromocresol Green Assay (albumin), clotting time with calcium thromboplastin (I.N.R), Kinetic Jafee’s method (serum creatinine), real-time screening ultrasonography of abdomen (ascites) counting using SYSMEX XT series/COULTER LH 750 series (WBCs, RBCs) and Counting chamber (platelets). M, male; F, female; AL, alcoholic cirrhosis; CR, cryptogenic cirrhosis; NA, not applicable; CTP score, Child Turgotte Pugh score; ALP, Alanine aminotransferase; AST, Aspartate aminotransferase; INR, international normalized ratio; WBC, white blood cell; RBC, red blood cell; IFCC, International Federation of Clinical Chemistry and Laboratory Medicine.
Similar trends in MNi distribution in PB-lymphocytes and BM-MSCs
Evaluation of the genetic instability in BM-MSCs and PB-lymphocytes of patients (P1-P8, group I) with liver cirrhosis revealed that the MNi and NBUDs counts of BM-MSCs were directly proportional to the MNi and NBUDs counts of their PB-lymphocytes (Figures 1A-1D). Since MNi count was more consistent when compared to NBUDs, MNi count alone was used as an indicator of genetic instability in this study. Out of eight patients, three patients showed significantly high (>15 MNi / 1000 cells) MNi count (Figure 1E) in both PB-lymphocytes and BM-MSCs.
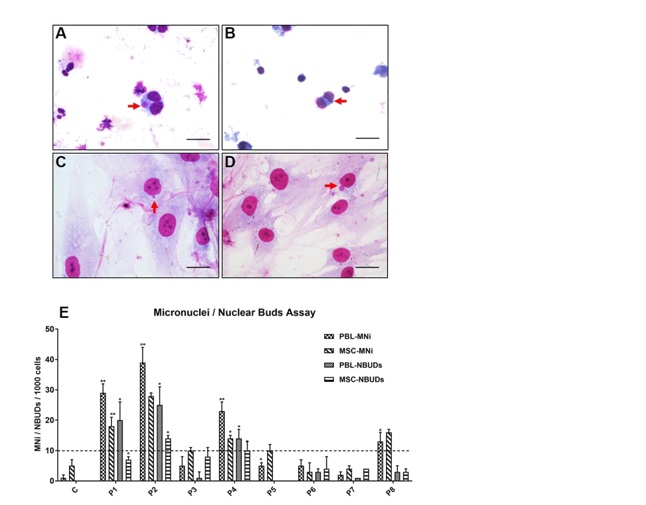 Figure 1: Micronuclei (MNi) and Nuclear buds (NBUDs) in PB-lymphocytes and BM-MSCs. Representative images showing (A) MNi and (B) NBUD in PB-lymphocytes; and (C) MNi and (D) NBUD in BM-MSCs (indicated by arrows, H&E staining, scale bar - 50 µm). (E) Distribution of MNi and NBUDs in PB-lymphocytes (PBL) and BM-MSCs obtained from a healthy control and patients with liver cirrhosis (P1 to P8). Data are represented as Mean ± SD. The dotted line indicated a low level of MNi count (
Surface markers and viability of MSCs unaffected by MNi count
The Mononuclear Cell (MNC) and MSC yield from the bone marrow samples are given in Table 2. The average time of cells in culture before the first harvest (passage 0) was 10 ± 2 days. There was a marked difference in MNC count (25.6 ± 18.3 × 10⁶ cells/ml of bone marrow) and the MSC yield (passage 0, 0.4 ± 0.3 × 10⁶ cells/ml of bone marrow) among the patients. The MSCs isolated from all the bone marrow samples showed typical spindle shaped fibroblast-like morphology characteristic for MSCs (Figure 2A). Trypan blue exclusion test and 7-AAD staining showed more than 90% of viability for BM-MSCs at all stages of culture (Figure 2B). Immunophenotyping by flow cytometry showed that MSCs isolated from all the BM samples were positive (> 90%) for MSC specific surface markers like CD90, CD73, CD105, CD166 and CD44; negative (< 2%) for hematopoietic markers like CD34 and CD45; and negative (< 2%) for HLA-DR. The surface marker profiles of the BM-MSCs from patient samples were similar to that of the control (Figures 2C,2D). BM-MSCs from all the samples demonstrated differentiation potential to osteoblast, adipocyte and chondrocyte lineages (Figure 2E).
|
Parameters |
C |
P1 |
P2 |
P3 |
P4 |
P5 |
P6 |
P7 |
P8 |
|
|
MNC / ml of BM, × 106 |
9.82 |
26.25 |
21.11 |
56.5 |
24.73 |
3.25 |
46.44 |
20.98 |
5.14 |
|
|
MSCs (Passage 0) / ml of BM, × 106 |
0.41 |
0.8 |
0.104 |
0.615 |
349 |
0.185 |
0.308 |
0.646 |
0.219 |
|
|
No. of days in culture (Passage 0) |
10 |
11 |
13 |
10 |
9 |
10 |
7 |
11 |
10 |
Table 2: MNC count and MSC yield of the bone marrow samples. The patients in group I was named P1-P8 in the increasing order of their MELD score and C indicates a healthy control. MNC: Mononuclear Cell; BM: Bone Marrow; MSC: Mesenchymal Stem Cells.
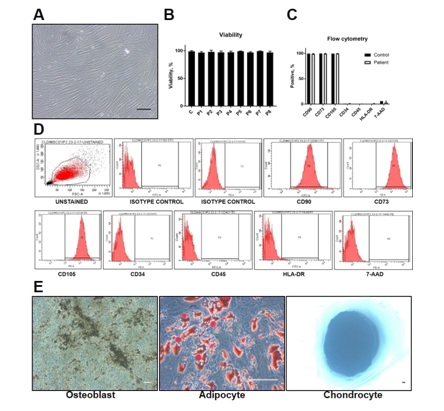 Figure 2: Characterization of BM-MSCs. (A) BM-MSCs from both healthy control and cirrhotic patients showed spindle-shaped fibroblast-like morphology (representative phase contrast image). They showed more than 90% viability at all passages (till passage 3) evidenced by (B) trypan blue exclusion test and (C) flow cytometry analysis for 7-AAD. (C) Flow cytometry analysis showed that BM-MSCs from all the samples were positive (> 90%) for CD90, CD73, CD105 and negative (< 2%) for CD34, CD45, and HLA-DR. (D) A representative histogram showing the flow cytometry data for the MSC specific marker analysis. (E) The cells were able to differentiate into osteoblast (von Kossa staining), adipocyte (Oil Red O staining), and chondrocyte lineages (Alcian blue staining). Scale bar -100µm.
MNi count influenced the growth kinetics and differentiation potential of MSCs
The MNi count of MSCs significantly affected their DT. The DT of MSCs from cirrhotic patients ranged from 25-83h (Figure 3A). Increased DT and decreased proliferation were noted in MSCs with high MNi score (Figures 3A,3B). Also, β-galactosidase staining showed a greater number of senescent cells in patients with a higher number of MNi (Figure 3C). In patients with more than 20 MNi/1000 cells, more than 15% of MSCs were senescent. Figure 3: Quality assessment of BM-MSCs. Data (Mean ± SD) obtained from a healthy control (A) and patients with liver cirrhosis (P1 to P8, group I) are depicted in terms of (B) doubling time, proliferation (MTT assay), (C) senescence, and (D) differentiation (adipocytes lineage) potential. Levels of significance with respect to control are shown in terms of p
Although MSCs isolated from all the samples could differentiate into adipocytes, osteoblasts and chondrocytes (a characteristic feature of MSCs), a significant difference was noted in the differentiation potential to adipocyte lineage (Supplementary Figure 1). When the frequency of MNi was more than 1%, the percentage of adipocyte differentiation decreased to less than 15% (Figure 3D).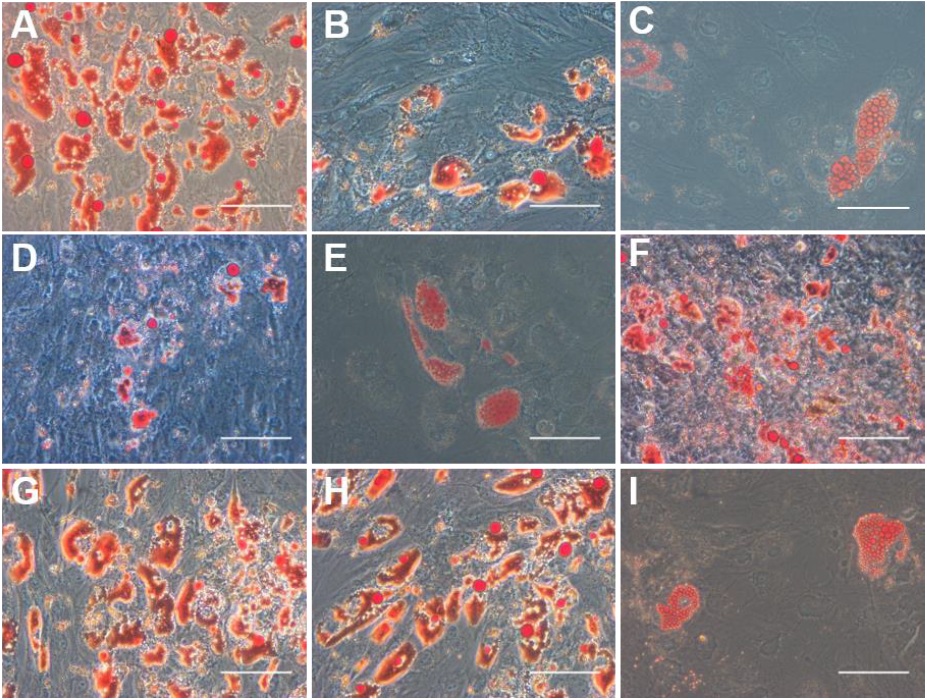 Supplementary Figure 1: Adipocyte differentiation potential of BM-MSCs from a healthy control and patients with liver cirrhosis. Representative phase contrast images of Oil Red O staining demonstrating oil droplets (stained red) containing adipocytes differentiated from BM-MSCs from (A) a healthy control; and (B) P1, (C) P2, (D) P3, (E) P4, (F) P5, (G) P6, (H) P7 and (I) P8, the patients with liver cirrhosis. Scale bar - 100μm.
The stage of cirrhosis is insufficient to assess the quality of MSCs
After establishing the association between the genetic instability and the quality of MSCs, we further examined the MNi and NBUDs distribution in the PB-lymphocytes of another 15 patients (group II, patients coded as S1-S15 in the increasing order of their MELD score), in order to understand how the progression of cirrhosis affected the quality of MSCs. The clinical characters of the group II patients are depicted in Table 3. We analyzed the MELD scores and MNi distribution in PB-lymphocytes of all the patients from group I and II (n=23, Figure 4). The MELD score varied from 5-24, indicating different stages of cirrhosis. The number of MNi varied significantly among the patients irrespective of the stage of cirrhosis (Figure 4). For example, the patient (S15) with a MELD score of 20 had lymphocytes with minimal genetic instability (1±1 MNi per 1000 binucleated cells), whereas another patient (S5) in the early stage of cirrhosis (MELD score = 11) showed a higher degree of genetic instability (23±5 MNi per 1000 binucleated cells) in their lymphocytes (Table 3). In general, most of the samples showed similar trends in MNi and NBUDs distribution. However, we could not establish any direct association between of MNi or NBUDs count with any other tested parameters (Table 1 and 3).
|
Parameters,(Unit, reference range |
S1 |
S2 |
S3 |
S4 |
S5 |
S6 |
S7 |
S8 |
S9 |
S10 |
S11 |
S12 |
S13 |
S14 |
S15 |
|
Age (year) |
39 |
67 |
37 |
30 |
54 |
63 |
46 |
30 |
52 |
41 |
49 |
55 |
54 |
33 |
52 |
|
Sex (M/F) |
M |
M |
M |
M |
M |
F |
M |
M |
M |
M |
M |
M |
M |
M |
M |
|
Etiology, AL/CR |
CR |
CR |
CR |
CR |
AL |
CR |
CR |
CR |
CR |
CR |
CR |
CR |
CR |
CR |
CR |
|
MELD score |
7 |
8 |
10 |
10 |
11 |
12 |
13 |
14 |
14 |
15 |
15 |
17 |
17 |
17 |
20 |
|
CTP score, class |
5, A |
6, A |
6, A |
7, B |
6, A |
7, B |
6, B |
8, B |
8, B |
7, B |
8, B |
7, B |
8, B |
9, B |
11, C |
|
Total bilirubin (mg/dL, 0.3 - 1.2) |
1.2 |
1.4 |
1.7 |
1.1 |
2.8 |
0.7 |
2.9 |
3.4 |
2.4 |
1.9 |
3.4 |
6.4 |
3.2 |
2.6 |
3.6 |
|
ALT (U/L, 0 - 40) |
33 |
26 |
41 |
19 |
30 |
24 |
30 |
32 |
23 |
20 |
25 |
39 |
55 |
20 |
21 |
|
AST (U/L, up to 40) |
50 |
42 |
59 |
27 |
41 |
32 |
61 |
53 |
43 |
42 |
45 |
44 |
112 |
43 |
31 |
|
Albumin (mg/dL, 3.5 - 5.2) |
4.1 |
4.5 |
3.4 |
3.5 |
3.7 |
2.6 |
3.2 |
2.9 |
3.4 |
2.6 |
3.1 |
4.2 |
3 |
2.9 |
2.2 |
|
I.N.R (<1.1) |
1.02 |
1.07 |
1.23 |
1.38 |
1.08 |
1.28 |
1.32 |
1.28 |
1.4 |
1.69 |
1.29 |
1.29 |
1.28 |
1.8 |
2.11 |
|
Creatinine (mg/dL, 0.7 - 1.3) |
0.8 |
1 |
0.8 |
0.6 |
0.8 |
1.4 |
1.2 |
0.8 |
1.1 |
0.8 |
1.1 |
1.1 |
1.4 |
0.9 |
0.8 |
|
Ascites |
Nil |
Mild |
Nil |
Mild |
Nil |
Nil |
Nil |
Nil |
Mild |
Nil |
Nil |
Nil |
Nil |
Mild |
Moderate |
|
WBCs (cells/ mm3, 4000 -10000) |
4500 |
6600 |
3500 |
1600 |
5900 |
9400 |
4300 |
5000 |
4000 |
3500 |
5000 |
7000 |
3700 |
5400 |
3500 |
|
RBCs (×106 cells/mm3, 4.5 - 5.5) |
5.9 |
4.5 |
5.1 |
4.4 |
3.9 |
4.2 |
3.8 |
3.6 |
3.2 |
3.5 |
4.5 |
5.2 |
3.7 |
3 |
3.6 |
|
Platelets (cells/mm3, 150000 - 450000) |
120000 |
60000 |
150000 |
50000 |
120000 |
150000 |
50000 |
150000 |
70000 |
150000 |
100000 |
70000 |
110000 |
120000 |
60000 |
|
MNi/1000 BN cells (mean±SD) |
2±2 |
9±4 |
11±4 |
2±2 |
23±5 |
10±0 |
12±6 |
6±6 |
18±0 |
3±3 |
11±8 |
17±6 |
3±3 |
3±2 |
1±1 |
|
NBUDs/1000 BN cells (mean±SD) |
8±7 |
11±6 |
17±8 |
7±5 |
25±9 |
23±8 |
37±13 |
6±6 |
18±6 |
5±5 |
23±6 |
23±2 |
21±4 |
8±4 |
14±3 |
Table 3: Clinical characteristics and the frequency of MNi and NBUDs in peripheral blood lymphocytes of patients at different stages of cirrhosis (group II). The patients in group II were named S1-S15 in the increasing order of their MELD score. CBMN assay was used to enumerate MNi and NBUDs in the peripheral blood lymphocytes. Other test methods used include Jendrassik and Grof (total bilirubin), Kinetic IFCC (ALT and AST), Bromocresol Green Assay (albumin), clotting time with calcium thromboplastin (I.N.R), Kinetic Jafee’s method (serum creatinine), real-time screening ultrasonography of abdomen (ascites) counting using SYSMEX XT series/COULTER LH 750 series (WBCs, RBCs) and Counting chamber (platelets). M, male; F, female; AL, alcoholic cirrhosis; CR, cryptogenic cirrhosis; NA, not applicable; CTP score, Child Turgotte Pugh score; ALP, Alanine aminotransferase; AST, Aspartate aminotransferase; INR, international normalized ratio; WBC, white blood cell; RBC, red blood cell; IFCC, International Federation of Clinical Chemistry and Laboratory Medicine.
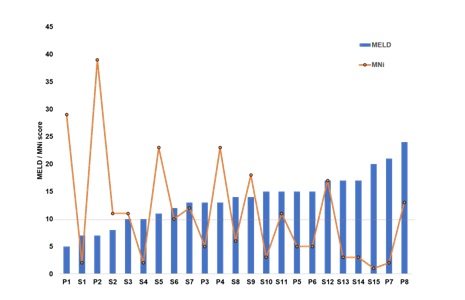 Figure 4: MNi distribution in PB-lymphocytes of the patients at different stages of cirrhosis. MNi count differed among the patients (n=23), irrespective of the stage of cirrhosis. The progress of cirrhosis is indicated by the MELD score (in the increasing order from left to right). Cirrhotic patients from both the groups (P1-P8, the group I and S1-S15, group II) were included for the analysis. The dotted line indicated a low level of MNi count (
DISCUSSION
The present study was conducted in cirrhotic patients to develop a screening method for predicting the quality of MSCs prior to bone marrow aspiration. We compared the genetic instability of BM-MSCs and PB-lymphocytes from cirrhotic patients and studied how genetic instability affected the quality of BM-MSCs. The results demonstrated that genetic instability, indicated by a high MNi count, affected the growth of BM-MSCs in vitro. MSCs with a high number of MNi had longer DT, increased senescence and reduced proliferation. Genetic instability also decreased the differentiation potential of MSCs in cirrhotic patients. Thus, genetic stability is important for obtaining good quality MSCs from BM for transplantation. Interestingly, when the MNi count was high in BM-MSCs, PB-lymphocytes also showed correspondingly high MNi count and vice versa. As PB-lymphocytes could reflect the genetic instability of BM-MSCs, we propose that scoring of MNi in the PB-lymphocytes, prior to BM aspiration, as a screening test for predicting the quality of BM-MSCs in patients with cirrhosis of the liver.
We used the CBMN assay to evaluate the MNi count in PB-lymphocytes. CBMN assay is a robust method for measuring DNA damage, cytostasis, and cytotoxicity in different mammalian cells, including lymphocytes [15]. It has been successfully used as a predictor of normal tissue, genotoxicity, radiation sensitivity and cancer risk [16-17]. Our study reveals that the CBMN assay can also be employed to predict the quality of BM-MSCs.
Most of the clinical studies using MSCs follow the minimal identification criteria for human MSC [18], defined by the International Society for Cellular Therapy (ISCT] in 2006 [19]. According to ISCT guidelines, MSCs should be (i) plastic adherent when grown in standard culture conditions, (ii) positive for surface markers such as CD105, CD73, and CD90, (iii) negative for CD34, CD45, CD14 or CD11b, CD79a or CD19 and HLA-DR; and (iv) differentiate into osteoblasts, adipocytes, and chondroblasts in vitro. In our study, all the MSCs isolated from the bone marrow samples of patients at different stages of cirrhosis showed plastic adherence, spindle-shaped fibroblast-like morphology, surface maker profile, tri-lineage differentiation potential, and more than 90% viability, depicted by the existing quality control standards, qualifying them for use in clinical transplantation. However, these MSCs differed in their in vitro MNi count, DT, proliferation, senescence and differentiation potential. Longer DT and an increase in senescence resulted in a slow proliferation of MSCs, hindering their efficient ex vivo expansion for clinical use. A high number of MNi, indicative of chromosome breakage and/or whole chromosome loss, reflected genetic instability in these cells. On the contrary, MSCs with genetic stability, indicated by a low MNi count (<10 MNi / 1000 cells), showed normal growth and differentiation potential.
Genetic integrity is crucial for MSCs which require an ex vivo expansion before clinical transplantation [20]. Genetic integrity studies in umbilical cord-derived MSCs (UC-MSCs) and placenta-derived (PD-MSCs) demonstrated that UC-MSCs had less MNi and NBUDs compared to PD-MSCs obtained from the same patient [9]. They also reported that MSCs having high MNi and NBUDs scores showed decreased proliferation, a longer S phase, G2-M arrest and increased senescence. Besides, the MNi or NBUDs status did not alter their Cluster of Differentiation (CD) surface marker profile and their ability to differentiate into osteoblasts, adipocytes, and chondrocytes. The current study corroborated the above-mentioned influence of MNi count on the in vitro proliferation of MSCs. However, our data accounts for a marked decrease in the adipocyte differentiation potential of MSCs with high MNi count in cirrhotic patients. Further studies are required to understand the cellular phenomenon behind such a drastic decrease in adipocyte differentiation potential, which is beyond the scope of the current study.
There are many known agents such as radiation, chemical mutagens, alcohol and viruses which can cause genetic damage resulting in abnormal MNi count in cells [21-24]. It is reported that patients with liver cirrhosis of viral origin had a high number of MNi in their hepatocytes [25]. High frequency of MNi was also reported in hepatocellular carcinoma [26-27] and non-alcoholic steatohepatitis [28]. When we compared the quality / MNi count of MSCs with the MELD score of the patients, we found that the quality / MNi count of MSCs varied irrespective of the MELD score. Further validation studies in a greater number of patients also could not reveal any direct association of MNi count with the stage of cirrhosis. Therefore, the stage of cirrhosis cannot be considered as the sole criteria for selecting patients for autologous BM-MSC transplantation. To the best of our knowledge, this is the first study evaluating the MNi status in BM-MSCs of patients with non-viral etiology of liver cirrhosis. However further comprehensive studies in a larger population are required to understand the factors affecting the MNi distribution in BM-MSCs.
Present findings demonstrated that there is variation in the quality of MSCs from the bone marrow of cirrhotic patients irrespective of their disease status and corroborated the association of MNi count of PB-lymphocytes with the quality of BM-MSCs. Apparently, the CBMN assay for MNi in PB-lymphocytes could be used as a cost-effective, minimally invasive and efficient screening test for pre-assessing the quality of MSCs prior to bone marrow aspiration. Such a screening test would have far-reaching applications in MSC therapy as it can be validated and used for predicting the quality of MSCs from other sources as well. As MNi status of MSCs influenced their growth kinetics and differentiation potential, MNi scoring of MSCs can be included as an additional quality control measure for MSC transplantation.
ACKNOWLEDGMENTS
This work was supported by the Asian Healthcare Foundation, Hyderabad, India. We thank Prof. C. Subramanyam for his help in preparing this manuscript.
CONFLICT OF INTEREST
The authors have no conflict of interest to report.
REFERENCES
- Zhao L, Chen S, Shi X, Cao H, Li L (2018) A pooled analysis of mesenchymal stem cell-based therapy for liver disease. Stem Cell Res Ther 9: 72.
- Eom YW, Kim G, Baik SK (2015) Mesenchymal stem cell therapy for cirrhosis: Present and future perspectives. World J Gastroenterol 21: 10253-10261.
- Volarevic V, Nurkovic J, Arsenijevic N, Stojkovic M (2014) Concise review: Therapeutic potential of mesenchymal stem cells for the treatment of acute liver failure and cirrhosis. Stem Cells 32: 2818-2823.
- Ma XR, Tang YL, Xuan M, Chang Z, Wang XY, et al. (2015) Transplantation of autologous mesenchymal stem cells for end-stage liver cirrhosis: A meta-analysis based on seven controlled trials. Gastroenterol Res Pract 2015:908275.
- Langrzyk A, Nowak WN, Stepniewski J, Ja?wa A, Florczyk-Soluch U, et al. (2018) Critical view on mesenchymal stromal cells in regenerative medicine. Antioxid Redox Signal 29: 169-190.
- Mendicino M, Bailey AM, Wonnacott K, Puri RK, Bauer SR (2014) MSC-based product characterization for clinical trials: an FDA perspective. Cell Stem Cell 14: 141-145.
- Tanavde V, Vaz C, Rao MS, Vemuri MC, Pochampally RR (2015) Research using Mesenchymal Stem/Stromal Cells: quality metric towards developing a reference material. Cytotherapy 17: 1169-1177.
- Hanley PJ, Mei Z, da Graca Cabreira-Hansen M, Klis M, Li W, et al. (2013) Manufacturing mesenchymal stromal cells for phase I clinical trials. Cytotherapy 15: 416-422.
- Sharma S, Bhonde R (2015) Influence of nuclear blebs and micronuclei status on the growth kinetics of human mesenchymal stem cells. J Cell Physiol 230: 657-666.
- Albillos A, Lario M, Álvarez-Mon M (2014) Cirrhosis-associated immune dysfunction: Distinctive features and clinical relevance. J Hepatol 61: 1385-1396.
- Bihari C, Anand L, Rooge S, Kumar D, Saxena P, et al. (2016) Bone marrow stem cells and their niche components are adversely affected in advanced cirrhosis of the liver. Hepatology 64: 1273-1288.
- Fenech M (2007) Cytokinesis-block micronucleus cytome assay. Nat Protoc 2: 1084-1104.
- Pal R, Hanwate M, Jan M, Totey S (2009) Phenotypic and functional comparison of optimum culture conditions for upscaling of bone marrow-derived mesenchymal stem cells. J Tissue Eng Regen Med 3: 163-174.
- Mathews S, Mathew SA, Gupta PK, Bhonde R, Totey S (2014) Glycosaminoglycans enhance osteoblast differentiation of bone marrow derived human mesenchymal stem cells. J Tissue Eng Regen Med 8: 143-152.
- Fenech M (2008) The micronucleus assay determination of chromosomal level DNA damage. Methods Mol Biol 410: 185-216.
- El-Zein R, Vral A, Etzel CJ (2011) Cytokinesis-blocked micronucleus assay and cancer risk assessment. Mutagenesis 26: 101-106.
- Ferlazzo ML, Bourguignon M, Foray N (2017) Functional assays for individual radiosensitivity: A Critical Review. Semin Radiat Oncol 27: 310-315.
- Squillaro T, Peluso G, Galderisi U (2016) Clinical trials with mesenchymal stem cells: An update. Cell Transplant 25: 829-848.
- Dominici M, Le Blanc K, Mueller I, Slaper-Cortenbach I, Marini F, et al. (2006) Minimal criteria for defining multipotent mesenchymal stromal cells. The International Society for Cellular Therapy position statement. Cytotherapy 8: 315-317.
- Oliveira PH, da Silva CL, Cabral JM (2014) Concise review: Genomic instability in human stem cells: current status and future challenges. Stem Cells 32: 2824-2832.
- Jones KH, York TP, Jackson-Cook C (2012) Mechanisms leading to the formation of micronuclei containing sex chromosomes differ with age. Mutat Res 747: 207-217.
- Chen Y, Williams V, Filippova M, Filippov V, Duerksen-Hughes P (2014) Viral carcinogenesis: Factors inducing DNA damage and virus integration. Cancers 6: 2155-2186.
- Bonassi S, Mili? M, Neri M (2016) Frequency of micronuclei and other biomarkers of DNA damage in populations exposed to dusts, asbestos and other fibers. A systematic review. Mutat Res 770: 106-118.
- Fenech M, Kirsch-Volders M, Natarajan AT, Surralles J, Crott JW, et al. (2011) Molecular mechanisms of micronucleus, nucleoplasmic bridge and nuclear bud formation in mammalian and human cells. Mutagenesis 26: 125-132.
- de Almeida TMB, Leitão RMC, Carrilho FJ, Sonohara S (2010) Micronuclei formation in liver fibrosis samples from patients infected by hepatitis C virus. Genet Mol Biol 33: 418-421.
- Wen CH, Lin CH, Tsao SC, Su YC, Tsai MH, et al. (2013) Micronucleus scoring in liver fine needle aspiration cytology. Cytopathology 24: 391-395.
- de Almeida TM, Leitão RC, Andrade JD, Beçak W, Carrilho FJ, et al. (2004) Detection of micronuclei formation and nuclear anomalies in regenerative nodules of human cirrhotic livers and relationship to hepatocellular carcinoma. Cancer Genet Cytogenet 150: 16-21.
- Karaman H, Karaman A, Donmez-Altuntas H, Bitgen N, Hamurcu Z, et al. (2013) Investigation of genome instability in patients with non-alcoholic steatohepatitis. World J Gastroenterol 19: 5295-5301.
Citation: Mathews S, Naqvi A, Sasikala M, Rao PN, Sharma M, et al. (2019) Peripheral Blood Lymphocyte Micronuclei Signify the Quality of Mesenchymal Stem Cells from Bone Marrow in Patients with Liver Cirrhosis. J Cytol Tissue Biol 6: 022.
Copyright: © 2019 Smitha Mathews, et al. This is an open-access article distributed under the terms of the Creative Commons Attribution License, which permits unrestricted use, distribution, and reproduction in any medium, provided the original author and source are credited.