Potential Climate Change Impacts on Imen Barley BYDV Resistant Variety Yields in Tunisia
*Corresponding Author(s):
Ghanem HField Crops Laboratory, National Institute Of Agricultural Research Of Tunisia, University Of Carthage Street Hédi Karray, 1004 El Menzah, Tunisia
Email:Hajeur_bg@yahoo.com
Abstract
Generally, Barley yields vary less under changing weather conditions than those of wheat and most other small grains. A field trials in National Institute of Agricultural Research of Tunisia (INRAT) experimental station in Kef region (Tunisia) during twelve cropping seasons (2008-2019) was conducted to study the relationships between agroclimatic indices and average yields of Imen barley BYDV resistant variety compared to the most important spring barley (Hordeum vulgare L.) varieties (Manel and Rihane). In this paper, results are used as a control to estimate potential impacts of climate change scenarios and pedological conditions on anticipated average yields and total production of these commodities in Kef region by the 2058 period. The agronomic crop model Cropsyst was used to assess the impacts of increased temperature on growth and development varieties shown below in Tunisia, and to examine possible adaptation strategies. The analysis was based on multi-year crop model simulations run with daily weather series 2020-2058 that allowed two average yield levels: grain and biomass. The impacts of 0.2 °C temperature rise obtained by weather generator ClimGen included in Cropsyst on potential yields are positive and induced an increase of 14.4 %/ha for Imen in comparison with Manel 13.7 % and Rihane 10.1 %. Based on a range of available heat units projected by multiple General Circulation Model experiments, a climate change scenario representing +1 °C temperature rise was also applied for the same period and using the same generator. With 1°C temperature rise, average yieldsachievable in field trials could decrease in long term by about 0,16 q/ha (Rihane) and 0.46 t/ha (Manel) (4.7 % and 14 %). Cropsyst yield data, however, indicate an increase of 0.5 % with +1°C temperature rise suggesting the resilience of Imen barley grain production, compared to the two varieties Manel and Rihane.
Keywords
Barley; Climate change; Temperature rise; Variety;Yields;
INTRODUCTION
According to Ray et al. [1], climate change, contributes to yield stagnation or yield declines in some major global breadbaskets. Threats to food security as a result of anthropogenic climate change include direct impacts on crop production from changes in water availability, salinisation and temperature, as well as indirect impacts from changes in disease and pest prevalence [2-4]. These threats must be tackled through a variety of approaches that include different models of economic development, altered patterns of international trade and improved targeting of agricultural investments [5]. Determining the areas where crop yields would be sensitive to the effects of climate change is essential for establishing effective and timely adaptation strategies [6]. For example, wheat yields in countries with very high yield potential such as Russia [7] would be almost 15% higher without these limiting climatic trends [8]. With its wide environmental range, different end uses and wide variety of users, barley has emerged as an excellent model for both investigating and responding to the impacts of various climate change scenarios [9]. According to Dawson et al. [10], barley (Hordeum vulgare ssp. vulgare) is an excellent model for understanding agricultural responses to climate change. Its initial domestication over 10 millennia ago and subsequent wide migration provide striking evidence of adaptation to different environments, agro-ecologies and uses. Furthermore, barley yields are generally considered to vary less under changing weather conditions than those of wheat and most other small grains [11,9]. Illustrates the annual mean of barley yields during 1984-2017 cropping seasons in Tunisia, which varies between 1.3 and 14.8 q/ha with a general average yield of around 7.5 q/ha. The yields were low and exhibited fluctuations, primarily due to volatile climate conditions. Moreover, separating the potential effects of climate change on crop yields from the effects of socioeconomic and institutional changes is challenging [12]. Statistical models, which predict yields through observed yields and historical weather data, can estimate the impacts of climate change on crop yields [13]. According to Lobell et al. [8], the way to better understand these impacts of climate change on yields and to develop effective adaptation strategies is to assess the extent to which historical and recent crop yield trends have been affected by climate trends.
Possible responses include avoidance (circumvention) of climate-related stress factors based on shifts in the cultivation of varieties adapted to planting in spring (spring types) versus autumn (winter types). A realistic danger, however, is that such a response simply hides the deeper complexities of climate adaptation. New introductions of tolerance or resistance traits may be required to facilitate shifts based on other abiotic and biotic pressures that have not been previously experienced. The interactions between climate change and other global challenges such as declining soil fertility and increasing human populations [14] complicate these already complex issues, and highlight that multiple pressures must be addressed in concert [9]. Predicted higher temperatures could affect plant productivity in several ways. They could modify the incidence of winterkill and reduce vernalization [15]. Higher potential evapotranspiration could increase crop water stress, further inhibiting yields. Temperature increases will tend to reduce the length of the growing period, potentially depressing overall biomass accumulation and yield [16,17]. Finally, warmer temperatures could modify the rates of photosynthesis and respiration, thus affecting crop growth rates [18,19].
A new barley resistant variety Imen carrying Yd2 gene was selected and released for its high yield and biomass compared to controls Manel and Rihane the most commonly grown barley varieties in Tunisia [20]. The effect of climate change is estimated by comparing barley varieties yields simulated with use of weather series representing the present climate and the changed climate. The weather series for the changed climate conditions were carried out by weather generator parameters, which were derived from the observed weather series and then modified according to the climate change scenario.
The main objective of this study is to quantify the impacts of changes in mean temperature and precipitation on barley yields from 1992 to 2018. The Cropsyst crop model is used in this study as a tool to compare counterfactual yields without climate change with observed yields and actual climate changes in Kef region that represent major barley areas of Tunisia.
MATERIALS AND METHODS
Data collection
Soil and climate data were collected from the Kef region. These data concern the minimum and maximum temperature, precipitation, wind speed, minimum and maximum relative humidity and solar radiation of 27 years (1992-2018). The soil texture and physico-chemical characteristics were taken from INRAT Kef experimental station.
Crop model
The standard econometric approach, stemming from the convergence of statistical inference and economic theory has limitations in addressing the complex relationship between agriculture and the natural environment and the economic environment [21, 22]. These limitations have led to adopt another approach more original, using production functions engineer obtained by simulations through the biophysical model "Cropsyst". This model operates at a daily time and the law of limiting factor intervenes to determine the biomass (yield) [23]. Potential biomass is daily subjected to water, salt and nitrogen stress. The biophysical model is governed by laws and equations that have not linear form. For this reason, it is used to determine the most appropriate form of barley function response considering its surrounding conditions.
The crop growth model Cropsyst version 3_04_08 is used for its ability to simulate barley yields for several consecutive years and to establish relationship between input-output for barley production. Yields and biomass and their changes over time are analyzed.
The results of extensive field experiments carried out on the chosen site were used as a control. In all experiments the same spring barley cultivar and same methodology of field trials was used. Such selection of the experimental sites enabled us to test the climate change impacts and adaptation strategies will significantly differ in individual environmental conditions.
Input data for cropsyst model
For basic crop models, we have introduced the data relating to the location, the climate of the region, soil characteristic and the physiological parameters of each barley variety as well as the description of the rotation system and fertilizers applied. These data are necessary to make the following modules (Figure 1) interact with each other.
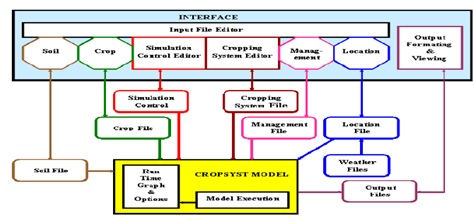 Figure 1: Cropsyst modules.
Source: Stockle and Nelson [24].
Location module
This contains information relating to altitude, latitude, stiffness and slope length specifying the Kef region.
Climate file
Climate data collected from the meteorological station in Kef region relating to the 27years (1992-2018).
Soil module
It contains a very detailed description of the soil texture of each horizon (percentages of each element: sand, silt and clay), cation exchange capacities and density. These data are necessary for the model to calculate the hydraulic properties and the soil water balance (runoff, infiltration, evaporation).
Technical itineraries module
In this file we have introduced, the same cultural operations adopted in field trials conducted in Kef experimental region:
Crop module
Crop module includes the most sensitive parameters of the model. These parameters are grouped by function, namely: classification, sowing, growth, morphology, phenology, vernalization, photoperiod, dormancy, harvest, residues, nitrogen nutrition, sensitivity to salts etc. Default values for a number of crop types are provided by "Cropsyst" and may need to be adjusted for local cultivars. Certain parameters were collected from articles, and documentations or estimate by specialists’ calculations.
Crop cultivar
Location specifying the study area indicating its altitude, latitude, stiffness and slope length, observed daily series of maximum and minimum air temperature, precipitation, solar radiation, maximum and relative minimum humidity and wind speed for 27 years from 1992 to 2018 were collected directly from the meteorological station located in Kef region. Table 1 illustrates parameters used for simulations.
|
Location |
Latitude |
Longitude |
Elevation |
Annual Mean Temperature |
Annual Mean Precipitation (mm) |
Soil characteristics |
||||
|
Kef |
36°15' |
8°7' |
600 m |
17.4 |
422.37 |
Layer 0-15 cm |
Layer 15-30 cm |
Layer 30-45 cm |
Ph |
Depth |
|
Clay 50 % |
Silt 30 % |
Sand 20 % |
8.2 |
45 cm |
||||||
|
ET model |
sowing depth (cm) |
Irrigation |
Planting date |
Fertilizer |
Cultivar type |
Seed |
||||
|
Penman Montieth |
12 |
Rainfed |
15-Nov |
DAP 100 kg/ha |
Ammonium nitrate 100 kg/ha |
Barley: Manel, Rihane, Imen |
Certified |
|||
Table 1: Simulation parameters.
Weather data
Observed local weather data were provided directly from the meteorological station located in Kef region (northwest of Tunisia) for the twenty seven-year period (1992-2018). These data concerned location specifying the study area indicating its altitude, latitude, stiffness and slope length, observed daily series of maximum and minimum air temperature, precipitation, solar radiation, maximum and minimum of relative humidity and wind speed.
Based on the fact that climate change, combined with other factors surrounding cultures, could change the barley conditions in the future, two daily weather series (2019-2058) for climate change impact and adaptation analysis were produced via weather generator ClimGen in Cropsyst (Figure 2).
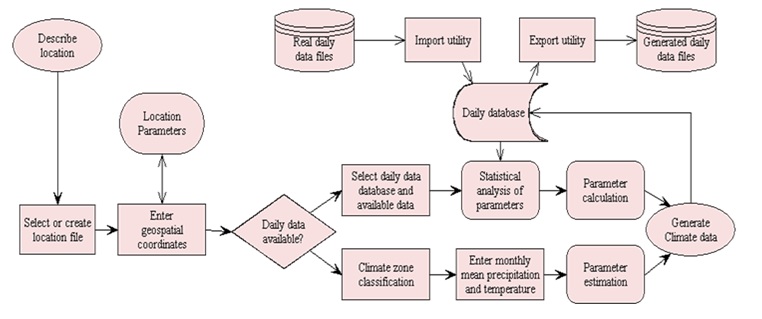 Figure 2: ClimGen flowchart.
Source: Nelson [25].
These parameters were derived from the observed weather series and used to generate series representing the future climate conditions (a baseline scenario: 0.2°C temperature rise). If current rates of anthropogenic greenhouse gas emissions (CO, CH, CFCs, N, O) continue, it is projected that global mean surface temperatures will increase 1.5°C to 4°C in the coming century (Intergovernmental Panel on Climate Change, 1995 [20]). To generate series representing changed climate conditions, the parameters of the generator were modified according to climate change scenario with 1°C temperature rise witch incorporated equal increase of 1°C in day time maxima and nighttime minima of the temperature. These values were entered as deltas which were added to the respective generated element values. Adjustments are applied between the first and the last date entered for the corresponding item. Several parameters are generated. We quote the main parameters (temperature and precipitation) on which this work is based (Figures 3 and 4). Simulations carried out were re-started each year after harvest using the soil water content for the forty years of weather data calculated using the initial soil water profile.
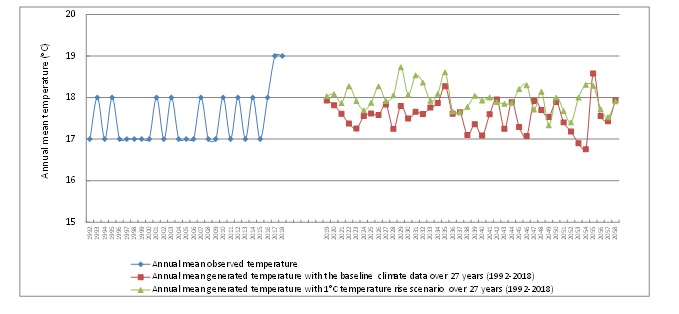 Figure 3: Annual mean observed (1992-2018) and generated (2019-2058) temperature (°C).
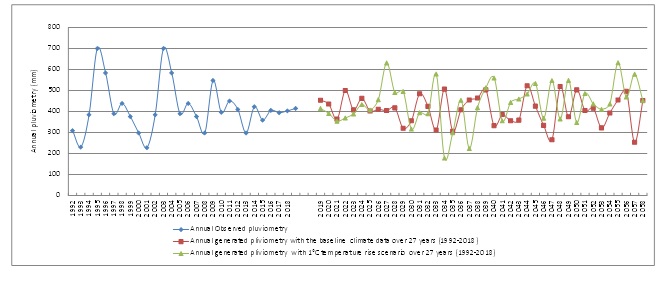 Figure 4: Annual mean observed (1992-2018) and generated (2019-2058) precipitation (mm).
Statistical analysis
The observed and simulated data were subjected to mean± standard deviation, chi2 and correlation coefficient, using MS excel 2007 version.
RESULTS AND DISCUSSION
Generated climate data (2019-2058)
The simulations carried out with ClimGen for the Kef region in northern Tunisia, the country's main cereal region, showed that with the baseline climate data over 27 years (1992-2018) for 40 years (2019-2058) the average temperature , which was 17.4 °C, will rise to 17.6 °C around the year 2058, showing an increase of 0.2 °C (Figure 3). According to Pillet et al. [26]; the WWF study, assuming an overall temperature rise of + 2 °C. It concludes that the annual temperature has increased from + 1.5°C to + 2.8°C from north to south of Tunisia. The seasonal increases vary from + 1.7 °C to + 2.8 °C for autumn, from + 1.8°C to + 3.5 °C for summer, from + 1.2 °C to + 2.2 °C for spring and from + 1.3 °C to + 2.3 °C in winter during the period 2031-2060 (compared to the reference period 1961-1990).
Referring to an Algerian study of 2001, using the UHKI model of the German Max Mayer Institute and the ECHAMAR3 model, projecting for Tunisia a seasonal temperature rise for the climatic period 1990-2020 indicating temperature increases ranging from + 0.8 °C to 1.0 °C in autumn, from + 0.8 °C to + 0.95 °C in winter, from + 0.85 °C to 0.95 °C in spring and from + 0.9 °C to + 1.6 °C in summer [26], with 1°C temperature rise scenario over 27 years (1992-2018), the mean temperature will pass to 18 °C towards the years 2058, accusing a mean increase of 0.6 °C (Figure 3).
Further, the observed mean precipitation over 27 years, which was 422.3 mm will pass respectively to 408.9 mm (+0.2 °C) and 437.9 mm (+0.6 °C) around the years 2058, accusing a decrease of 13.3 mm (-3.2%) and an increase of 15.5 mm (+3.9) (Figure 4) thus justifying the rainfall variability.
Calibration and evaluation of cropsyst barley model
There is no such thing as a universal model that will work with an unaltered set of parameters for all conditions. So, model calibration is a necessary requirement before model application. To represent cultivar specific characteristics, fine tuning of selected crop input parameters is desirable, provided that suitable experimental data is available. This is done by adjusting these parameters within a narrow range of fluctuation of typical values.
With the data relating to barley varieties and climate (1992-2019), a basic model for each barley variety was applied in a first step. The climate and location data, soil characteristics and barley physiological parameters were entered. The cultivation techniques (crop rotation and fertilization applied) are the same adopted in field trials conducted in Kef experimental region during twelve years cropping seasons (2008-2019). The period was chosen for the availability of real data relating to climate and yields of the three barley varieties. These yields levelswere considered as control for calibration of models.
Simulations were carried out short-term over twelve years (2008-2019).The first results obtained showed that the simulated yields approximate the observed yields for each variety. However, we are seeing slight differences between simulated and observed yields. These differences led us to acting on certain physiological parameters of varieties (growth, morphology and phenology) to get closer the real and simulated yields. The short-term barley models validated were used for the long-term simulations (2019-2058).
Short-term simulation of barley varieties
Observed and simulated barley yields and biomass in metric tons per hectare (t/ha) for every year from 2008 to 2019 are compared in table 2 and Figures 5, 6 and 7. The inter-annual variability of simulated and observed yields depended primarily on the amount of rainfall during the growing period. Moreover simulated and observed yields and biomass were not significantly different (chi2 = 0).
|
Variety |
Observed |
Standard Deviations |
Simulated |
Standard Deviations |
R2 |
Chi2 |
|
|
Yield (2008-2019) |
Imen |
3.77 ± |
1.73 |
3.76 ± |
0.70 |
0.27 |
0,000020 |
|
Unit t/ha |
Manel |
3.31 ± |
1.69 |
3.31 ± |
0.84 |
0.32 |
0,000014 |
|
Rihane |
3.50± |
1.63 |
3.50 ± |
0.59 |
0.37 |
0,000081 |
|
|
Biomass (2008-2019) |
Imen |
7.9 ± |
1.4 |
7.8 ± |
1.5 |
-0.14 |
0,000000 |
|
Unit t/ha |
Manel |
6.8 ± |
1.9 |
6.7 ± |
1.9 |
-0.20 |
0,000000 |
|
Rihane |
7.0 ± |
1.4 |
7.0 ± |
1.5 |
-0.16 |
0,000000 |
Table 2: Observed and simulated mean barley yields and biomass and standard deviations.
Observed standard deviations of barley yield and biomass were not significantly larger than Simulated (R2< 0.5). However, in reality and taking into account natural conditions, observed yields are subject to factors that affect them such as losses due to illnesses to manipulations of transport and packaging. These factors are not modeled, which is confirmed by other authors [27] and explain the difference between the observed and simulated values of the standard deviations.
 Figure 5: Observed and simulated (2008-2019) yield and biomass of Imen variety.
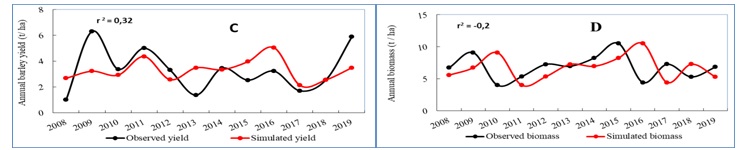 Figure 6: Observed and simulated (2008-2019) yield and biomass of Manel variety.
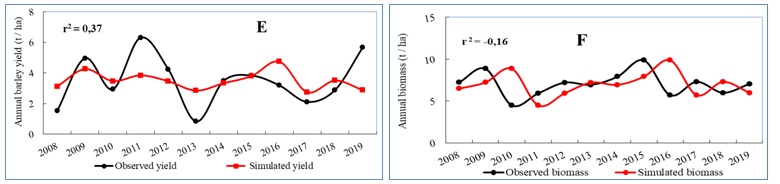 Figure 7: Observed and simulated (2008-2019) yield and biomass of Rihane variety.
Effects of increased temperature on imen barley variety yields
To account for the effects of heat extremes on barley yields, we used all available daily weather measurements from meteorological stations (with an approximately complete temporal coverage for the study period). The effects of a baseline scenario and with 1°C temperature rise scenario were analyzed for each variety. The crop variables analyzed were grain yield and above-ground biomass at harvest.
Effects of the baseline generated climate data
Simulations made over 40 years showed that the mean simulated grain yields (2020-2058) will be respectively about 4.31 t/ha, 3.76 t/ha and 3.85 t/ha, towards the years 2058, compared to the mean observed yields which were about 3.8t/ha (Imen), 3.3 t/ha (Manel) and 3.5 t/ha (Rihane) (Figure 8).
Compared to the situation without climate change, the observed climate trends led to increases of around 14% in barley yields of the Imen barley variety 13% in yields of the Manel variety in the Kef region in north-west Tunisia, while a smaller positive effect was noted for Rihane 10 % barley varieties (Figure 8). The positive effects of temperature on yields partially offset the negative effects of precipitation. The different results in Kef may be partly due to the high latitude of the region (latitude: 36°16'), hypothesis demonstrated by Easterling et al., [28,29].
Similarly, the mean biomass of Imen barley varieties, Manel and Rihane wich were about 7.9 t/ha (Imen), 6.8 t/ha (Manel) and 7 t/ha (Rihane) will pass respectively to 9 t/ha, 7.8 t/ha and 8 t/ha (Figure 8) accusing an increase respectively of 1.1 t/ha (14.1 %), 1 t/ha (14.8 %) and 0.9 t/ha (13.6 %).
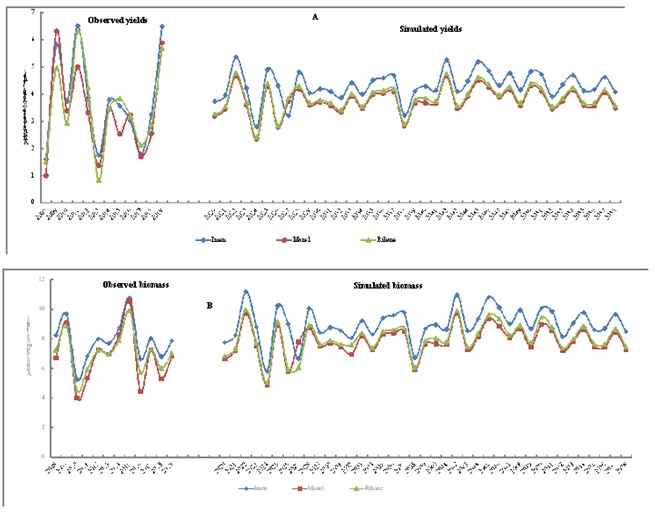 Figure 8: Barley varieties (Imen, Manel and Rihane) simulated grain yield (A) and biomass (B) with the baseline generated climate data over 40 years (2020-2058).
Effects of the climate change with 1°C temperature rise scenario
The temperature rise scenario (+1 °C) applied for the same period could decrease the mean yields achievable in field trials in long term by about 0.16 t/ha (Rihane) and 0.46 t/ha (Manel) (4.7 % and 14 %) (Figure 10). This work is confirmed by Chebil [30] and Mlaouhi et al. [31], showing that cereal and winter forage crops decreases will be between 0.13 and 0.83 t/ha (5.8 to 23.1 %). Initially, these results seem to contradict the results from the baseline model, particularly for Rihane and Manel varieties, where the negative yield impacts were primarily driven by the increase in temperature. However, simulations revealed a clear long-term positive trend in yield only for Imen which indicate a slight increase of 0.02 t/ha (0.5 %) with +1°C temperature rise.
Biomass was also affected and accused decreases about of 6.3 %/ha for Imen in comparison to Manel 27.9% and Rihane 7.1 % (Figure 9). Cropsyst simulation data, suggests the resilience of Imen barley production (yield and biomass) compared to the two varieties Manel and Rihane.
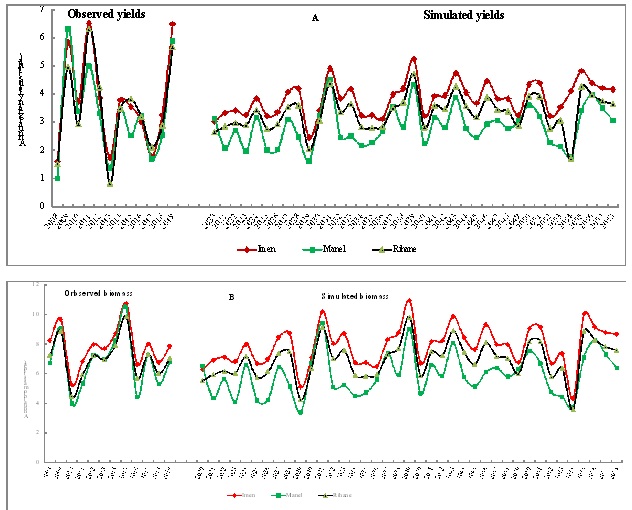 Figure 9: Barley varieties (Imen, Manel and Rihane) simulated grain yield (A) and biomass (B) with 1°C temperature rise scenario generated climate data over 40 years (2020-2058).
Simulated responses to temperature for Imen variety were significantly different from those for Rihane and Manel. Yield reductions for the three varieties could be caused primarily by the direct effects of mean temperature increase on crop phenological development. According to Rosenzweig and Tubiello [19] by reducing the duration of stem and ear growth in particular, less carbohydrate reserves were available for grain-filling. Yields were thus significantly reduced, despite small positive effects of temperature on photosynthesis.
Predicted higher temperatures could affect plant productivity in several ways. They could modify the incidence of winterkill and reduce vernalization [15]. Higher potential evapotranspiration could increase crop water stress, further inhibiting yields. Temperature increases will tend to reduce the length of the growing period, potentially depressing overall biomass accumulation and yield [16,17].
Finally, warmer temperatures could modify the rates of photosynthesis and respiration, thus affecting crop growth rates [18]. While global mean surface air temperatures have increased by about 0.5 °C in the past century [32], recent observations over a large portion of the earth’s land area suggest that minimum temperatures have increased about three times as much as the corresponding maxima over the period 1951-1990 [33]. A recent multiple-regression analysis of corn yields in the Southern US for the last 50 years stressed the importance of minimum/maximum temperature asymmetries in determining interannual yield variations [34].
A bottleneck in the selection of modern varieties has resulted in a reduction in total genetic diversity and a loss of specific alleles relevant to climate-smart agriculture. However, extensive and well-curated collections of landraces, wild barley accessions (H. vulgare ssp. spontaneum) and other Hordeum species exist and are important new allele sources. A wide range of genomic and analytical tools have entered the public domain for exploring and capturing this variation, and specialized populations, mutant stocks and transgenic facilitate the connection between genetic diversity and heritable phenotypes. These lay the biological, technological and informational foundations for developing climate-resilient crops tailored to specific environments that are supported by extensive environmental and geographical databases, new methods for climate modelling and trait/environment association analyses, and decentralized participatory improvement methods [10].
CONCLUSION
Barley has been a model for genetic and cytogenetic studies for over 80 years [35,36]. The effects of temperature on meiosis have been studied. They provide an indication of the possible impacts of climate change on recombination [37] and fertility (with, e.g. possible decreased yields). Numerous morphological and cytological mutants have been produced, with Knüpffer [38] reporting > 25 000 genetic stocks, including wheat-barley addition and substitution lines that may facilitate the introduction of favourable traits such as salt and drought tolerance from barley into wheat [39] and crucial composite cross populations [40]. Mutant stocks generally have more extreme morphological and developmental phenotypes than natural allele series, and have recently become a powerful tool to facilitate proof of gene function [41-43]. Reverse genetics approaches such as targeting induced local lesions in genomes [44] for the identification of mutant alleles can be similarly informative, and transgenic genetic modification methods based on transcription activator-like effectors [45] or clustered regularly interspaced short palindromic repeats [46,47] technologies are exceptionally promising emerging alternatives.
Suitable adaptation strategies include switching to more drought-resistant crops or to extensive livestock production in areas where climate change has negatively affected crop yields, and the expansion of cereal production in areas that have benefited from climate change [48].
Our results provide the first fine-scale assessment of the impacts of climate change on barley yields and can help farmers. It might be applied by policymakers and investors to formulate spatially targeted adaptation strategies to vast regions of North Africa with similar environmental characteristics. They should carefully determine whether to continue supporting cereal cultivation or to seek alternative agricultural activities for the regions that are already negatively affected by climate change.
REFERENCES
- Ray DK, Ramankutty N, Mueller ND, West PC, Foley JA (2012) Recent patterns of crop yield growth and stagnation. Nature Communications 3: 1293.
- Perez-Lopez U, Robredo A, Lacuesta M, Mena-Petite A, Munoz-Rueda A (2009) The impact of salt stress on the water status of barley plants is partially mitigated by elevated CO2. Environmental and Experimental Botany 66: 463-470.
- Högy P, Poll C, Marhan S, Kandeler E, Fangmeier A (2013) Impacts of temperature increase and change in precipitation pattern on crop yield and yield quality of barley. Food Chemistry 136: 1470-1477.
- Yau SK, Ryan J (2013) Differential impacts of climate variability on yields of rainfed barley and legumes in semi-arid Mediterranean conditions. Archives of Agronomy and Soil Science 59: 1659-1674.
- Nelson GC, Rosegrant MW, Palazzo A, Gray I, Ingersoll C, et al. (2010) Food security, farming, and climate change to 2050: scenarios, results, policy options. International Food Policy Research institute, Washington, DC., USA.
- Zhao C, Liu B, Piao S, Wang X, Lobell DB, et al. (2017) Temperature increase reduces global yields of major crops in four independent estimates. Proceedings of the National Academy of Sciences of the United States of America 114: 9326-9331.
- Schierhorn F, Faramarzi M, Prishchepov AV, Koch FJ, Müller D (2014) Quantifying yield gaps in wheat production in Russia. Environmental Research Letters.
- Lobell DB, Schlenker W, Costa-Roberts J (2011) Climate trends and global crop production since 1980. Science 333: 616-620.
- Newton AC, Flavell AJ, George TS, Leat P, Mullholland B, et al. (2011) Crops that feed the world 4. Barley: A resilient crop? Strengths and weaknesses in the context of food security. Food Security 3: 141-178.
- Dawson IK, Russell J, Powell W, Steffenson B, Thomas WTB, et al. (2015) Barley: A translational model for adaptation to climate change. New Phytologist 206: 913-931.
- Cossani CM, Slafer GA, Savin R (2011) Do barley and wheat (bread and durum) differ in grain weight stability through seasons and water-nitrogen treatments in a Mediterranean location? Field Crops Research 121: 240-247.
- Sommer R, Glazirina M, Yuldashev T, Otarov A, Ibraeva M, et al. (2013) Impact of climate change on wheat productivity in Central Asia. Agriculture, Ecosystems & Environment 178: 78-99.
- Challinor AJ, Watson J, Lobell DB, Howden SM, Smith DR, et al. (2014) A meta-analysis of crop yield under climate change and adaptation. Nature Climate Change 4: 287-291.
- Rockström J, Steffen W, Noone K, Persson A, Chapin FS, et al. (2009) Asafe operating space for humanity. Nature 461: 472-475.
- Meams LO, Rosenzweig C, Goldberg R (1992) Effects of changes in interannual climatic variability on CERES-Wheat yields: sensitivity and 2 × CO2, general circulation model studies. Agricultural and Forest Meteorology 62: 159-189.
- Monteith JL (1981) Climatic variations and the growth of crops. Quarterly Journal of the Royal Meteorological Society 107: 749-774.
- Butterfield RE, Morison JIL (1992) Modeling the impact of climatic warming on winter cereal development. Agricultural and Forest Meteorology 62: 241-261.
- Long SP (1991) Modification of the response of photosynthetic productivity to rising temperature by atmospheric CO2, concentrations: Has its importance been underestimated? Plant, Cell and Environment 148: 729-739.
- Rosenzweig C, Tubiello FN (1996) Effects of changes in minimum and maximum temperature on wheat yields in the central USA simulation study. Agricultural and Forest Meteorology 80: 215-230.
- Najar A, Ben Ghanem H, Mlaouhi S, Belcherif S, Nasraoui R (2017) Amélioration de la marge brute suite à l'utilisation de la nouvelle variété d’orge "Imen" sélectionnée pour sa résistance au virus de la jaunisse nanisante de l'orge (BYDV. Journal of new sciences. Agriculture and Biotechnology 44: 2439-2447.
- Boussard JM (1987) Economie de l'agriculture. Economica, Paris, France.
- Flichman G (1997) Bio-economic models integrating agronomic, environmental and economic issues with agricultural use of water. CIHEAM-IAMM, Options Méditerranéennes, France. Pg no: 327-336.
- Stöckle C, Donatelli M, Nelson R (2003) CropSyst, a croping systems model. European Journal of Agronomy 18: 289-307.
- Stöckle CO, Nelson R (2005) Cropping systems simulation model user's manual.
- Nelson R (2005) ClimGen-climatic data generator user's manual.
- Pillet G, King L, Nasr Z, Almohamad H, Maag CC, et al. (2007) Etude: Stratégie nationale d’adaptation de l’agriculture tunisienne et des écosystèmes aux changements climatiques, GIZ, Bonn, Germany.
- Flichman G (2001) Couplage de modèles agronomiques et économiques. Intérêts, limites et perspectives. communication au séminaire en économie de la production du département ESR/INRA paris, France.
- Easterling W, Aggarwal P, Batima P, Brader K (2008) Food, fibre and forest product. In “climate change, 2007: Climate change impacts, adaptation and vulnerability. Cambridge University Press, IPCC working Group II, Cambridge, England.
- Gordon C, Cooper C, Senio CA, Banks H, Gregory JM, et al. (2000) The simulation of SST, sea ice extents and ocean heat transports in a version of Hadley Centre coupled mode without flux adjustments. Climate Dynamics 16: 147-168.
- Chebil A, Mtimet N, Tizaoui H (2011) Impact of climate change on the productivity of cereal crops in the region of Béjà-Tunisia. African Journal of Agricultural and Resource Economics 6: 144-154.
- Mlaouhi S, Boujelben A, Elloumi M (2015) Climate change effects on barley behavior in an irrigated area by treated wastewater in Tunisia. Ovidius University Annals Series: Civil Engineering, Constan?a, Romania. Pg no: 17-24.
- Jones PD, Wigley TML, Farmer G (1991) Marine and land temperature data sets: A comparison and a look at recent trends. Developments in Atmospheric Science 19: 153-172.
- Karl TR, Kukla G, Razuvayev VN (1991) Global warming: Evidence for asymmetric diurnal temperature change, Geophysical Research Letters 18: 2253-2256.
- Stooksbury DE, Michaels PJ (1994) Climate change and large area corn yield in the Southeastern United States. Agronomy Journal 86: 564-569.
- Smith L (1951) Cytology and genetics of barley. The Botanical Review 17: 1-51.
- Ward DJ (1962) Some evolutionary aspects of certain morphologic characters in a world collection of barleys. US Department of Agriculture Agricultural Research Service, Technical Bulletin, Washington, DC., USA.
- Higgins S, Xiao Z, Katsipataki M (2012) The Impact of Digital Technology on Learning: A Summary for the Education Endowment Foundation. Economics.
- Knüpffer H (2009) Triticeae genetic resources in ex situ genebank collections. In: Muehlbauer GJ, Feuillet C (eds). Genetics and genomics of the Triticeae. Plant genetics and genomics: Crops and models. Springer, New York, USA. Pg no: 31-80.
- Molnar-Lang M, Linc G, Szakacs E (2014) Wheat-barley hybridization: The last 40 years. Euphytica 195: 315-329.
- Allard RW (1999) History of plant population genetics. Annual Review of Genetics 33: 1-27.
- Ramsay L, Comadran J, Druka A, Marshall DF, Thomas WTB, et al. (2011) INTERMEDIUM-C, a modifier of lateral spikelet fertility in barley, is an ortholog of the maize domestication gene TEOSINTE BRANCHED 1. Nature Genetics 43: 169-172.
- Houston K, McKim SM, Comadran J, Bonar N, Druka I, et al. (2013) Variation in the interaction between alleles of HvAPETALA2 and microRNA172 determines the density of grains on the barley inflorescence. Proceedings of the National Academy of Sciences, USA 110: 16675-16680.
- Mascher M, Jost M, Kuon J, Himmelbach A, Aßfalg A, et al. (2014) Mapping-by-sequencing accelerates forward genetics in barley. Genome Biology 15: 78.
- Colbert T, Till BJ, Tompa R, Reynolds S, Steine MN, et al. (2001) High-throughput screening for induced point mutations. Plant Physiology 126: 480-484.
- Boch J (2011) TALEs of genome targeting. Nature Biotechnology 29: 135-136.
- Barrangou R, Fremaux C, Deveau H, Richards M, Boyaval P, et al. (2007) CRISPR provides acquired resistance against viruses in prokaryotes. Science 315: 1709-1712.
- Wang Y, Cheng X, Shan Q, Zhang Y, Liu J, et al. (2014) Simultaneous editing of three homoeoalleles in hexaploid bread wheat confers heritable resistance to powdery mildew. Nature Biotechnology 32: 947-951.
- Schierhorn F, Hofmann M, Adrian I, Bobojonov I, Müller D (2020) Spatially varying impacts of climate change on wheat and barley yields in Kazakhstan. Journal of Arid Environments 178.
Copyright: © 2020 Mlaouhi S, et al. This is an open-access article distributed under the terms of the Creative Commons Attribution License, which permits unrestricted use, distribution, and reproduction in any medium, provided the original author and source are credited.