Prevalence of Depression and its Associated Factors among Elderly Visiting Primary Care, Taif, Saudi Arabia 2021
*Corresponding Author(s):
Muied Ali AlqarnyFamily Medicine Consultant, Saudi Arabia
Email:maxmoied38@gmail.com
Abstract
Aim
Assessment of prevalence rate of depression among elderly patients visiting PHCs in Taif city.
Objectives
To measure the prevalence of depression among elderly patient visiting primary care centres.
To assess other factors that could associated with the prevalence rate.
Methodology
This study was conducted in 8 PHCs. Study population includes all Patients with the age 60 years and above who has given written informed consent. Various demographic parameters, family history of depression, family income, marital status, current depression status etc. was collected. SPSS 26 was used to calculate prevalence and Association between depression and other factors.
Results
Out of 419, 101 patients were suffering with some level of depression. The prevalence of depression was 24.1 %. Significant associations were found between Depression and Age, Gender & Family History.
Keywords
Prevalence of Depression; Primary Care; Taif
Introduction
Depression is a mental state characterised by persistent low mood, loss of interest and enjoyment in everyday activities, neurovegetative disturbance, and reduced energy, causing varying levels of social and occupational dysfunction [1].
According to the world health report 2011 of the world health organisation, 15 % of major depressive patients are more likely to commit suicide [2]. According to 2012 Statistics, one in every twenty persons is likely to have an episode of depression across the globe [3]. In the United States, the prevalence of depression is about 9% among the general population [4-6]. Whereas the European countries have the prevalence rate of about 8.5% [6]. The prevalence rate of depression has sharply increased universally during the last 10 years especially in developing countries, the prevalence rate even reached around 44%. The Primary Health Centre (PHC) is the first point of contact between the people and the health care delivery system, and the prevalence of depression is high among the patients attending the primary health centres [7].
The World Health Organization (WHO) has estimated that the impact of mental disorders will become the second leading cause of disability among individuals with elderly the risk increase [8]. The mental health problems are anticipated to accounts for 14% of the disease burden worldwide [9].
In Saudi Arabia, the prevalence of depression among the attendees of primary health centres was estimated to be between 30 to 46% in the year 1995 [10] whereas in 2002 the prevalence rate of depression in Saudi Arabia was found to be 18% among the adult population [11]. It is evident that the prevalence of depression in the kingdom of Saudi Arabia is quite high and also increase in the risk factors which can enhance the depression level such as stress, chronic diseases, sedentary lifestyle, social isolation and social stigmas in terms of psychiatric illnesses [12].
Methods and Materials
This study encompasses a cross-sectional approach to quantify the perveance rate of depression among elderly patients visiting primary health care centres at Taif city. The primary healthcare centres of Ministry of Health in Taif city a provide precautionary and therapeutic services to the population as well as reducing patient load on the hospitals. Each centre represents a geographical are that serves large number of patients with different demographics. The study aims to collect data on the whole study population at a single point in time to examine the governing attributes during the diagnosis process and relationship between the depression rate and other variables of interest. It encompasses all elderly patients equal or above 60 years visiting primary healthcare canters in Taif city.
Multistage cluster sampling was followed, and the Taif city will be divided into East, West, North and South administrations and the number of primary health centres was listed based on these four administrative directions. Two Primary health centres from each administrative direction will be selected by using a simple random sampling technique. Patients from the selected primary health centres were enrolled in the study by using the simple random sampling technique.
The sample size was calculated by the Epi Info statistical program based on the previously published literature prevalence of depression was 18%, at a significance level of 0.05, a design effect of 1 and confidence interval of 95% ended with a minimum sample size estimated to be 419 patients.
Data related to the depression were collected by using standardised questionnaire Patient Health Questionnaire-PHQ-2, and PHQ-9 Arabic version validated questionnaires. A self-administered modified questionnaire was developed by conducting an extensive literature search from various databases and the previously published scholarly literature on depression and its risk factors among elderly patients visiting the primary health centres were identified, selected and used to frame the questionnaire that was previously been used & validated.
Data collected was then analysed through SPSS software wherein the qualitative data was computed and presented using parameters of ‘frequency’ and ‘percentage’. On the other hand, the quantitative data was computed and presented using parameters of ‘mean’, ‘mode’ and ‘standard deviation’. Multinomial logistic regression was used in SPSS software which compares multiple groups through a combination of binary logistic regressions.
Results And Discussion
The study month comprise of record of 419 patients who attended the eight PHCCs in Taif city. The overall prevalence of reference rate was 24.1 % among elderly patients visiting primary health care in Taif as shown in Table 1 where in other studies in Saudi Arabia, the prevalence of depression among the attendees of primary health centres was estimated to be between 30 to 46% in the year 1995 where as in 2002 the prevalence rate of depression in Saudi Arabia was found to be 18% among the adult population.
|
Depression |
Frequency |
Percent |
|
Mild depression |
68 |
16.2 |
|
Moderate depression |
6 |
1.4 |
|
Moderately severe depression |
22 |
5.3 |
|
No depression |
318 |
75.9 |
|
Severe depression |
5 |
1.2 |
|
Total |
419 |
100 |
Table 1: The representative sample (N) after randomizations was 419 patients, 203 (48.44 %) patients form Wast Almadinah center, 71 (16.94 %) patients from Awadh, 53 (12.64 %) patients from Janoub Aljanoubiah center, 49 (11.69 %) patients from Alwashah center, 15 (3.57 %) patients from Alhalqah center, 11 (2.62 %) patients from Alsalamah center, 10 (2.38 %) patients from Alsharqiah center, 5 (1.19 %) patients from Alsr center and finally 2 (0.47 %) from Alaslamha center , it was observed that 62 patients in Wast Almadinah center have depression ranging from mild to severe depression , 9 patients in Janoub Aljanoubiah and Awadah centers as shown in Table 2.
Note: Center Name * Depression Status Crosstabulation.
|
Depression Status |
|||||||
|
|
|
Mild Depression |
Moderate Depression |
Moderately Severe Depression |
No Depression |
Severe Depression |
Total |
|
Center Name |
Alaslamha |
0 |
0 |
0 |
2 |
0 |
2 |
|
Alhalqah |
2 |
0 |
1 |
11 |
1 |
15 |
|
|
Alsalamah |
2 |
0 |
1 |
8 |
0 |
11 |
|
|
Alsharqiah |
3 |
0 |
0 |
7 |
0 |
10 |
|
|
Alsr |
0 |
0 |
0 |
5 |
0 |
5 |
|
|
Alwashah |
8 |
2 |
1 |
38 |
0 |
49 |
|
|
Awadah |
9 |
0 |
0 |
62 |
0 |
71 |
|
|
Janoub Aljanoubiah |
5 |
0 |
4 |
44 |
0 |
53 |
|
|
Wast Almadinah |
39 |
4 |
15 |
141 |
4 |
203 |
|
|
Total |
|
68 |
6 |
22 |
318 |
5 |
419 |
Table 2: The study indicated that 318 (75,89 %) of patients have no depression whatsoever where 101 (24.10 %) in total have depression, based on type of depression as follow: 16.23 % Mild depression, 1.43 % Moderate depression, 5.25 % Moderately severe depression and 1.19 % Severe depression as shown in Figure 1.
Note: Marital status * Depression Status Crosstabulation.
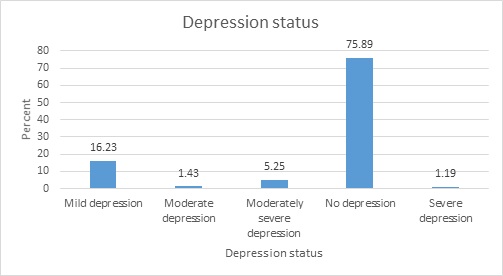 Figure 1: We have notice that 69 patients who have depression were married and 25 patients who have depression were wido/widower unfortunately the P value were insignificant as shown in Table 3 & figure 2.
|
Depression Status` |
|||||||||
|
|
Mild Depression |
Moderate Depression |
Moderately Severe Depression |
No Depression |
Severe Depression |
Total |
P value |
||
|
Marital status |
Divorced |
Count |
2 |
0 |
0 |
7 |
0 |
9 |
0.18 |
|
% |
22.20% |
0.00% |
0.00% |
77.80% |
0.00% |
100.00% |
|||
|
Married |
Count |
48 |
4 |
13 |
235 |
4 |
304 |
||
|
% |
15.80% |
1.30% |
4.30% |
77.30% |
1.30% |
100.00% |
|||
|
Single |
Count |
1 |
0 |
4 |
6 |
0 |
11 |
||
|
% |
9.10% |
0.00% |
36.40% |
54.50% |
0.00% |
100.00% |
|||
|
Widow/widower |
Count |
17 |
2 |
5 |
70 |
1 |
95 |
||
|
% |
17.90% |
2.10% |
5.30% |
73.70% |
1.10% |
100.00% |
|||
|
Count |
68 |
6 |
22 |
318 |
5 |
419 |
|||
|
% |
16.20% |
1.40% |
5.30% |
75.90% |
1.20% |
100.00% |
|||
Table 3: P value is 0.18 (Fisher's Exact Test) statistically not significant. There is no statistically significant association between Marital status and depression.
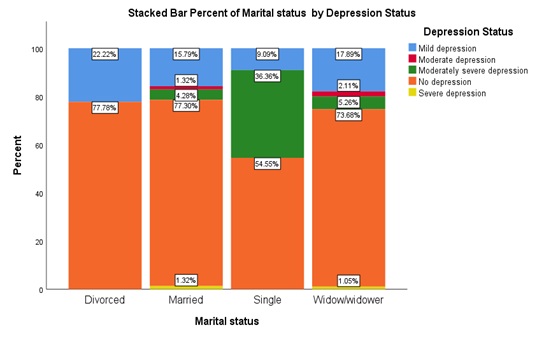 Figure 2: Regarding the age we found that 279 (66.6 %) patients were in age 60 to 70 years, 101 (24.1%) patients between 71 to 80 years, 35 (8.4%) patients between the age of 81 to 90 years, 3 (0.7) patients between the age of 91 to100 years old as shown in Table 4 & Figure 3.
|
Age Range |
Frequency |
Percent |
|
60-70 |
279 |
66.6 |
|
71 - 80 |
101 |
24.1 |
|
81 - 90 |
35 |
8.4 |
|
91 - 100 |
3 |
0.7 |
|
101+ |
1 |
0.2 |
|
Total |
419 |
100 |
Table 4: We have found that there is statistically significant association between age and depression status. P value (Fisher's Exact Test) < 0.05. People in age range of 71-80 have higher percentage of depression followed by age group of 60-70. Larger sample size is required to comment on other age ranges as shown in Table 5.
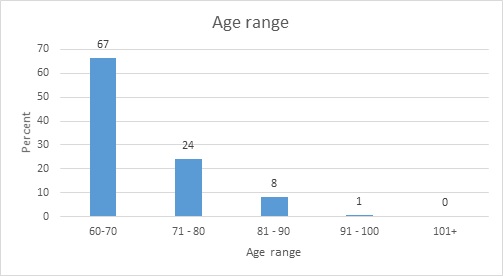 Figure 3: We have found that there is statistically significant association between age and depression status. P value (Fisher's Exact Test) <0.05. People in age range of 71-80 have higher percentage of depression followed by age group of 60-70. Larger sample size is required to comment on other age ranges as shown in Table 5.
|
|
Mild depression |
Moderate depression |
Moderately severe depression |
No depression |
Severe depression |
Total |
P-Value |
||
|
Age range |
60-70 |
Count |
50 |
3 |
13 |
211 |
2 |
279 |
<0.05 |
|
% |
17.90% |
1.10% |
4.70% |
75.60% |
0.70% |
100.00% |
|||
|
71 - 80 |
Count |
11 |
1 |
1 |
86 |
2 |
101 |
||
|
% |
10.90% |
1.00% |
1.00% |
85.10% |
2.00% |
100.00% |
|||
|
81 - 90 |
Count |
6 |
2 |
5 |
21 |
1 |
35 |
||
|
% |
17.10% |
5.70% |
14.30% |
60.00% |
2.90% |
100.00% |
|||
|
91 - 100 |
Count |
1 |
0 |
2 |
0 |
0 |
3 |
||
|
% |
33.30% |
0.00% |
66.70% |
0.00% |
0.00% |
100.00% |
|||
|
101+ |
Count |
0 |
0 |
1 |
0 |
0 |
1 |
||
|
% |
0.00% |
0.00% |
100.00% |
0.00% |
0.00% |
100.00% |
|||
|
Total |
Count |
68 |
6 |
22 |
318 |
5 |
419 |
||
|
% |
16.20% |
1.40% |
5.30% |
75.90% |
1.20% |
100.00% |
|||
Table 5: There is no statistically significant association between Family income and depression status. P value (Fisher's Exact Test) 0.27 although moderate income has the higher cases of depression as shown in Table 6.
|
|
Mild depression |
Moderate depression |
Moderately severe depression |
No depression |
Severe depression |
Total |
P-Value |
||
|
Family Income |
High |
Count |
6 |
1 |
2 |
21 |
1 |
31 |
0.27 |
|
% |
8.80% |
16.70% |
9.10% |
6.60% |
20.00% |
7.40% |
|||
|
Low |
Count |
26 |
4 |
9 |
107 |
1 |
147 |
||
|
% |
38.20% |
66.70% |
40.90% |
33.60% |
20.00% |
35.10% |
|||
|
Moderate |
Count |
36 |
1 |
11 |
190 |
3 |
241 |
||
|
% |
52.90% |
16.70% |
50.00% |
59.70% |
60.00% |
57.50% |
|||
|
Total |
Count |
68 |
6 |
22 |
318 |
5 |
419 |
||
|
% |
100.00% |
100.00% |
100.00% |
100.00% |
100.00% |
100.00% |
|||
Table 6: The moderate income constitutes 57.5 % then followed by low income 35.1 % and finally the high income 7.4 % as shown in Table 7.
|
Family income |
Frequency |
Percent |
|
High |
31 |
7.4 |
|
Low |
147 |
35.1 |
|
Moderate |
241 |
57.5 |
|
Total |
419 |
100 |
Table 7: We observed that Female gender has a higher incidence of depression compare to Male Gender with a statistically significant association P Value (Fisher's Exact Test) =0.012 between Gender and depression status. Females having higher depression levels as shown in Figure 4.
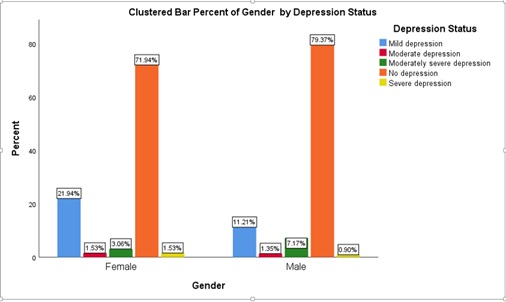 Figure 4: We have found that there is statistically significant association. between Family history and depression status. People with family history of depression are having higher depression levels. P Value (Fisher's Exact Test) =0.012 as shown in Table 8.
|
Depression Status |
|||||||||
|
|
Mild depression |
Moderate depression |
Moderately severe depression |
No depression |
Severe depression |
Total |
P-Value |
||
|
Family history of depression |
No |
Count |
53 |
3 |
15 |
295 |
3 |
369 |
<0.05 |
|
% |
14.40% |
0.80% |
4.10% |
79.90% |
0.80% |
100.00% |
|||
|
Yes |
Count |
15 |
3 |
7 |
23 |
2 |
50 |
||
|
% |
30.00% |
6.00% |
14.00% |
46.00% |
4.00% |
100.00% |
|||
|
Total |
Count |
68 |
6 |
22 |
318 |
5 |
419 |
||
|
% |
16.20% |
1.40% |
5.30% |
75.90% |
1.20% |
100.00% |
|||
Table 8: Regarding job title the majority of job title was Housewife 41.3 % then followed by retired 37.2 % with no statistically significant correlation found as shown in Table 9.
Note: Family history of depression * Depression Status Crosstabulation.
|
Depression Status |
|||||||||
|
|
Mild Depression |
Moderate DepreDssion |
Moderately Severe Depression |
No Depression |
Severe Depression |
Total |
p-Value |
||
|
Job |
Accountant |
Count |
1 |
0 |
0 |
0 |
0 |
1 |
0.68 |
|
% within |
1.50% |
0.00% |
0.00% |
0.00% |
0.00% |
0.20% |
|||
|
Businessman |
Count |
0 |
0 |
0 |
2 |
0 |
2 |
||
|
% |
0.00% |
0.00% |
0.00% |
0.60% |
0.00% |
0.50% |
|||
|
Doctor |
Count |
0 |
0 |
0 |
5 |
0 |
5 |
||
|
% |
0.00% |
0.00% |
0.00% |
1.60% |
0.00% |
1.20% |
|||
|
Driver |
Count |
0 |
0 |
0 |
4 |
0 |
4 |
||
|
% |
0.00% |
0.00% |
0.00% |
1.30% |
0.00% |
1.00% |
|||
|
Farmer |
Count |
0 |
0 |
2 |
2 |
0 |
4 |
||
|
% |
0.00% |
0.00% |
9.10% |
0.60% |
0.00% |
1.00% |
|||
|
Government employee |
Count |
0 |
0 |
0 |
10 |
0 |
10 |
||
|
% |
0.00% |
0.00% |
0.00% |
3.10% |
0.00% |
2.40% |
|||
|
House wife |
Count |
36 |
3 |
3 |
129 |
2 |
173 |
||
|
% |
52.90% |
50.00% |
13.60% |
40.60% |
40.00% |
41.30% |
|||
|
Nurse |
Count |
0 |
1 |
0 |
0 |
1 |
2 |
||
|
% |
0.00% |
16.70% |
0.00% |
0.00% |
20.00% |
0.50% |
|||
|
Retired |
Count |
16 |
2 |
17 |
119 |
2 |
156 |
||
|
% |
23.50% |
33.30% |
77.30% |
37.40% |
40.00% |
37.20% |
|||
|
Retired soldier |
Count |
7 |
0 |
0 |
26 |
0 |
33 |
||
|
% |
10.30% |
0.00% |
0.00% |
8.20% |
0.00% |
7.90% |
|||
|
Retired teacher |
Count |
2 |
0 |
0 |
9 |
0 |
11 |
||
|
% |
2.90% |
0.00% |
0.00% |
2.80% |
0.00% |
2.60% |
|||
|
Salesman |
Count |
0 |
0 |
0 |
1 |
0 |
1 |
||
|
% |
0.00% |
0.00% |
0.00% |
0.30% |
0.00% |
0.20% |
|||
|
Security |
Count |
0 |
0 |
0 |
1 |
0 |
1 |
||
|
% |
0.00% |
0.00% |
0.00% |
0.30% |
0.00% |
0.20% |
|||
|
Soldier |
Count |
2 |
0 |
0 |
2 |
0 |
4 |
||
|
% |
2.90% |
0.00% |
0.00% |
0.60% |
0.00% |
1.00% |
|||
|
Teacher |
Count |
4 |
0 |
0 |
8 |
0 |
12 |
||
|
% |
5.90% |
0.00% |
0.00% |
2.50% |
0.00% |
2.90% |
|||
|
Total |
Count |
68 |
6 |
22 |
318 |
5 |
419 |
||
|
% |
100.00% |
100.00% |
100.00% |
100.00% |
100.00% |
100.00% |
|||
Table 9: Job * Depression Status Crosstabulation.
Conclusion
It was reported by Kessler RC the mental health problems are anticipated to accounts for 14% of the disease burden worldwide their work highlighted that there is a lack of proper diagnosis of patient visits the PHCCs (2). The study concluded that a prevalence of depression is 24.1 % existed in eight PHCCs in Taif city. After nominal regression and correlations; there was a significant correlation found between depression and age, gender & family history. We have found that there is statistically significant association between age and depression status. P value <0.05. People in age range of 71-80 have higher percentage of depression followed by age group of 60-70. It was observed that Female gender has a higher incidence of depression compare to Male Gender with a statistically significant association P Value =0. 012. Between Gender and depression status. Also, there is statistically significant association. between Family history and depression status. People with family history of depression are having higher depression levels. P Value =0. 012. In the lights of these results we strongly recommend to empower the Primary Health Care Centers with well-trained Family Physicians who are able to pick up the diagnosis early and initiate the proper management with frequent meetings with hospital departments to manage the patients with feedback once the patients referred to hospital. The family medicine centers needs to be empowered in terms of medications and fast communication channel with psychiatric physicians to avoid extra burden on hospitals.
References
- American Psychiatric Association (2013) Diagnosis and Statistical manual of mental disorders 5th edn (DMS-5). Washington. DC: American Psychiatric publishing.
- Haden A, Campanini B (2001) WHO: The World Health Report: 2001: Mental health: New understanding, new hope Geneva: World Health Organization pg no:
- WHO (2012) Depression Fact Sheet No. 369. Geneva, Switzerland.
- Narrow WE, Rae DS, Robins LN, Regier DA (2002) Revised prevalence estimates of mental disorders in the United States: using a clinical significance criterion to reconcile 2 surveys' estimates. Arch Gen Psychiatry 59: 115-
- Stewart WF, Ricci JA, Chee E, Hahn SR, Morganstein D (2003) Cost of lost productive work time among US workers with depression. JAMA 289: 3135-3144.
- Ayuso-Mateos JL, Vazquez-Barquero JL, Dowrick C, Lehtinen V, Dalgard OS, et al. (2001) ODIN Group: Depressive disorders in Europe: prevalence figures from the ODIN study. Br J Psychiatry 179:308-316.
- Dowrick C, Buchan I (1995) Twelve-month outcome of depression in general practice: Does detection or disclosure makes a difference? BMJ 311:1274-1276.
- Kessler RC, Üstün TB (2004) The world mental health (WMH) survey initiative version of the World Health Organization (WHO) Composite International Diagnostic Interview (CIDI). Int J Methods Psychiatric Res 13: 93-121.
- World Health Organization (2008) World Organization of Family Doctors. Integrating mental health into primary care: A global perspective. Geneva: World Health Organization.
- Faris EA, Hamid AA (1995) Hidden and conspicuous psychiatric morbidity in Saudi primary health care. Arab J Psychiatry 6: 162-175.
- Al-Khathami AD, Ogbeide DO (2002) Prevalence of mental illness among Saudi adult primary-care patients in Central Saudi Arabia. Saudi Med J 23: 721-724.
- Hidaka BH (2012) Depression as a disease of modernity: explanations for increasing prevalence. J Affect Disord 140: 205-214.
Citation: Alqarny AM, Alsofyani A (2021) Prevalence of Depression and its Associated Factors among Elderly Visiting Primary Care, Taif, Saudi Arabia 2021. J Community Med Public Health Care 8: 095
Copyright: © 2021 Muied Ali Alqarny, et al. This is an open-access article distributed under the terms of the Creative Commons Attribution License, which permits unrestricted use, distribution, and reproduction in any medium, provided the original author and source are credited.