Prevalence of Frailty and Sarcopenia and their Coexistence in Patients with advanced Chronic Kidney Disease
*Corresponding Author(s):
Guillermina Barril CuadradoHospital Universitario De La Princesa, Spain
Email:gbarril43@gmail.com
Abstract
With the progression of chronic kidney disease, the prevalence of protein energy depletion is higher, which will increase the risk of frailty and sarcopenia, which will increase vulnerability and dependence.
Aim: The study aims to determine the prevalence of frailty and sarcopenia and its prevalence as a combined syndrome.
Methods: We assessed energy protein depletion using the malnutrition-inflammation score, frailty using Fried's criteria and sarcopenia using the 2019 European Working Group on Sarcopenia in Advanced Age criteria.
Results: The prevalence of sarcopenia was higher compared to frailty, with 29.3% of patients presenting it and the prevalence of frailty was 17.8%. The prevalence was higher in women, both in frailty and sarcopenia. Both syndromes were present in 10.2% of cases. In the multivariate model, age (OR: 1.141, p < 0.001) and C-reactive protein (OR: 1.352; p=0.033) were the risk factors for frailty + sarcopenia a higher % of intracellular water (OR: 0.934; p=0.049) and mid upper arm circumference (OR: 0.89; p=0.023).
Conclusion: Frailty and sarcopenia are two prevalent syndromes in chronic kidney disease and it is necessary to standardize their assessment to establish preventive treatment strategies for these patients. Evaluation and follow-up in advanced chronic kidney disease consultation can help reduce the percentage of frailty and sarcopenia.
Keywords
Advanced Chronic Kidney Disease; Frailty; Sarcopenia
Introduction
As age increases, a series of changes in body composition are observed that directly influence functionality, frailty the risk of sarcopenia. A decrease in lean mass, mainly muscle mass, as well as an increase in fat mass, are the main factors concerning functionality deterioration. This is more evident in older people [1]. Frailty is a geriatric syndrome with a complex definition. In the 2013 Morley et al. consensus, they defined it as "A medical syndrome with multiple causes and additional factors that are characterized by diminished strength, endurance and reduced physiological function that increases individual's vulnerability to developing dependency and/or death" [2]. Just as its definition is complex, so is its diagnosis. There are several tools to define it, such as the Groningen frailty indicator, the Frail frailty index and the Rockwood frailty index, among many others [3]. Currently, the most widely used is the physical phenotype of frailty described by Fried et al. [4], which, in addition to being a predictor of functional decline, is a risk factor for increased hospitalization and increased mortality [5]. Sarcopenia first appeared in 1989. It was defined as a simple decrease in muscle mass that occurs with age. This is also known as physiological sarcopenia [6]. Over the years, this concept has been changing. In 2010, the first concept was modified and defined as "a syndrome characterized by a gradual and generalized loss of skeletal muscle mass and strength, with a risk of adverse outcomes such as physical disability, poor quality of life and mortality" [7]. In 2019, the European Working Group on Sarcopenia in Older People (EWGSOP) updated the concept by including muscle strength as the first requirement to confirm sarcopenia. This means sarcopenia is defined as the loss of muscle strength, muscle mass and function [8]. The diagnosis of sarcopenia varied depending on the study groups. Each established a definition, methodology and cut-off points, although they all agreed that the definition of sarcopenia must include muscle mass loss [9]. Sarcopenia is an imbalance between protein synthesis and protein degradation, tipping the balance in favour of protein degradation. The factors that favour it are inflammation, oxidative stress, metabolic acidosis, insulin resistance and protein-energy intake deficit [10]. All of them are factors that are present in renal disease.
Protein Energy Wasting (PEW) is a very prevalent type of malnutrition in chronic kidney disease. It was defined in 2008 by the International Society of Renal Nutrition and Metabolism (ISRNM) as a syndrome characterized by a decrease in lean mass (mainly muscle mass) and a decrease in fat deposits, mainly due to mixed malnutrition (calorie-protein malnutrition). It is considered a strong predictor of mortality, as it produces biochemical alterations, such as a decrease in albumin, prealbumin, cholesterol, or creatinine [11]. In addition to the clinical consequences, PEW favours the development of frailty and sarcopenia, which is more evident in the final stages of CKD, worsening in the presence of proteinuria [12]. The study aims to determine the prevalence of frailty and sarcopenia and its prevalence as a combined syndrome and to study the factors involved in its development in a group of patients with advanced chronic kidney disease.
Materials And Methods
We included 225 patients from the multidisciplinary consultation of Advanced Chronic Kidney Disease (ACKD) of the nephrology department of the Hospital Universitario de la Princesa in Madrid. This is a prospective observational study, which was assessed and approved by the ethics committee of the Hospital de la Princesa with registration number 4257. To carry out the study, data from the routine clinical practice of the clinic was used:
Assessment of protein energy wasting
The Malnutrition-Inflammation Score (MIS), developed by Kalantar-Zadeh et al [13], was used to determine protein energy wasting. The MIS scale is composed of subjective global assessment components combined with biochemical and anthropometric parameters. These include serum albumin, Total Iron Binding Capacity (TIBC) or transferrin and BMI. There are 10 points graduated according to severity (from normal to very severe). The sum of the score of the ten components will classify the patient into a degree of malnutrition. A score of 0 - 2 classifies the patient with normal nutritional status; a score >2 - 5 with mild to moderate malnutrition; a score >5 - 7 with moderate to severe malnutrition; a score >7 - 10 with severe malnutrition and a score >10 points with severe malnutrition, with a maximum of 30 points. This scale is not only a good method to determine nutritional and inflammatory status, but it is also a good predictor of mortality [14].
Assessment of frailty in the sample
Fried's criteria were used to determine frailty's prevalence. It is composed of five questions or items [15]:
- Weight loss: unintentional weight loss should be taken into consideration.
- Decreased energy- fatigue: this is assessed through 2 questions from the Centre for Epidemiological Studies Depression Scale (CES-D):
a. Did I feel that everything I did was an effort
b. Did I feel like doing nothing?
- Decreased muscle strength: assessed with Dynamometry (Baseline® manual dynamometer model 12-0240), adjusting the results according to age and sex.
- Decrease in physical activity/exercise: this point is evaluated according to the estimated kilocalories per week consumed by the patient.
- Decreased walking speed: determine walking speed when walking 4.5 meters, adjusting the result according to age and sex.
To diagnose frailty, at least three of the five criteria must be present [15].
Assessment of sarcopenia in the sample
The criteria of the European Working Group on Sarcopenia in Older People (EWGSOP) 2019 were used to assess sarcopenia [8]:
- The first criterion consists of determining muscle strength with Dynamometry or with a 5 squat test. In our case, we used the dynamometry data. This algorithm uses 27kg in men and 16kg in women as cut-off points. To determine frailty, we used the dynamometer model Baseline® model 12-0240.
- To confirm sarcopenia, muscle mass must be evaluated, for which appendicular muscle mass or the muscle mass index (IMMA=MMA/Kg2) is used. In this study, we used the IMMA, which uses 7 kg/m2 in men and 6 kg/m2 in women as cut-off points. This data was obtained from the study of body composition with bioimpedance, using an Akern model 101 single-frequency B.I.A. vector bioimpedance apparatus.
- Finally, to confirm the severity of sarcopenia, a functional capacity test should be performed. For this there exist numerous tests, such as the gait speed test, the Timed up and go test (TUTG) or the Test Short Physical Performance Battery SPPB test. In this study we used the SPPB test result and established a result ≥ 8 as a cut-off point.
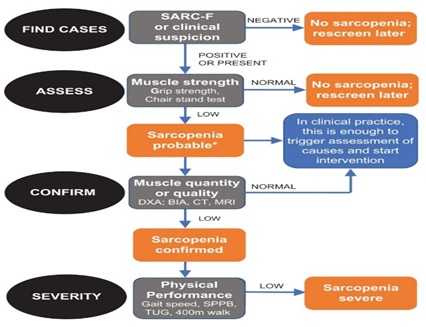 Figure 1. The algorithm of the EWGSOP [8].
Study of muscle strength and functional capacity and muscle strength used in the study of fragility and sarcopenia
Dynamometry: this is a measurement of the force of pressure which can be performed on both the lower and upper body. In this study, we performed the measurement on the upper body. Whenever possible, the patient performed the measurement standing in a neutral position and with the arm at 90°. The highest value of the three measurements was taken as the definite result [16].
Test Short Physical Performance Battery (SPPB): A battery of 3 short tests to determine functional capacity [17]
- Balance test: Measures the time the patient is able to maintain balance for at least 10 seconds in parallel foot stance, semi-tandem foot stance and tandem foot stance
- Meters walking test: Measures the walking speed. It measures the time it takes the patient to walk 4 meters.
- Sit to Stand % test (STS5): Determines strength and endurance. It measures the time it takes the patient to stand up and sit down from a chair 5 times without leaning on it.
Body composition study
The body composition parameters were determined by electrical Bioimpedance (BIA), using a single-frequency device, which measures at 50 kHz and 800 μA. The model used was the Body Impedance Analyzer BIA-101, Akern-RJL systems, Florence, Italy. Bioimpedance was chosen because it is a non-invasive, non-observer-dependent method. In addition to determining hydration, body water and its distribution, it calculates body composition parameters such as muscle mass or fat mass, which helps to determine nutritional status. Impedance consists of measuring the opposition exerted by the different cells and tissues of the organism when exposed to an alternating electric current. To do this, the patient must be placed in a supine position with arms 30° apart and legs 45° apart. The electrical circuit is made by placing two pairs of electrodes, one on the back of the hand and the other on the back of the foot, separated by about 5 cm [18].
The Midupper Arm Circumference (MUAC)), a measure that will estimate the arm muscle mass, was determined by applying the formula MUAC = CB - (π-PT), where CB is the arm circumference, π = 3.1416 and PT is the tricipital fold of the arm [19]. CB is measured with the patient standing up (if he can maintain that position), with the arm relaxed, uncovered and hanging along the side of the body and the palms facing the thighs. It is measured at the midpoint between the acromion of the shoulder and the olecranon of the elbow. This was done with the cercof inextensible tape measure. The PT is measured at the same point using a caliper or plicometer. To do this, the skin fold of the triceps is grasped with the thumb and index finger of the left hand, holding the caliper with the right hand. It must be ensured that the tips of the caliper are not applied to lean tissue. The caliper used in this study was the Holtain plicometer model HOL98610ND.
Laboratory parameters
For the nutritional study, biochemical data were collected from the patient's clinical history. Classical nutritional laboratory parameters such as albumin, pre-albumin, CRP, lymphocytes and transferrin were included. S-albumin was measured by the standard colorimetric method (Roche/Hitachi 904®/Modular ACN413) using the bromocresol green method s-Prealbumin and s-PCR was measured by immunoturbidimetric methods (Roche/Hitachi 904®/Modular P: ACN 218, Roche Diagnostics, Basel, Switzerland) [20].
Statistical Analysis
In the statistical analysis, we performed a Kolmogorov-Smirnov normality test, although we used parametric tests because they have greater statistical power and the sample size allowed it. Continuous variables were analyzed with the t-test for independent samples, showing the result with the mean and standard deviation. Categorical variables, expressed as whole numbers and percentages, were analyzed using chi-square or Fisher's exact test.Factors that may influence the development of frailty and sarcopenia were studied using a multivariate logistic regression model. First, each factor was compared with functional impairment and those factors that were significant or close to significance (p < 0.005) were stepwise logistic regression modelled. All statistical tests were considered bilateral and p-values of less than 0.05 were considered significant. The data was analyzed with the statistical program IBM Corp. Released in 2015. IBM SPSS Statistics for Windows, Version 23.0. Armonk, NY: IBM Corp.
Results
- General characteristics of the patients studied
Of the 225 patients, 148 patients were male (65.8%) and the mean age was higher in the female group, although the difference was not statistically significant. A high percentage of patients (54.7%) had stage 4 kidney disease. DM and nephroangiosclerosis were the main cause of kidney disease. The PEW determined with the inflammatory malnutrition scale presented a mean of 4.56±2.99, being one point higher in women (p=0.110). In the overall body composition, we observed better percentages of body composition parameters related to muscle mass in men and a higher percentage of fat in women. We found no statistically significant difference in nutritional biochemical parameters. Muscle strength was higher in men (p<0.001). Patient characteristics, both overall and differentiating between men and women, are shown in Table 1.
|
|
Overall |
Men |
Women |
p-Value |
|
|
n=225 |
n=148 (65.8%) |
n=77(34.2%) |
|||
|
Age (mean ±SD) |
70.65±11.97 |
69.85±11.16 |
72.19±13.33 |
0.189 |
|
|
ACKD stage n (%) |
Stage 3B |
19 (8.4) |
9 (6.1) |
10 (13) |
0.102 |
|
Stage 4 |
123 (54.7) |
87 (58.8) |
36 (46.8) |
||
|
Stage 5 (ND) |
83 (36.9) |
52 (35.1) |
31 (40.3) |
||
|
Time in ACKD unit n (%) |
< 6 months |
147 (65.3) |
97 (65.5) |
50 (64.9) |
0.75 |
|
6–12 months |
29 (12.9) |
21 (14.2) |
8 (10.4) |
||
|
>12 months |
49 (21.8) |
30 (20.3) |
19 (24.7) |
||
|
DM |
Yes |
98 (43.6) |
73 (49.3) |
25 (32.5) |
0.016 |
|
n (%) |
No |
127 (56.4) |
75 (50.7) |
52 (67.5) |
|
|
MIS (mean±DS/Me) |
4.56±2.99/ 4 |
4.32±2.84 / 4 |
5.02±3.23/4 |
0.11 |
|
|
PA |
4.23±1.09 |
4.20±1.08 |
4.30±1.22 |
0.518 |
|
|
%BCM |
42.19±8.18 |
42.09±7.48 |
42.37±9.43 |
0.809 |
|
|
%TBW |
53.31±7.39 |
55.74±6.44 |
48.64±6.89 |
< 0.001 |
|
|
%IBW |
43.44±7.71 |
43.35±7.10 |
43.61±8.79 |
0.812 |
|
|
%FM |
31.22±9.02 |
28.77±7.65 |
43.61±8.79 |
< 0.001 |
|
|
%FFM |
68.77±9.02 |
71.22±7.65 |
64.05±9.62 |
< 0.001 |
|
|
%MM |
32.79±7.71 |
36.36±6.40 |
25.94±4.88 |
< 0.001 |
|
|
BMI |
27.49±4.941 |
27.62±4.38 |
27.23±5.82 |
0.574 |
|
|
BCMI |
7.90±201 |
8.24±1.94 |
7.26±1.99 |
< 0.001 |
|
|
ASMM |
19.02±4.74 |
21.32±3.90 |
14.58±2.53 |
< 0.001 |
|
|
MAMC |
28.01±4.93 |
28.20±4.97 |
27.66±4.89 |
0.437 |
|
|
Alb |
4.21±0.41 |
4.20±0.44 |
4.23±0.35 |
0.71 |
|
|
Prealb |
27.87±7.74 |
28.64±8.17 |
26.37±6.64 |
0.051 |
|
|
CRP |
0.70±1.40 |
0.68±1.14 |
0.73±1.81 |
0.793 |
|
|
HB |
12.24±1.54 |
12.21±1.59 |
13.31±1.45 |
0.663 |
|
|
Transf |
219.85±51.57 |
218.83±50.07 |
221.90±54.75 |
0.679 |
|
|
CKDEPI |
18.79±7.61 |
18.50±7.08 |
19.34±8.55 |
0.436 |
|
|
HGS-R |
26.44±10.60 |
30.83±9.50 |
18.00±6.84 |
< 0.001 |
|
|
SPPB (mean±DS / Me) |
8.50±2.81 / 9 |
8.88±2.49 / 9 |
7.77±3.23 / 8 |
0.005 |
|
|
SPPB < 8 (n/%) |
53 (23.6) |
25 (19.9) |
28 (36.4) |
0.001 |
|
|
SPPB ≥ 8 (n/%) |
172 (76.4) |
123 (83.1) |
49 (63.6) |
||
Table 1: General characteristics of the study population.*p < 0.05 (Sig.); men vs women.Abbreviations: SD = standard deviation; ND = no diálisis, ACKD = advanced chronic kidney disease; DM = diabetes mellitus; Me = Median; PA = Phase angle; BCM = Body Cell Mass; TBW = Total Body Water; IBW = Intracellular Body Water; FM = Fat Mass; FFM = Fat Free Mass; MM = Muscle Mass; BMI = Body mass Index; BCMI = Body Cell Mass Index; ASMM = Apendicullar Skeletal Muscle Mass; MAMC= Midupper Arm Circumference, Alb = Albumin, Prealb = Prealbumin; CRP = C-reactive protein; HB = Hemoglobin; Tranf = Transferrin; HGS-R = Handgrip strenght Right; SPPB = Short physical performance battery test.
Frailty and sarcopenia
The percentages of PEW, frailty and sarcopenia are shown in Table 2. We analysed the result of PEW in two groups, establishing as cut-off points 2 and 5. In the MIS scale, the PEW was 71.6% when establishing as cut-off point 2 and 31.6% if it is 5. It was observed a higher percentage of women with PEW in both groups, although this difference was not statistically significant (p=0.224). The prevalence of frailty was 17.8%. When differentiating between men and women, the comparison between frail, pre-frail and non-frail did not reach significance (p=0.062). Nevertheless, when grouping patients into two groups instead of three by combining the groups of non-frail and pre-frail patients, the difference between men and women was statistically significant (p=0.020). The prevalence of sarcopenia was 29.3%, being severe in 17.8%. Percentages between men and women were not statistically significant, although, as with PEW, women had a higher percentage of both frailty and sarcopenia (and severe sarcopenia). The presence of both syndromes (frailty and sarcopenia) was 10.2%, being higher in the female group.
|
|
Overall |
Men |
Women |
p-Value |
|
|
MIS > 2 |
161 (71.6) |
102 (68.9) |
59 (76.6) |
0.224 |
|
|
MIS > 5 |
71 (31.6) |
44 (29.7) |
27 (35.1) |
0.414 |
|
|
Frailty |
Not frail |
92 (40.9) |
65 (43.9) |
27 (35.1) |
0.062 |
|
Pre frail |
93 (41.3) |
63 (42.6) |
30 (39) |
||
|
Frail |
40 (17.8) |
20 (13.5) |
20 (26%) |
||
|
Not frail + Prefrail |
185 (82.2) |
128 (86.5) |
57 (74) |
0.02 |
|
|
Sarcopenia |
No sarcopenia: no dynapenia |
127 (56.4) |
87 (58.8) |
40 (51.9) |
0.418 |
|
Dynapenia no Sarcopenia |
32 (14.2) |
19 (12.8) |
13 (16.9) |
||
|
Sarcopenia confirmed |
66 (29.3) |
42 (28.4) |
24 (31.2) |
||
|
Sarcopenia severe |
40 (17.8) |
23 (15.5) |
17 (22.1) |
||
|
Fraility + Sarcopenia |
23 (10.2) |
14 (9.5) |
9 (11.7) |
0.601 |
|
Table 2: Percentages of Frailty and Sarcopenia in the sample.*p < 0.05 (Sig.); men vs women. Abbreviations: MIS = Manutrition Inflamation Score.
The mean age was higher in those patients with PEW. The differences in the male group in MIS 2 were p=0.003 and p < 0.001 in females and in MIS 5 in males was p=0.008 and p=0.045 in females. The mean age was higher in patients with frailty and sarcopenia and in those with both syndromes. Despite this, age was not statistically significant between men and women (p=601) (Table 3).
|
|
Overall |
*p-Value |
Men |
Women |
**p-Value |
|
MIS ≤ 2 |
64.84±11.53 |
< 0.001 |
65.89±11.54 |
62.16±11.37 |
< 0.001 |
|
MIS >2 |
72.96±11.38 |
62.16±11.37 |
75.25±12.42 |
||
|
MIS ≤ 5 |
68.81±12.21 |
< 0.001 |
68.26±11.49 |
69.96±13.63 |
< 0.001 |
|
MIS <5 |
74.63±10.46 |
73.59±9.44 |
76.33±11.92 |
||
|
No Frailty |
68.57±11.80 |
< 0.001 |
68.39±10.99 |
69.00±13.55 |
< 0.001 |
|
Frailty |
80.25±7.14 |
79.20±7.08 |
81.30±7.23 |
||
|
No Sarc. |
67.30±12.13 |
< 0.001 |
66.80±11.22 |
68.30±13.85 |
< 0.001 |
|
Sarc. |
78.71±6.54 |
77.54±6.32 |
80.75±6.32 |
||
|
No Frailty-Sarc |
69.43±11.90 |
< 0.001 |
68.76±11.05 |
70.73±13.42 |
< 0.001 |
|
Frailty-Sarc |
81.39±5.55 |
80.21±5.64 |
83.22±5.19 |
Table 3: Mean age at PEW, frailty and sarcopenia by sex. **p < 0.05 (Sig.); MIS ≤ 2 vs MIS >2; MIS ≤ 5 vs MIS >5; No frailty vs Frailyty; No sacr vs sarc; no frailty-sarc vs Frailty – sarc. *p < 0.05 (Sig.); men vs women; Abbreviation: Sarc = sarcopenia.
Table 4 shows the percentage of patients with frailty and sarcopenia, both overall and differentiated by sex.
In the group of non-sarcopenic patients, 89% did not present frailty. In the group of patients with confirmed sarcopenia, the percentage of frailty increased from 10.7% (non-sarcopenic) to 34.8%. In this group, no woman was non-fragile. In the group with severe sarcopenia, we found no non-fragile patients, the percentage of fragile patients being 52.5%. We only found a significant difference between men and women in the group of non-sarcopenic patients, finding a higher percentage of frailty in the group of women in non-sarcopenic patients but a higher percentage in confirmed and severe sarcopenia, although this difference was not statistically significant. The table shows the results by group, but if we look at the overall results of the 225 patients, we obtain that 10.22% of the patients presented sarcopenia and frailty (6.2% men and 4% women) and 9.33% severe sarcopenia and frailty (5.3% men and 4% women).
|
|
|
Overall |
Men |
Women |
*p-Value |
|
No Sarcopenia |
No frail |
90 (56.6) |
63 (70) |
27 (30) |
0.015 |
|
n=159 |
Prefrail |
52 (32.7) |
37 (71.2) |
15 (28.8) |
|
|
|
Frail |
17 (10.7) |
6 (35.3) |
11 (64.7) |
|
|
|
No fragile + Prefrail |
142 (89.3) |
100 (70.4) |
42 (29.6) |
0.004 |
|
Confirmed Sarcopenia |
Non frail |
2 (3) |
2 (100) |
0 |
0.808 |
|
n=66 |
Prefrail |
41 (62.1) |
26 (63.4) |
15 (36.6) |
|
|
|
Frail |
23 (34.8) |
14 (60.9) |
9 (39.1) |
|
|
|
Non-frail + Prefrail |
43 (65.2) |
28 (65.1) |
15 (34.9) |
0.733 |
|
Severe |
Non-frail |
---- |
----- |
----- |
---- |
|
Sarcopenia |
Prefrail |
19 (47.5) |
11 (57.9) |
8 (42.1) |
0.962 |
|
n=40 |
Frágiles |
21 (52.5) |
12 (57.1) |
9 (42.9) |
|
|
|
Non-frail + Prefrail |
19 (47.5) |
11 (57.9) |
8 (42.1) |
0.962 |
Table 4: Percentages of frailty and sarcopenia in the sample according to sex. *p < 0.05 (Sig.); men vs women.
In multivariate logistic regression analysis, the risk factors observed for frailty and sarcopenia as a combined syndrome were age and high CRP values (i.e. inflammation). A higher intracellular water percentage and a higher arm muscle circumference decreased the risk (Table 5).
|
Sarcopenia |
||||||
|
|
Model 1 |
Model 2 |
||||
|
|
RR (95% CI) |
p-Value |
RR (95% CI) |
p-Value |
||
|
Age |
1.165 (1.107-1.226) |
< 0.001 |
--- |
--- |
||
|
MIS |
0.840 (0.727-0.970) |
0.018 |
--- |
--- |
||
|
BMI |
0.787 (0.706-0.877) |
< 0.001 |
--- |
--- |
||
|
PCR |
1.487 (1.150-1.924) |
0.003 |
1.280 (1.012-1.618) |
0.039 |
||
|
PA |
--- |
--- |
0.671 (0.471-0.957) |
0.028 |
||
|
ASMM |
--- |
--- |
0.638 (0.546-0.746) |
< 0.001 |
||
|
SEX (men) |
|
|
13.290 (4.223-41.829) |
< 0.001 |
||
|
Frailty |
||||||
|
|
Model 1 |
Model 2 |
||||
|
|
RR (95% CI) |
p-Value |
RR (95% CI) |
p-Value |
||
|
Age |
1.178 (1.090-1.274) |
< 0.001 |
--- |
--- |
||
|
NPNA |
0.054 (0.003-0.937) |
0.045 |
--- |
--- |
||
|
Prealb |
0.896 (0.826-0.972) |
0.008 |
0.922 (0.859-0.988) |
0.022 |
||
|
%BCM |
--- |
--- |
0.919 (0.865-0.976) |
0.006 |
||
|
ASMM |
--- |
--- |
0.855 (0.759-0.964) |
0.01 |
||
|
Frailty + Sarcopenia |
||||||
|
Model |
||||||
|
|
RR (95% CI) |
p-Value |
||||
|
Age |
1.141 (1.063-1.225) |
< 0.001 |
||||
|
PCR |
1.352 (1.024-1.784) |
0.033 |
||||
|
MAMC |
0.89 (0.805-0.984) |
0.023 |
||||
|
%IBW |
0.934 (0.873-0.999) |
0.049 |
||||
Table 5: Multivariate logistic regression. Abbreviations: HR = relative risk; CI = confidence interval; CRP = C-reactive protein; IBW = intracellular body wáter, MAMC= Midupper Arm Circumference.
Discussion
It is important to include the assessment of both frailty and sarcopenia in CKD patients in routine clinical practice. Both have a high incidence in this type of patient, as they present it in a higher proportion than the general population and increase the complications already present in CKD [21]. Normally, the percentage of frailty is higher than sarcopenia, as there may be fragile patients who are not sarcopenic. However, sarcopenia will lead to frailty. In our results, we observed that the percentage of sarcopenia was higher than that of frailty, while if we compare severe sarcopenia with frailty, the percentage was the same. All patients with severe sarcopenia were either prefrail or frail. When combining both syndromes, we observed that they coexist, although in a lower percentage than separately. We observed a higher percentage of frail and sarcopenic women. However, when analyzing the result as a whole (sarcopenia and fragility), the percentage of men was higher. More than 50% had neither sarcopenia nor frailty, which is consistent with the fact that a high percentage of patients had good functional capacity as determined by the SPPB test (76.4% had a score ≥7 or mild limitations). This test was also used as a measure to determine frailty, establishing a score ≤8 as the cut-off point [22], which would explain this high percentage of patients without frailty or sarcopenia. In the review by Otobe et al. in 2022, they compiled studies on frailty and sarcopenia in patients with ACKD and HD. In the different studies, they observed higher percentages of frailty than sarcopenia, finding percentages of frailty above 30%, especially in patients with filtration rates < 30ml/min/1.73m2, while the percentage of sarcopenia varied depending on age or the criteria studied, being around 20% [23]. It is, therefore, important to consider the type of criteria to be used for the diagnosis of sarcopenia, as the prevalence could vary depending on the criteria used. In 2017 Souza et al. [24] studied the prevalence of sarcopenia in patients with ACKD stages 3b, 4 and 5 - non-dialysis. They observed a difference in the percentage of sarcopenia of 11.9% when using the criteria of the European sarcopenia group, to 28. 7% when using the Foundation for the National Institutes of Health Sarcopenia Project (FNIH) criteria. In this study, as in our results, they found a higher prevalence in older age and in the female group.
In the 2015 study by Pereira et al. [25], they compared three methods or ways of determining sarcopenia in patients with stage 3-5 CKD:
- Method 1: muscle strength and decrease in arm muscle circumference
- Method 2: muscle strength and subjective global assessment
- Method 3: muscle strength and decrease in muscle mass
They found a higher prevalence with the first two methods, 9% and a smaller one with the third, 5%. This variety in the results, depending on the criterion or method used, highlights the need to use the same methodology worldwide in order to homogenise results. Until now, most studies have been conducted in HD, but recently, studies of frailty in ACKD are increasing. This is important because frailty increases as renal disease and age progresses [26]. It is important that patients with ACKD are in the best condition, as this will mean a better quality of life, fewer complications and a reduced risk of mortality in the first months of RRT once renal replacement therapy is started [27].
Different studies show a high prevalence of frailty in elderly patients with ACKD. In the study by Ali et al. of 2018 [28], they found a prevalence of 56%, being higher in men and in patients aged ≥65 years. In the study by Vettoretti et al. of 2020 [29] they found a prevalence of 45%. In this study they assessed functional capacity with the SPPB test, obtaining a score of 9.3±1.8 in the non-fragile and 5.2±2.2 points in the fragile.
In CKD, multiple factors will influence the prevalence of both frailty and Sarcopenia, such as age, disease stage, depression, nutritional status and physical exercise, among others [30]. We observed that both body composition and inflammatory nutritional status are factors that influence both frailty and Sarcopenia. This fact is highlighted by Vettoretti et al. in their 2019 study [31], in which they evaluated the prevalence of major sarcopenia in malnourished patients. In this study, they also found that 63% of patients with sarcopenia also presented frailty criteria. This represents a higher percentage than what we observed in our study, which was 34.8% for sarcopenia and frailty and 52. 5% for severe Sarcopenia and frailty. Similarly, in the study by Vettoretti S et al. in 2020 [32], they observed a higher percentage of patients with frailty in those who also presented malnutrition. Age, progression of renal disease, comorbidity, nutritional status, body composition, physical exercise, etc., are all factors that will influence the prevalence of frailty and sarcopenia. Therefore, monitoring is necessary in order to halt or modify their evolution [33]. Within the nutritional strategies, in addition to adjusting and individualizing nutritional recommendations, the use of oral nutritional supplementation may be necessary. This may include proteins, calcium, vitamin D, Branched-Chain Amino Acids (BCAA), leucine, or its derivative Hydroxy Methyl Butyrate (HMB) [34]. These nutritional strategies must be accompanied by individualized physical activity programs. They should include both cardiovascular exercise and strength training with the aim of increasing muscle mass, strength and functionality and improving motor function [35].
Conclusion
Frailty and Sarcopenia are two prevalent syndromes in CKD and it is necessary to standardise their assessment in order to establish preventive treatment strategies for these patients. Evaluation and follow-up in ACKD consultation, as well as including information protocols on healthy lifestyle habits (diet and exercise) in regular clinical practice, can help reduce the percentage of frailty and Sarcopenia.
Author’s Contribution
Á.N, G.B. are a multidisciplinary team of ACKD Unit that has developed the monitoring of nutritional care. Á.N. and G.B. developed the design, methodology and planning of statistical analysis. Investigation: G.B. and P.A. participated as investigators in the review of medical records by entering data into the database. Á.N. and P.A. wrote the draft manuscript. All authors have read and agreed to the published version of the manuscript.
Funding
This research received no external funding.
Conflicts of Interest
The authors declare no conflict of interest.
References
- Dopsaj M, Kukic F, Dordevic-Nikic M, Koropanovski N, Radovanovic D, et al. (2020) Indicators of Absolute and Relative Changes in Skeletal Muscle Mass during Adulthood and Ageing. Int J Environ Res Public Health 17: 5977.
- Morley JE, Vellas B, van Kan GA, Anker SD, Bauer JM, et al. (2013) Frailty consensus: a call to action. J Am Med Dir Assoc 14: 392-397.
- Panhwar YN, Naghdy F, Naghdy G, Stirling D, Potter J (2019) Assessment of frailty: a survey of quantitative and clinical methods. BMC Biomed Eng 1: 7.
- Fried LP, Tangen CM, Walston J, Newman AB, Hirsch C, et al. (2001) Frailty in older adults: evidence for a phenotype. J Gerontol A Biol Sci Med Sci 56: M146-M156.
- Martínez-Reig M, Flores Ruano T, Fernández Sánchez M, Noguerón García A, Romero Rizos L, et al. (2016) Fragilidad como predictor de mortalidad, discapacidad incidente y hospitalización a largo plazo en ancianos españoles. Estudio FRADEA [Frailty and long term mortality, disability and hospitalisation in Spanish older adults. The FRADEA Study]. Rev Esp Geriatr Gerontol 51: 254-259.
- Rosenberg IH (1997) Sarcopenia: origins and clinical relevance. J Nutr 127: 990S-991S.
- Cruz-Jentoft AJ, Baeyens JP, Bauer JM, Boirie Y, Cederholm T, et al. (2010) Sarcopenia: European consensus on definition and diagnosis: Report of the European Working Group on Sarcopenia in Older People. Age Ageing 39: 412-423.
- Cruz-Jentoft AJ, Bahat G, Bauer J, Boirie Y, Bruyère O, et al. (2019) Sarcopenia: revised European consensus on definition and diagnosis. Age Ageing 48: 16-31.
- Dennison EM, Sayer AA, Cooper C (2017) Epidemiology of sarcopenia and insight into possible therapeutic targets. Nat Rev Rheumatol 13: 340-347.
- Sabatino A, Cuppari L, Stenvinkel P, Lindholm B, Avesani CM (2020) Sarcopenia in chronic kidney disease: what have we learned so far? J Nephrol 34: 1347-1372.
- Fouque D, Kalantar-Zadeh K, Kopple J, Cano N, Chauveau P, et al. (2008) A proposed nomenclature and diagnostic criteria for protein-energy wasting in acute and chronic kidney disease. Kidney Int 73: 391-398.
- Hanna RM, Ghobry L, Wassef O, Rhee CM, Kalantar-Zadeh K (2020) A Practical Approach to Nutrition, Protein-Energy Wasting, Sarcopenia and Cachexia in Patients with Chronic Kidney Disease. Blood Purif 49: 202-211.
- Kalantar-Zadeh K, Kopple JD, Block G, Humphreys MH (2001) A malnutrition-inflammation score is correlated with morbidity and mortality in maintenance hemodialysis patients. Am J Kidney Dis 38: 1251-1263.
- Jagadeswaran D, Indhumathi E, Hemamalini AJ, Sivakumar V, Soundararajan P, et al. (2019) Inflammation and nutritional status assessment by malnutrition inflammation score and its outcome in predialysis chronic kidney disease patients. Clin Nutr 38: 341-347.
- Fried LP, Tangen CM, Walston J, Newman AB, Hirsch C, et al. (2001) Frailty in older adults: Evidence for a phenotype. J Gerontol A Biol Sci Med Sci 56: M146-M156.
- Leal VO, Mafra D, Fouque D, Anjos LA (2011) Use of handgrip strength in the assessment of the muscle function of chronic kidney disease patients on dialysis: a systematic review. Nephrol Dial Transplant 26: 1354-1360.
- Guralnik JM, Simonsick EM, Ferrucci L, Glynn RJ, Berkman LF, et al. (1994) A short physical performance battery assessing lower extremity function: association with self-reported disability and prediction of mortality and nursing home admission. J Gerontol 49: M85-M94.
- Leyva, Lidyce Q, Ramentol L, Cecilia C, Bethencourt B, et al. (2016) Elementos teóricos y prácticos sobre la bioimpedancia eléctrica en salud. Revista Archivo Médico de Camagüey 20: 565-578.
- Yallamraju SR, Mehrotra R, Sinha A, Gattumeedhi SR, Gupta A, et al. (2014) Use of mid upper arm circumference for evaluation of nutritional status of OSMF patients. J Int Soc Prev Community Dent 4: S122-S125.
- McGinlay JM, Payne RB (1988) Serum albumin by dye-binding: Bromocresol green or bromocresol purple?.The case for conservatism. Ann Clin Biochem 25: 417-421.
- Kennard A, Glasgow N, Rainsford S, Talaulikar G (2023) Frailty in chronic kidney disease: challenges in nephrology practice. A review of the current literature Intern Med J 5: 465-472.
- Jung HW, Baek JY, Jang IY, Guralnik JM, Rockwood K, et al. (2021) Short Physical Performance Battery as a Crosswalk Between Frailty Phenotype and Deficit Accumulation Frailty Index. J Gerontol A Biol Sci Med Sci 76: 2249-2255.
- Otobe Y, Rhee CM, Nguyen M, Kalantar-Zadeh K, Kopple JD (2022) Current status of the assessment of sarcopenia, frailty, physical performance and functional status in chronic kidney disease patients. Curr Opin Nephrol Hypertens 31: 109-128.
- Souza VA, Oliveira D, Barbosa SR, Corrêa JODA, Colugnati FAB, et al. (2017) Sarcopenia in patients with chronic kidney disease not yet on dialysis: Analysis of the prevalence and associated factors. PLoS One 12: e0176230.
- Raíssa A Pereira, Antonio C Cordeiro, Carla M Avesani, Juan J Carrero, Bengt Lindholm, et al. (2015) Sarcopenia in chronic kidney disease on conservative therapy: prevalence and association with mortality. Nephrol Dial Transplant 30: 1718-1725.
- Ozturk S, Cetin DG, Cetin M, Yilmaz MD, Ozler TE, et al. (2022) Prevalence and Associates of Frailty Status in Different Stages of Chronic Kidney Disease: A Cross-Sectional Study. J Nutr Health Aging 26: 889-895.
- Painter P, Marcus RL (2013) Assessing physical function and physical activity in patients with CKD. Clin J Am Soc Nephrol 8: 861-872.
- Ali H, Abdelaziz T, Abdelaal F, Baharani J (2018) Assessment of prevalence and clinical outcome of frailty in an elderly predialysis cohort using simple tools. Saudi J Kidney Dis Transpl 29: 63-70.
- Vettoretti S, Caldiroli L, Porata G, Vezza C, Cesari M, et al. (2020) Frailty phenotype and multi-domain impairments in older patients with chronic kidney disease. BMC Geriatr 20: 371.
- Chang J, Hou W, Li Y, Li S, Zhao K, et al. (2022) Prevalence and associated factors of cognitive frailty in older patients with chronic kidney disease: a cross-sectional study. BMC Geriatr 22: 681.
- Vettoretti S, Caldiroli L, Armelloni S, Ferrari C, Cesari M, et al. (2019) Sarcopenia is Associated with Malnutrition but Not with Systemic Inflammation in Older Persons with Advanced CKD. Nutrients 11: 1378.
- Vettoretti S, Caldiroli L, Porata G, Vezza C, Cesari M, et al. (2020) Frailty phenotype and multi-domain impairments in older patients with chronic kidney disease. BMC Geriatr 20: 371.
- Wong L, Duque G, McMahon LP, (2021) Sarcopenia and Frailty: Challenges in Mainstream Nephrology Practice. Kidney Int Rep 6: 2554-2564.
- Everink IHJ, Grund S, Benzinger P, de Vries A, Gordon AL, et al. (2023) Nutritional Care Practices in Geriatric Rehabilitation Facilities across Europe: A Cross-Sectional Study. J Clin Med 12: 2918.
- Colleluori G, Villareal DT (2021) Aging, obesity, sarcopenia and the effect of diet and exercise intervention. Exp Gerontol 155: 111561.
Citation: Nogueira Pérez A, López-Alvarado PR, Barril Cuadrado G (2024) Prevalence of Frailty and Sarcopenia and their Coexistence in Patients with advanced Chronic Kidney Disease. J Nephrol Renal Ther 10: 092.
Copyright: © 2024 Ángel Nogueira Pérez, et al. This is an open-access article distributed under the terms of the Creative Commons Attribution License, which permits unrestricted use, distribution, and reproduction in any medium, provided the original author and source are credited.