Prognostic Value of Platelet-To-Lymphocyte Ratio in Oncologic Outcomes of Gastric Cancers: What Should We Expect from a Meta-Analysis?
*Corresponding Author(s):
Wei-Hong KuangThe Second Clinical Medicine College, Guangdong Medical University, Dongguan, Guangdong, China
Tel:020-39358480,
Email:kuangwh@gdmu.edu.cn
Abstract
Background: Platelet to lymphocyte ratio (PLR) was observed to be a marker of poor prognosis in patients with Gastric Neoplasm. However, the PLR prognostic role in Gastric Neoplasm is still inconsonant. The goal of this analysis was to understand the relation between PLR and outcomes in patients with Gastric Neoplasm by meta-analysis.
Methods: Interrelated literatures were retrieved from EMBASE, web of science, PubMed, Ovid and Cochrane library databases. Risk ratio (HR) and 95% confidence interval (CIs) were used as performance indicators for meta-analysis. Altogether 14,052 patients in 29 articles contained in the meta-analysis last. Outcomes were analyzed using random effect methodology, regression analysis, and sensitivity analyses.
Results: The summary outcomes displayed that the increase of PLR was significantly related to the decrease of OS (HR: 1.526, 95% CI: 1.268-1. 836, p^0.001) in patients with Gastric Neoplasm and OS (HR: 1.01, 95% CI: 1.00–1.02, p = 0.000) in patients with Gastric Neoplasm. Subgroup analysis showed that a higher PLR values significantly indicated worse OS in Asian human populations, patients at early stage, sample size > 200 and patients receiving chemotherapy. Sensitivity analysis reveal the stabilization of our consequence. The results of regression analysis of sample size display that the sample size was related to heterogeneity. The adjusted random effects pooled HRs which method of the trim-and-fill showed a statistically significant relation of OS and PLR level.
Conclusions: This meta-analysis findings revealed that elevated PLR probably indicates poor prognosis for the patients of Gastric Neoplasm.
Keywords
Gastric Neoplasm; Meta-analysis; PLR; Prognosis
ABBREVIATIONS
CI: Confidence Interval; GN: Gastric Neoplasm; HR: Risk Ratio; LVI: Lymphatic Vessels Invasion; NLR: Neutrophil to Lymphocyte Ratio; NOS: Newcastle-Ottawa Scale; OS: Overall Survival; PLR: Platelet to Lymphocyte Ratio; VPI: Visceral Pleural Invasion
BACKGROUND
As the fourth most pervasive malignant illness and the second reason of cancer-related mortalities worldwide, Gastric Neoplasm (GN) have an overall poor survival [1,2]. Surgery is the only possible way to achieve results in radical gastrectomy. According to the pathological type and clinical stage of Gastric Neoplasm in advanced patients, a biologic target therapy method combining perioperative chemotherapy, radiotherapy and comprehensive treatment should be developed. Since excess treatment can extend survival time of 10-20% of cancer patients with partial or holistic progression, it is urgent to distinguish high-stake patients with worse prognosis so that new stronger programs can be initiated as early as possible to improve survival [3].
Previous studies have determined that the stage, large tumor size, presence of lymphatic vessels (LVI) or visceral pleural invasion (VPI) and other clinicopathological features are the characteristics of worse prognosis in early GN [4-6]. However, the current staging system for GN is insufficient for indicating the outcome of treatment and reflecting the underlying biological heterogeneity of the results. Except for TNM staging, other factors can only be assessed after surgery [7]. Therefore, it is of major implications to study non-invasive and readily available preconditioning variables to assess survival outcomes for Gastric Neoplasm. A growing body of evidence shows that the inflammatory response may contain a momentous part in the progress of tumors [8-11]. Inflammation factors, such as C-Reactive Protein Neutrophil to Lymphocyte Ratio (NLR), Platelet to Lymphocyte Ratio (PLR), and Glasgow Prognostic Score have assessed in multitudinous types of tumors [12-16]. PLR as an indicate of systemic inflammation was linked to worse prognostic for multifarious caners including ovarian cancer, carcinoma of the lungs, and Lower gastrointestinal carcinoma and so on [17-20].
Recent researches have shown that PLR has potential prognostic effects in sick people with GN. However, In the light of their findings, there are still inconsistencies regarding the role of PLR in the prognosis of GN. Meta-analysis can surmount the limitations of disparate sample sizes in unit research to produce optimal estimates. So, it is especially important to explore the prognostic function of PLR comprehensively and systematically in Gastric Neoplasm by meta-analysis. In this research, our objective is to predictive the possible prognostic function of pretreatment PLR in GN by write a meta-analysis of all qualified published articles.
METHODS
Search strategy
We conducted an integrated search of the literature without date limitation as show below: Web of Science, PubMed, The Cochrane Library, Embase, Scopus, and Ovid databases. All the literatures were updated to May 31, 2020. The main search terms used to generate the search strategy included: “Stomach Neoplasms” (e.g., “Gastric Neoplasm”, “Cancer of Stomach”, “Gastric Neoplasm,” “Stomach Cancers” and “Gastric Neoplasm”) and “PLR” (e.g., “Platelet ratio of lymphocyte" and "platelet-lymphocyte ratio"). The reference of all enrolled articles was examined for correlation articles.
Inclusion and exclusion criteria
In this meta-analysis, articles were choose based on the major inclusion criteria as show below:
(1) The diagnosis of Gastric Neoplasm was definite by preoperative biopsy or postoperative pathological examination.
(2) Serum based methods was used to quantify PLR.
(3) The PLR and overall survival (OS) were correlation.
The general exclusion criteria for our study were as show below:
(1) case reports, letters, abstracts, review articles, or nonclinical research.
(2) Articles were limited to those written in English;
(3) Articles was simply not enough data for 95% confidence interval (CI) and estimating hazard ratio (HR);
(4) Articles with duplicate analysis or repeat data reported in other studies.
Data extraction and quality assessment
All candidate articles were carefully screened independently by two authors. The articles, which may not be categorized based on titles and abstracts were evaluated full-text search. When occurred the controversy, agreement was attained in discussion with a third author. For each article, Evaluation items were as follows: the first author’s name, total number of cases, publication year, region, gender, cut-off value, follow ups, tumor type, treatment strategy, HRs with 95% Cis and study design. The Newcastle-Ottawa Scale (NOS) was used to evaluate the quality of the included articles independently by two reviewers. Studies with NOS scores ≥6 was assigned for high-grade articles.
Statistical analysis
The HR and 95%CI directly obtained from each article. If HR^1, it represents that GN patients with elevator PLR expression have a poor prognosis. Higgins I-squared and Cochran’s Q test statistic were used to evaluate the heterogeneity among the enrolled trials. Sensitivity analysis was used for assessing risk of bias of individual studies. Pooled HRs, 95% CIs, and p-values were generated employing both fixed-effects (Mantel–Haenszel method) and random effects (DerSimonian–Laird method) models. A random-effects model was used for significant heterogeneity and a fixed-effects model for insignificant heterogeneity. Sources of heterogeneity were explored and explained by subgroup analysis, sensitivity analysis and meta-regression among the outcomes of different articles. Potential Publication bias was evaluated by Egger’s tests and Begg funnel plot, with p^0.05 indicating significant asymmetry. All Statistical Hypothesis Testing were two-sided and values of p ^ 0.05 were identified as statistically significant. All the statistical calculations and analyses were done with STATA statistical software version 12. 0 (Texas State University, USA).
RESULTS
Study characteristics
Altogether 519 studies were obtained from the originally search strategies. 29 articles published between 2009 and 2020 with in all 14, 052 patients were ultimately drawn in our meta-analysis [21-49]. We have summarized the study selection process in a flow diagram (Figure 1). The majority of participants were Asian (69%) and others (31%) were Caucasian. Eleven articles were from China, four articles were from Japan, three articles were done in Korea and USA, respectively, two in UK, one in Singapore, Jordan and Turkey, respectively. All HRs and 95% CIs were founded directly in original articles. Nine of these articles enrolled ^200 patients and about 20 articles had more than 200 patients. And the cut-off values of PLR were not consistent across included articles which varied from 80 to 200. This meta-analysis included patients at all stages of disease. Sufficient information of OS and PLR in patients with GN was offered in all of the 29 articles. Studies characteristics are summarized in Table 1. Figure 1 shows a flow chart of the search results and the number of studies contained in this meta-analysis.
|
Author |
Year |
Study region |
Ethnicity |
Sample size |
Follow up (months) |
Treatment |
Median age |
Cut off |
Outcome |
Stage |
HR |
NOS score |
|
|
Weipeng Gong |
2017 |
China |
Asian |
111 |
22 |
chemotherapy |
60.00 |
161 |
OS |
Whole |
R(M) |
6 |
|
|
WuLian Lian G |
2015 |
China |
Asian |
162 |
60 |
Surgery |
56.30 |
208 |
OS |
Whole |
R(U) |
7 |
|
|
Ella Grilz |
2018 |
Vienna |
Caucasian |
1,469 |
24 |
Combined |
61.00 |
264 |
OS |
Whole |
R(M) |
7 |
|
|
Brian K. |
2015 |
Singapore |
Asian |
312 |
43.5 |
Surgery |
62.50 |
275 |
OS |
Early |
P(U) |
7 |
|
|
Li-xiang Zhang |
2018 |
China |
Asian |
904 |
60 |
Combined |
60.00 |
160 |
OS |
Whole |
R(M) |
7 |
|
|
Ma X |
2019 |
China |
Asian |
119 |
75 |
Combined |
61.00 |
160 |
OS |
Whole |
R(M) |
8 |
|
|
Wenyang Pang |
2015 |
China |
Asian |
492 |
60 |
Combined |
63.00 |
155.67 |
OS |
Whole |
R(U) |
6 |
|
|
Masayuki Urabe |
2017 |
Japan |
Asian |
2054 |
63.3 |
Surgery |
64.00 |
150.6 |
OS |
Whole |
R(M) |
8 |
|
|
Takahiro Toyokawa |
2018 |
Japan |
Asian |
240 |
100.5 |
Combined |
64.50 |
188 |
OS |
Advanced |
R(M) |
6 |
|
|
Shubin Song |
2016 |
China |
Asian |
1,990 |
37 |
Surgery |
62.00 |
139.12 |
OS |
Whole |
R(M) |
8 |
|
|
Osama Abu-Shawer |
2019 |
Jordan |
Asian |
502 |
150 |
Combined |
54.00 |
150 |
OS |
Whole |
R(M) |
7 |
|
|
Fuentes H. E |
2017 |
United States |
Caucasian |
112 |
21.3 |
chemotherapy |
58.00 |
150 |
OS |
Whole |
R(M) |
6 |
|
|
Yoonjoo Lee, MD |
2016 |
Korea |
Asian |
312 |
1.5 |
Combined |
65.00 |
200 |
OS |
Early |
R(M) |
5 |
|
|
Ali Guner, MD |
2018 |
Korea |
Asian |
1032 |
12 |
Surgery |
60.00 |
124.71 |
OS |
Whole |
P(U) |
6 |
|
|
Yuka Ohe |
2020 |
Japan |
Asian |
41 |
60 |
Combined |
65.00 |
180 |
OS |
Advanced |
R(M) |
7 |
|
|
Jennifer M |
2014 |
Canada |
Caucasian |
93 |
39.1 |
Surgery |
61.25 |
245.2 |
OS |
Whole |
P(U) |
6 |
|
|
Xiaowei Sun |
2016 |
China |
Asian |
305 |
24 |
Combined |
57.00 |
120 |
OS |
Whole |
R(U) |
8 |
|
|
Jin Wang |
2018 |
China |
Asian |
273 |
6 |
chemotherapy |
57.00 |
150 |
OS |
Advanced |
R(U) |
6 |
|
|
Suee Lee |
2013 |
Korea |
Asian |
174 |
14.9 |
chemotherapy |
60.00 |
160 |
OS |
Whole |
R(M) |
6 |
|
|
Guanghui Zhao |
2020 |
China |
Asian |
110 |
11.6 |
chemotherapy |
65.00 |
143.39 |
OS |
Advanced |
R(M) |
6 |
|
|
Qing Wang |
2014 |
China |
Asian |
439 |
40 |
Surgery |
50.00 |
160 |
OS |
Advanced |
R(M) |
7 |
|
|
V. P. Jagadesham |
2016 |
UK |
Caucasian |
199 |
48 |
Combined |
63.00 |
125.3 |
OS |
Advanced |
R(M) |
6 |
|
|
Mehmet Aliustaoglu |
2009 |
Turkey |
Caucasian |
168 |
45 |
chemotherapy |
60.10 |
160 |
OS |
Advanced |
R(U) |
6 |
|
|
Xin Zhou |
2016 |
China |
Asian |
451 |
37.7 |
Combined |
60.00 |
142.5 |
OS |
Whole |
R(U) |
6 |
|
|
Manikhas G.M |
2017 |
United States |
Caucasian |
32 |
chemotherapy |
60.00 |
245.9 |
OS |
Whole |
R(M) |
6 |
||
|
Nan Jiang |
2014 |
China |
Asian |
850 |
42 |
Combined |
64.00 |
184 |
OS |
Whole |
P(M) |
6 |
|
|
Jiaxin Wen |
2018 |
UK |
Caucasian |
723 |
10 |
Combined |
66.00 |
OS |
Advanced |
P(U) |
6 |
||
|
KENJI MIMATSU |
2017 |
Japan |
Asian |
271 |
Combined |
68.00 |
150 |
OS |
Advanced |
R(U) |
6 |
||
|
Harry E. Fuentes |
2017 |
USA |
Caucasian |
112 |
21.3 |
Combined |
58.00 |
260 |
OS |
Advanced |
R(M) |
7 |
|
OS: Overall Survival; HR: Hazard Ratio; 95% CI, 95% confidence interval; pH value, P values of Q test for heterogeneity test; U: Univariate; M: Multivariate. NOS: Newcastle Ottawa Quality Assessment Scale. Combined, treatment contain chemotherapy, surgery and radiotherapy.
Table 1: Key characteristics of all articles in the meta-analysis.
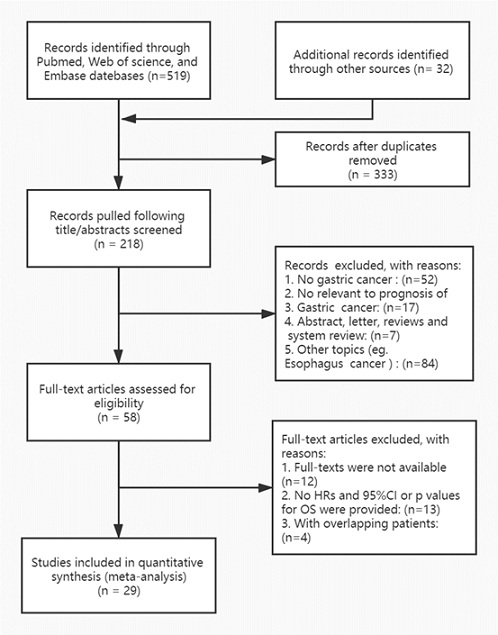 Figure 1: A flow diagram of the study selection process.
PLR and OS in gastric neoplasm
Summarize the data from all the articles revealed that the increased PLR was conspicuous contact with worse OS (HR: 1.01, 95% CI: 1.00–1.02, P=0.000) and a significant heterogeneity was discovered (Ι²=88.8%, PH^0.001, Table 2, Figure 2). To find the possible source of heterogeneity, subgroup analyses enrolled by ethnicity, tumor stage, sample size, variable analysis, treatment methods and PLR cut-off were done, the results revealed that the rise of PLR had more conspicuous prognostic function for OS in Asian populations (HR: 1.0, 95% CI: 1.0–1.01, p^0.00; Ι2=76.4%, PH=0.248). In addition, when classification by the processing method, increased PLR conspicuous indicated worse OS in patients take in chemotherapy (HR: 1.17, 95% CI: 0.82–1.68, P2 = 92.3%, PH=0.143), But having a mixing process of patients with no prognosis efficiency: (HR 1.41, 95% CI: 1.21–1.64, p^0.00; Ι2=81%, PH=0.068). It is worth noting that PLR with a cutoff value greater than 160 still suggest a worse OS for GN (HR: 1.01, 95% CI: 1.00–1.02, p^ 0.001; Ι2=87. When PLR≤160, the prognostic efficiency disappeared (HR: 1.41, 95% CI: 1.11–1.81, P=0.00; Ι2=91.5%, PH=0.005). Interestingly, increased PLR display worse OS in patients with early cancer (Table 2).
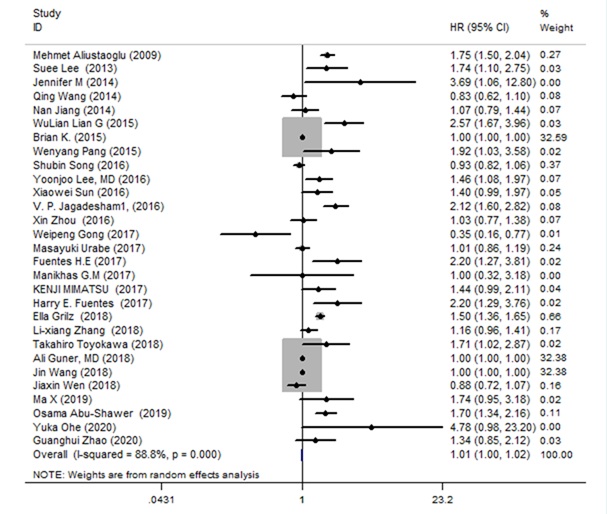 Figure 2: Forest plot of the associations between OS and the increased PLR in patients with GN.
|
Random-effects model |
Fixed-effects model |
Heterogenelty |
||||||
|
Analysis |
N |
References |
HR (95%CI) |
p |
HR (95%CI) |
p |
I2 |
pH |
|
OS |
29 |
1-29 |
1.01(1.00, 1.02) |
0 |
1.00(1.00, 1.00) |
0 |
88.80% |
0.0001 |
|
Subgroup 1: Surgery |
6 |
23, 28, 32, 34-35, 40 |
1.00(1.00, 1.01) |
0 |
1.00(1.00, 1.00) |
0 |
79.30% |
0 |
|
Chemotherapy |
6 |
21, 37-39, 42, 44 |
1.17(0.82, 1.68) |
0 |
1.00(1.00, 1.00) |
0 |
92.30% |
0.1432 |
|
Combined |
17 |
22, 24-26, 28-31, 33, 36, 41, 43, 45-49 |
1.41(1.21, 1.64) |
0 |
1.29(1.22, 1.37) |
0 |
81.00% |
0.0687 |
|
Subgroup 2: Asian |
21 |
21, 23-29, 31-33, 35-40, 42-43, 45, 47,49 |
1.00(1.00, 1.01) |
0 |
1.00(1.00, 1.00) |
0 |
76.40% |
0.248 |
|
Caucasian |
8 |
22, 30, 34, 41, 42, 44, 46, 48 |
1.63(1.27, 2.08) |
0 |
1.5(1.4, 1.61) |
0 |
84.00% |
0 |
|
Subgroup 3: cutoff value>160 |
18 |
24-27, 28-30, 32, 36-43, 46-47 |
1.01(1.00, 1.02) |
0 |
1.00(1.00, 1.00) |
87.20% |
0.135 |
|
|
cutoff value≤160 |
11 |
21-23, 31, 33-35, 44-45, 48-49 |
1.41(1.11, 1.81) |
0 |
1.00(1.00, 1.00) |
91.50% |
0.005 |
|
|
Subgroup 4: Early stage |
2 |
23, 31 |
1.17(0.81, 1.69) |
0.014 |
1.00(1.00, 1.00) |
0.014 |
83.40% |
0.392 |
|
Advanced stage |
10 |
33, 37, 39-42, 46-49 |
1.38(1.09, 1.76) |
0 |
1.00(1.00, 1.00) |
0 |
91.20% |
0.008 |
|
Whole stage |
17 |
21-22, 24-27, 28-30, 32, 34-36, 38, 43-45 |
1.29(1.12, 1.49) |
0 |
1.00(1.00, 1.00) |
0 |
88.80% |
0.001 |
|
Subgroup 5: sample size≤200 |
12 |
21, 25, 30, 33-34, 35, 38-39, 41-42, 44, 48, |
1.77(1.41, 2.21) |
0.004 |
1.8(1.62, 2.01) |
0.004 |
59.60% |
0 |
|
sample size>200 |
17 |
22-24, 26-29, 31-32, 36-37, 40, 43, 45-47 |
1.00(1.00, 1.01) |
0 |
1.00(1.00, 1.00) |
0 |
85.90% |
0.173 |
|
Subgroup 6: Univariate analysis |
10 |
23, 26, 32, 34-36, 42-43, 46-47 |
1.00(1.00, 1.01) |
0 |
1.00(1.00, 1.00) |
0 |
89.60% |
0 |
|
Multivariate analysis |
19 |
21, 22, 24-25, 27-31, 33, 37-41, 44-45, 48 |
1.30(1.13, 1.50) |
0 |
1.00(1.00, 1.00) |
0 |
89.10% |
0.309 |
N: Number of Studies; HR: Hazard Ratio; 95% CI: 95% Confidence Interval; PH: P values of Q test for Heterogeneity Test; OS: Overall Survival.
Table 2: Summary of the meta-analysis results.
Sensitivity analysis
A sensitivity analysis was done to identify potential sources of heterogeneity. For the sake of explore the effect of the individual data of the combined ORs, each individual research was omitted every time. Detail on sensitivity analysis are shown in Figure 3. With sequential omitted of each single article, the overall results were essentially unchanged, this further supports the stabilization of our outcomes.
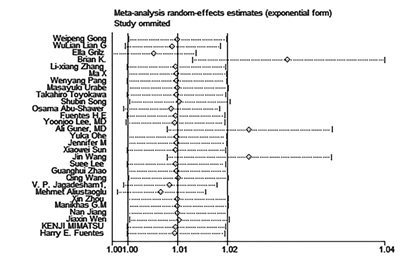 Figure 3: Sensitivity analysis of the connection between OS and PLR in GN patients.
Meta regression analysis
The regression analysis of sample size showed that Sample size was related to heterogeneity, which could explain 55% of the heterogeneity. Cut off value, Stage, variable, therapy, design, follow up Months, age, had no obvious correlation with heterogeneity (Figure 4).
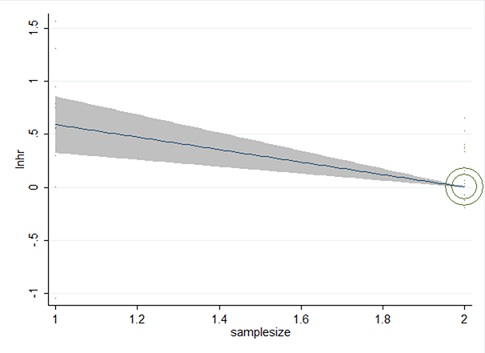 Figure 4: Meta-analysis of the connection between OS and PLR of GN. Outcomes are presented as meta regression analysis.
Publication bias
The publication bias was tested by the Berg Funnel Diagram and the Eiger line regression. Publication bias was not detected by the funnel plot, but OS publication bias may test by Egger’s line regression test (P^|t|=0.000 for Egger’s test and Pr^|z|=0.378 for Begg’s test (Figure 5, 6). The dissymmetry of contour funnel plot was obvious suggested there could be publication bias (Figure 6). The hollow circles explain a number of missing articles that locate in the non-signification region of the plot, indicated that the asymmetry was partly attributed to publication bias, which was further ascertained with the Egger’s test (p^0.001). The adjusted random affects amalgamative HRs of 1.007 (95% CI, 0.998 to 1.017) achieved using the trim-and-fill method, which was concurrent with our primary analysis (Figure 7).
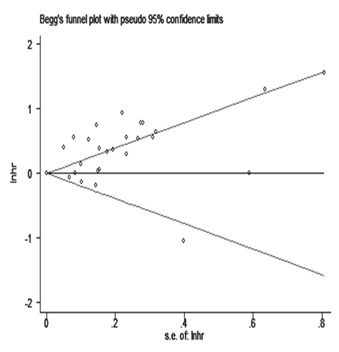 Figure 5: The results of Egger’s linear regression test.
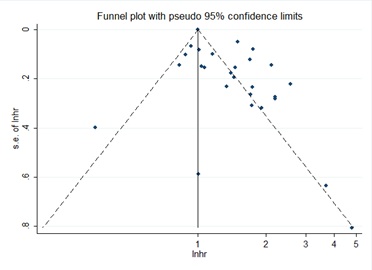
Figure 6: The adjusted funnel plot.
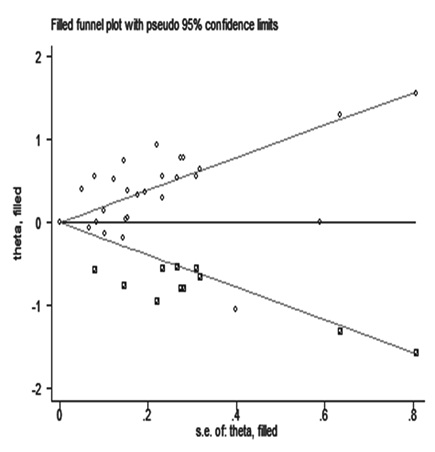 Figure 7: The adjusted funnel plot of publication bias test for OS in GN.
DISCUSSION
A good deal of articles was reported the prognostic function of PLR standard in Gastric Neoplasm patients, but the role of it was inconclusive and inconsistent. So, we write meta-analysis to acquire a clearer estimation of the prognostic function of PLR in GN by evaluate the published articles. Our meta-analysis assembly the results of 14, 052 GN patients from 29 single articles, predicating that increased PLR significantly indicted worse OS (HR: 1.01,95%CI: 1.00–1.02, P ^ 0.001 Figure 2) of GN patients. Subgroup analyses stratified by ethnicity, tumor stage, sample size, variable analysis, treatment methods and PLR cut-off were done, the outcomes revealed that the increased PLR had higher conspicuous prognostic role for OS in Asian populations. In addition, when categorized via treatment methods, the increased PLR significantly indicated lower OS in patients accepting chemotherapy with obvious heterogeneity. It is worth noting that PLR with cutoff value greater than 160 still indicates worse OS of GN. Sensitivity analysis showed the coincident pooled HRs did non-significant change when every single research was moved out. The Sensitivity analysis results clips verified the stabilization of our work. The regression analysis of sample size revealed that the sample size was related to heterogeneity (Figure 3). The regression analysis of sample size displayed that Sample size could explain 55% of the heterogeneity. (Figure 4). Publication bias is done via Begg‘s funnel plot and Egger’s line regression test route. Publication bias was not discovered by the funnel plot, but OS publication bias may detect by Egger’s line regression test (Figure 5). The asymmetry of contour funnel plot was obvious, indicating that there may be exist publication bias (Figure 6). The adjusted random effects pooled HRs of 1.007(95% CI, 0.998 to 1.017) gained via the trim-and-fill method, which was coincident with our primary analysis (Figure 7). Taking all these results into account, PLR is an important marker in the prognosis of GN.
Cancer- interrelated inflammation responses play a significant role at disparate stages of cancer progression including initiation, promotion, and metastasis [50-52]. The exact mechanisms underlying the processes between tumor and inflammation in these cancer patients are remain elusive at present [53]. There has been a growing appreciation that the inflammation plays a crucial part of the progression of malignancies [54]. Platelets can enhance the tumor growth and metastasis by platelet-derived thrombospondin, platelet factor and growth factor [55]. It has been suggested that tumor-infiltrating T cells accelerate cancer growth and proliferate through the suppression by anti-tumor immune responses [56]. Therefore, PLR can mirror an improved host inflammatory reactivity to more aggressive tumor biology and higher cancer burden [57].
PLR, which can beneficial to the clinical decision-making process with respect to GN treatment and results, is a promising prognostic inflammation biomarker. There were a few limitations of this analysis need to be elaboratively take into account. First, there was significant heterogeneity in the study time including sample size (12=55%, P=0.002^0.05). The origin of heterogeneity cannot be fully traced, although the use of sensitivity analysis and meta regression analysis, Second, the study was excluding the articles published not in English language, so the possibility of publication bias cannot be excluded. Furthermore, Heterogeneity may influence the explain of the outcomes of our meta-analyses. Heterogeneity could be due to a variety of factors, such as age distribution, Gender, PLR Cut-Off Value and so on.
CONCLUSION
In conclusion, this meta-analysis suggests that the increased PLR might be an inexpensive and effective prognostic factor of patients with GN. In future, more articles are necessary to explore these findings in the future.
DECLARATIONS
Ethics approval and consent to participate
Not applicable.
Consent for publication
Not applicable.
Availability of data and materials
The datasets used and/or analyzed during the current study are available from the corresponding author on reasonable request.
Competing interests
The authors declare that they have no competing interests.
Funding
This study is independent research funded by the following grants: Guangdong Provincial Science and Technology Planning Project 2014B090902002, Traditional Chinese Medicine Administration Project of Guangdong Province, China (no. 20203010), Science and Technology Program of Guangdong, China (no. 2020A151501325). The funding bodies have no role in the design of the study and collection, analysis, and interpretation of data and in writing the manuscript.
Author contributions
WeiHong Kuang designed the study and had full access to all data in the study and take responsibility for the integrity of data and the accuracy of the data analysis. Jie Liu had roles in the data analysis, literature searches, and was a major contributor in writing the manuscript. Lin yang had roles inpatient management, data analysis, and data interpretation. Yichun Ji contributed to data collection. Dongfeng Chen and Meiling Zhu responsibility for the experiments designed of the study and data collection. All authors contributed to approved and reviewed the final version of the manuscript. Jie Liu and Jianjiang Hua share the first authorship; the order in which they are listed was determined by workload.
Acknowledgments
The authors thank the kindness help given by all of the people who have contributed to this study.
REFERENCES
- Marimuthu A, Jacob HKC, Jakharia A, Subbannayya Y, Keerthikumar S, et al. (2011) Gene expression profiling of gastric cancer. J Proteomics Bioinform 4: 74–82.
- Shen L, Shan Y-S, Hu H-M, Price TJ, Sirohi B, et al. (2013) Management of gastric cancer in Asia: resource-stratified guidelines. Lancet Oncol 14: e535-e547.
- Zhu YP, Sheng LL, Wu J, Yang M, Cheng XF, et al. (2018) Loss of ARID1A expression is associated with poor prognosis in patients with gastric cancer. Hum Pathol 78: 28-35.
- Malogolowkin M H, Katzenstein H M, Krailo M, Chen Z, Quinn JJ, et al. (2008) Redefining the role of doxorubicin for the treatment of children with hepatoblastoma. Journal of clinical oncology : official journal of the American Society of Clinical Oncology 26: 2379-2383.
- Danielsen SA, Lind GE, Kolberg M, Høland M, Bjerkehagen B, et al. (2015) Methylated RASSF1A in malignant peripheral nerve sheath tumors identifies neurofibromatosis type 1 patients with inferior prognosis. Neuro-oncology 17: 63-69.
- Kikuchi E, Margulis V, Karakiewicz PI, Roscigno M, Mikami S, et al. (2009) Lymphovascular invasion predicts clinical outcomes in patients with node-negative upper tract urothelial carcinoma. J Clin Oncol 27: 612-618.
- Fan S, Li T, Zhou P, Peng Q, Zhu Y (2019) Development and validation of nomogram combining serum biomarker for predicting survival in patients with resected rectal cancer. Biosci Rep 39: BSR20192636.
- Antonio B, Vincenzo Q, Vitale DV, Falco M, Luciano A, et al. (2017) Anticancer and Anti-Inflammatory Properties of Ganoderma lucidum Extract Effects on Melanoma and Triple-Negative Breast Cancer Treatment. Nutrients 9: 210.
- Guo TL, Chi RP, Hernandez DM (2007) Decreased 7,12-dimethylbenz[a]anthracene-induced carcinogenesis coincides with the induction of antitumor immunities in adult female B6C3F1 mice pretreated with genistein. Carcinogenesis 28: 2560-2566.
- Hu Z, Jia C, Shu C, Chen S, Shen R, et al. (2019) Prognostic nomogram incorporating inflammatory cytokines for overall survival in patients with aggressive non-Hodgkin's lymphoma. EBioMedicine 41: 167-174.
- Laird BJ, Fallon M, Hjermstad MJ, Tuck S, Kaasa S, et al. (2016) Quality of Life in Patients with Advanced Cancer: Differential Association with Performance Status and Systemic Inflammatory Response. J Clin Oncol 34: 2769-2775.
- Berghoff AS, Wolpert F, Holland-Letz T, Koller R, Widhalm G, et al. (2017) Combining standard clinical blood values for improving survival prediction in patients with newly diagnosed brain metastases-development and validation of the LabBM score. Neuro Oncol 19: 1255-1262.
- Kimura J, Kunisaki C, Makino H, Oshima T, Ota M, et al. (2015) Evaluation of the Glasgow Prognostic Score in patients receiving chemoradiotherapy for stage III and IV esophageal cancer. Dis Esophagus 29: 1071-1080.
- Zhao Q T, Yuan Z, Zhang H, Zhang XP, Wang HE, et al. (2016) Prognostic role of platelet to lymphocyte ratio in non-small cell lung cancers: A meta-analysis including 3,720 patients. Int J Cancer 139: 164-170.
- Takeuchi H, Abe M, Takumi Y, Hashimoto T, Miyawaki M, et al. (2019) Elevated red cell distribution width to platelet count ratio predicts poor prognosis in patients with breast cancer. Sci Rep 9: 3033.
- Jiang Y, Qu S, Pan X (2020) Prognostic Nomogram for Locoregionally Advanced Nasopharyngeal Carcinoma. Sci Rep 10: 861.
- Ye G L, Chen Q, Chen X (2019) The prognostic role of platelet-to-lymphocyte ratio in patients with acute heart failure: A cohort study. Sci Rep 9: 10639.
- Kim S Y, Moon C M, Yoon H J (2019) Diffuse splenic FDG uptake is predictive of clinical outcomes in patients with rectal cancer. Sci Rep 9: 1313.
- Hui L, Hong G, Yingying C, Zhang J, Fan R, et al. (2018) Systemic inflammation biomarkers predict survival in patients of early stage non-small cell lung cancer treated with stereotactic ablative radiotherapy - a single center experience. J Cancer 9: 182-188.
- Hamada T, Cao Y, Qian ZR, Masugi Y, Nowak JA, et al. (2017) Aspirin Use and Colorectal Cancer Survival According to Tumor CD274 (Programmed Cell Death 1 Ligand 1) Expression Status. J Clin Oncol 35: 1836-1844.
- Gong W, Zhao L, Dong Z, Dou Y, Liu Y, et al. (2018) After neoadjuvant chemotherapy platelet/lymphocyte ratios negatively correlate with prognosis in gastric cancer patients. J Clin Lab Anal 32: e22364.
- Grilz E, Posch F, Königsbrügge O, Schwarzinger I, Lang IM, et al. (2018) Association of Platelet-to-Lymphocyte Ratio and Neutrophil-to-Lymphocyte Ratio with the Risk of Thromboembolism and Mortality in Patients with Cancer. Thromb Haemost 118: 1875-1884.Aa
- Goh BKP, Chok AY, Allen Jr JC, Quek R, Teo MCC, et al. (2016) Blood neutrophil-to-lymphocyte and platelet-to-lymphocyte ratios are independent prognostic factors for surgically resected gastrointestinal stromal tumors. Surgery 159: 1146-1156.
- Zhang LX, Wei ZJ, Xu AM, Zang JH (2018) Can the neutrophil-lymphocyte ratio and platelet-lymphocyte ratio be beneficial in predicting lymph node metastasis and promising prognostic markers of gastric cancer patients? Tumor maker retrospective study. Int J Surg 56: 320-327.
- Ma X, Zhao W, Zhuang C, Wang X, Tu L, et al. (2017) Clinicopathological classification and prognostic factors of gastrointestinal neuroendocrine neoplasms an analysis of 119 cases. Zhonghua Wei Chang Wai Ke Za Zhi 20: 997-1001.
- Pang W, Lou N, Jin C (2016) Combination of preoperative platelet/lymphocyte and neutrophil/lymphocyte rates and tumor-related factors to predict lymph node metastasis in patients with gastric cancer. Eur J Gastroenterol Hepatol 28: 493-502.
- Urabe M, Yamashita H, Watanabe T, Seto Y (2018) Comparison of prognostic abilities among preoperative laboratory data indices in patients with resectable gastric and esophagogastric junction adenocarcinoma. World J Surg 42: 185-194.
- Song S, Li C, Li S, Gao H, Lan X, et al. (2017) Derived neutrophil to lymphocyte ratio and monocyte to lymphocyte ratio may be better biomarkers for predicting overall survival of patients with advanced gastric cancer. Onco Targets Ther 10: 3145-3154.
- Abu-Shawer O, Abu-Shawer M, Haimour A, Alhouri A, Alkhatib AA, et al. (2019) Hematologic markers of distant metastases in gastric cancer. J Gastrointest Oncol 10: 529-536.
- Fuentes HE, Oramas DM, Paz LH, Wang Y, Andrade XA, et al. (2017) Venous Thromboembolism Is an Independent Predictor of Mortality Among Patients with Gastric Cancer. J Gastrointest Cancer 49: 415-421.
- Lee Y, Kim YW, Park DK, Hwang IC (2017) Inverse Association between Platelet-Lymphocyte Ratio and Prognosis in Terminally Ill Cancer Patients: A Preliminary Study. J Palliat Med 20: 533-537.
- Guner A, Kim SY, Yu JE, Min IK, Roh YH, et al. (2018) Parameters for predicting surgical outcomes for gastric cancer patients: simple is better than complex. Ann Surg Oncol 25: 3239-3247.
- Ohe Y, Fushida S, Yamaguchi T, Kinoshita J, Saito H, et al. (2020) Peripheral Blood Platelet-Lymphocyte Ratio Is Good Predictor of Chemosensitivity and Prognosis in Gastric Cancer Patients. Cancer Manag Res 12: 1303-1311.
- Racz JM, Cleghorn MC, Jimenez MC, Atenafu EG, Jackson TD, et al. (2015) Predictive ability of blood neutrophil-to-lymphocyte and platelet-to-lymphocyte ratios in gastrointestinal stromal tumors. Ann Surg Oncol 22: 2343-2350.
- Lian L, Xia YY, Zhou C, Shen XM, Li XL, et al. (2015) Application of platelet/lymphocyte and neutrophil/lymphocyte ratios in early diagnosis and prognostic prediction in patients with resectable gastric cancer. Cancer Biomark 15: 899-907.
- Sun X, Liu X, Liu J, Xu D, Li W, et al. (2016) Preoperative neutrophil-to-lymphocyte ratio plus platelet-to-lymphocyte ratio in predicting survival for patients with stage I-II gastric cancer. Chin J Cancer 35: 57.
- Wang J, Qu J, Che X, Li Z, Liu J, et al. (2018) Pretreatment platelet-to-lymphocyte ratio is associated with the response to first-line chemotherapy and survival in patients with metastatic gastric cancer. J Clin Lab Anal 32: e22185.
- Lee S, Oh SY, Kim SH, Lee JH, Kim MC, et al. (2013) Prognostic significance of neutrophil lymphocyte ratio and platelet lymphocyte ratio in advanced gastric cancer patients treated with FOLFOX chemotherapy. BMC Cancer 13: 350-350.
- Zhao G, Liu N, Wang S, Guo J, Song X, et al. (2020) Prognostic significance of the neutrophil-to-lymphocyte and platelet-to-lymphocyte ratio in patients with metastatic gastric cancer. Medicine (Baltimore) 99: e19405.
- Wang Q, Yang Y, Zhang YP, Zou Z, Qian X, et al. (2014) Prognostic value of carbohydrate tumor markers and inflammation-based markers in metastatic or recurrent gastric cancer. Med Oncol 31: 289.
- Jagadesham VP, Lagarde SM, Immanuel A (2017) Systemic inflammatory markers and outcome in patients with locally advanced adenocarcinoma of the oesophagus and gastro-oesophageal junction. Br J Surg 104: 401-407.
- Aliustaoglu M, Bilici A, Ustaalioglu BB (2010) The effect of peripheral blood values on prognosis of patients with locally advanced gastric cancer before treatment. Med Oncol 27: 1060-1065.
- Zhou X, Xu L, Huang Z, Zhang L, Zhang H, et al. (2016) The hematologic markers as prognostic factors in patients with resectable gastric cancer. Cancer Biomark 17: 359-367.
- Martínez-Lago N, Lesta-Mellid R, Rendo CR (2018) The prognostic value of systemic inflammatory factors in patients with HER2-positive metastatic gastric cancer. Ann Oncol 29.
- Jiang N, Deng JY, Liu Y, Ke B, Liu H-G, et al. (2014) The role of preoperative neutrophil-lymphocyte and platelet-lymphocyte ratio in patients after radical resection for gastric cancer. Biomarkers 19: 444-451.
- Wen J, Bedford M, Begum R, Mitchell H, Hodson J, et al. (2018) The value of inflammation based prognostic scores in patients undergoing surgical resection for oesophageal and gastric carcinoma. J Surg Oncol 117: 1697-1707.
- Mimatsu K, Fukino N, Ogasawara Y, Saino Y, Oida T, et al. (2017) Utility of inflammatory marker- and nutritional status-based prognostic factors for predicting the prognosis of stage iv gastric cancer patients undergoing non-curative surgery. Anticancer Res 37: 4215-4222.
- Takahiro T, Kazuya M, Tatsuro T, Sakurai K, Amano R, et al. (2018) Comparison of the prognostic impact and combination of preoperative inflammation-based and/or nutritional markers in patients with stage II gastric cancer. Oncotarget 9: 29351-29364.
- Qian H, Chao X, Ding WX (2018) A PINK1-mediated mitophagy pathway decides the fate of tumors-to be benign or malignant? Autophagy 14: 563-566.
- Sun B, Karin M (2014) The therapeutic value of targeting inflammation in gastrointestinal cancers. Trends Pharmacol Sci 35: 349-357.
- Li J, Maruyama T, Zhang P, Konkel JE, Hoffman V, et al. (2010) Mutation of inhibitory helix-loop-helix protein Id3 causes γδ T-cell lymphoma in mice. Blood 116: 5615-5621.
- Ilangumaran S, Briol A, Hoessli DC (1998) CD44 selectively associates with active Src family protein tyrosine kinases Lck and Fyn in glycosphingolipid-rich plasma membrane domains of human peripheral blood lymphocytes. Blood 91: 3901-3908.
- Qin H, Yu H, Sheng J, Zhang D, Shen N, et al. (2019) PI3Kgamma Inhibitor Attenuates Immunosuppressive Effect of Poly (l-Glutamic Acid)-Combretastatin A4 Conjugate in Metastatic Breast Cancer. Adv Sci 6: 1900327.
- Li K, Duan WC, Zhao HB, Wang L, Wang W, et al. (2019) Preoperative Neutrophil to Lymphocyte Ratio and Platelet to Lymphocyte Ratio are Associated with the Prognosis of Group 3 and Group 4 Medulloblastoma. Sci Rep 9: 13239.
- Kohlhapp FJ, Broucek JR, Hughes T, Huelsmann EJ, Lusciks J, et al. (2015) NK cells and CD8+ T cells cooperate to improve therapeutic responses in melanoma treated with interleukin-2 (IL-2) and CTLA-4 blockade. J Immunother Cancer 3: 18.
- Huang XZ, Chen WJ, Zhang X, Wu CC, Zang CY, et al. (2017) An Elevated Platelet-to-Lymphocyte Ratio Predicts Poor Prognosis and Clinicopathological Characteristics in Patients with Colorectal Cancer: A Meta-Analysis. Dis Markers 2017: 1053125.
- Huang XZ, Chen WJ, Zhang X, Zheng S (2017) Preoperative neutrophil-to-lymphocyte ratio and tumor-related factors to predict lymph node metastasis in nonfunctioning pancreatic neuroendocrine tumors. Sci Rep 7: 17506.
Citation: Li J, Yang L, Ji Y, Chen D, Zhu M, et al. (2020) Prognostic Value of Platelet-To-Lymphocyte Ratio in Oncologic Outcomes of Gastric Cancers: What Should We Expect from a Meta-Analysis? J Gastroenterol Hepatology Res 5: 031.
Copyright: © 2020 Jie Li, et al. This is an open-access article distributed under the terms of the Creative Commons Attribution License, which permits unrestricted use, distribution, and reproduction in any medium, provided the original author and source are credited.