QT Intervals Correlate with Carotid Artery Intima Media Thickness in a Gender-Specific and Segment-Specific Manner in Asymptomatic Dyslipidemic Patients
*Corresponding Author(s):
Giuliana MombelliDyslipidemia Center, Hospital Niguarda CÃ Granda, Piazza Dellâ € ™ Ospedale Maggiore, Milan, Italy
Tel:+39 0250319904,
Fax:+39 0264444513
Email:giuliana.mombelli@ospedaleniguarda.it
Abstract
Objective: To investigate the relationship between cardiac repolarization (QT) or QT corrected (QTc) and carotid artery Intima Media Thickness (IMT) in primary prevention patients of the two genders.
Methods: 405 individuals, 183 men (55.3 ± 11.9 years) and 222 women (64.3 ± 9.6 years) were examined. QT and QT corrected formulae of Bazett (B), Fridericia (F), Hodges (H), Nomogram-Karjalainen (K), Rautaharju (R) and Sagie-Framingham (S-F) were applied.
Results: In men significant correlations between left internal carotid IMT and QT (r=0.192; P<0.001) or QTc (B) r=0.206, (F) r=0.238, (H) r=0.223, (K) r=0.237, (R) r=0.227, (S-F) r=0.247; (P<0.001) were detected. The associations between QT or QTc and left internal carotid IMT remained significant, after adjusting for different risk factors in the men.
In the women, there were significant associations between the QT intervals with right common carotid IMT (r=0.141, P<0.05) and left common carotid IMT (r=0.187, P<0.01).
The associations between QT and left common carotid IMT remained significant, after adjustment in the women.
Conclusion: In dyslipidemic patients in primary prevention, QT intervals correlate with carotid IMT in a gender and segment-specific manner. These variables, easy to obtain in clinical practice, can provide a useful tool to estimate cardiovascular risk.
Keywords
ABBREVIATIONS
AV: Atrioventricular
BMI: Body Mass Index
CC-IMT: Common Carotid-Intima Media Thickness
CV: Cardiovascular
CVD: Cardiovascular Disease
DBP: Diastolic Blood Pressure
ECG: Electrocardiogram
HDL-C: High Density Lipoprotein-Cholesterol
HR: Heart Rate
ICA-IMT: Internal Carotid Intima Media Thickness
IMT: Intima Media Thickness
LDL-C: Low Density Lipoprotein-Cholesterol
QTc QT: Interval Corrected
QT (B) QT: Interval Corrected with Bazett Formula
QT (F) QT: Interval Corrected with Fridericia Formula
QT (H) QT: Interval Corrected with Hodges Formula
QT (K) QT: Interval Corrected with Nomogram-Karjalainen Formula
QT (R) QT: Interval Corrected with Rautaharju Formula
QT (S-F) QT: Interval Corrected with Sagie-Framingham Formula
SBP: Systolic Blood Pressure
TG: Triglycerides
TC: Total Cholesterol
INTRODUCTION
The QT interval is measured from the beginning of the QRS complex to the end of the T-wave and should be corrected for heart rate to enable comparison with reference values. QT interval physiologically differs from women and men, because of hormonal effects and gender differences in autonomic tone [1]. Many studies have suggested a relationship between prolonged QT interval with total and Cardiovascular (CV) mortality [2,3]. A dose-response relationship between longer QTc intervals and the risk of all-cause deaths have been also reported. The association was strongest in men with QTc ≥ 466 ms [HR for CV disease 4.08; 95% Confidence Interval (CI) 2.93-5.69, P<0.001], whereas in women QTc intervals ≤ 379 ms produced a HR of 1.58 (95% CI 1.20-2.09, P=0.001) for Cardiovascular Diseases (CVD) mortality [4].
Carotid artery Intima-Media Thickness (IMT), measured by B-mode ultrasound, is a well recognized subclinical marker of atherosclerosis [5]. In view of the detected correlation between QT interval changes and mortality, the use of this non-invasive marker appears to be of particular interest for the early detection and prevention of cardiovascular diseases. Festa et al., [6] first reported a significant relationship between QT interval duration and atherosclerosis in asymptomatic non-diabetic subjects. QT interval was related to IMT of Common Carotid (CC-IMT), but not to that of the Internal Carotid Arteries (ICA-IMT). The association was stronger in women than in men and was partly associated to the presence of cardiovascular risk factors. A close association between QT corrected (QTc) according to Bazett formula (B) and CC-IMT was also observed in patients with type 2 diabetes [7]. A significant correlation between QTc (B) and the right CC-IMT in obese children was also reported [8].
The influence of gender on the association between carotid IMT variables and QT or QTc intervals was investigated in healthy subjects [9]. An association between QTcs and ICA-IMT was observed in men, whereas in women a statistically significant relationship was found only between QT and CC-IMT [9].
The present study was aimed at investigating the relationship between QT interval duration, with and without correction for Heart Rate (HR) by different formulae, and carotid IMT in a population of dyslipidemic patients without cardio or cerebrovascular disease. In order to assess the role of QT as a marker of subclinical atherosclerosis potentially useful to estimate the cardiovascular risk in a gender-specific manner, all the analyses were stratified by gender.
METHODS
Subjects and study design
Ultrasound examination
The ultrasonic protocol requires visualization of the near and far walls of both right (r-CC-IMT) and left (l-CC-IMT) common carotid IMT, carotid bifurcations and the first proximal cm of ICA-IMT in three different angles (lateral, anterior and posterior), for a total of 36 carotid segments per patient.
The maximal IMT of each segment was measured. The complete procedure is generally performed in approximately 30 to 35 minutes. The maximal IMT values for the three projections and for right and left carotid arteries were averaged to obtain the mean maximum IMT.
Assessment of cardiac repolarization
Laboratory procedures
Statistical analyses
RESULTS
The descriptive statistics are summarized in table 1. HR was significantly higher in women than men (67.8 ± 10.0 vs. 63.3 ± 8.9 bpm; P<0.001). Non-corrected QT wasn’t different in the two genders, but it resulted higher in women than in men. Using six QT correction formulae, QTcs were far greater in women (P<0.001). Analyzing IMT, we found segment-specific differences in the two genders: l-ICA-IMT and ICA-IMTm were smaller in women compared with men (P=0.017 and 0.031 respectively).
| Men (n=183) | Women (n=222) | ||
| Mean ± SD | Mean ± SD | P-value | |
| Age (years) | 55.3 ± 11.9 | 64.3 ± 9.6 | <0.001 |
| BMI (Kg m-2) | 26.1 ± 3.0 | 24.3 ± 3.3 | <0.001 |
| SBP (mm Hg) | 127.2 ± 12.5 | 129.7 ± 15.1 | ns |
| DBP (mm Hg) | 80.5 ± 8.8 | 79.3 ± 8.2 | ns |
| TC (mg/dL) | 243.5 ± 46.2 | 244.2 ± 42.4 | ns |
| TG (mg/dL) | 137.0 (41-498) | 102.5 (31-411) | <0.001 |
| HDL-C (mg/dL) | 47.3 ± 12.8 | 62.7 ± 15.7 | <0.001 |
| LDL-C (mg/dL) | 164.8 ± 43.7 | 157.4 ± 41.5 | ns |
| Hypertension (%) | 42 (23.0) | 81 (36.5) | 0.005 |
| Diabetes (%) | 13 (7.1) | 11 (5.0) | ns |
| Smoking (%) | 125 (68.3) | 78 (35.1) | <0.001 |
| Statins (%)
|
52 (28.4) | 104 (46.8) | <0.01 |
| Fibrates (%)
|
46 (25.1) | 29 (13.1) | 0.003 |
| HR (bpm) | 63.3 ± 8.9 | 67.8 ± 10.0 | <0.001 |
| QT (ms) | 401.4 ± 29.3 | 402.9 ± 29.6 | ns |
| QTc (B) (ms) | 409.8 ± 21.1 | 425.5 ± 21.9 | <0.001 |
| QTc (F) (ms) | 406.7 ± 20.0 | 417.5 ± 20.8 | <0.001 |
| QTc (H) (ms) | 407.2 ± 20.7 | 416.5 ± 20.6 | <0.001 |
| QTc (K) (ms) | 408.1 ± 20.0 | 418.8 ± 20.3 | <0.001 |
| QTc (R) (ms) | 408.5 ± 19.7 | 420.6 ± 20.0 | <0.001 |
| QTc (S-F) (ms) | 406.5 ± 19.7 | 417.9 ± 20.1 | <0.001 |
| r-CC-IMT (mm) | 0.93 (0.40-2.30) | 0.95 (0.30-3.40) | ns |
| l-CC-IMT (mm) | 1.07 (0.50-3.40) | 0.96 (0.50-2.70) | ns |
| CC-IMTm (mm) | 0.98 (0.50-2.70) | 0.96 (0.40-3.05) | ns |
| r-ICA-IMT (mm) | 1.08(0.40-3.90) | 1.02 (0.40-4.00) | ns |
| l-ICA-IMT (mm) | 1.01 (0.40-4.20) | 0.92 (0.40-2.60) | 0.017 |
| ICA-IMTm (mm) | 1.08 (0.50-3.65) | 1.00 (0.45-2.75) | 0.031 |
| IMTMean (mm) | 1.03 (0.57-1.98) | 1.03 (0.48-2.04) | ns |
| IMTMax (mm) | 1.79 (0.70-5.10) | 1.81 (0.60-4.70) | ns |
Using Pearson’s correlation analysis, the links between QT or QTcs and carotid IMT in the two genders were calculated (Table 2).
| Men (n=183) | Women (n=222) | |||||||||||
| r-CC | l-CC | CCm | r-ICA | l-ICA | ICAm | r-CC | l-CC | CCm | r-ICA | l-ICA | ICAm | |
| QT | 0.071 | 0.012 | 0.047 | 0.068 | 0.192** | 0.168* | 0.141* | 0.187** | 0.185** | 0.002 | -0.001 | -0.002 |
| QTc (B) | -0.001 | 0.042 | 0.021 | 0.056 | 0.206** | 0.163* | 0.028 | -0.034 | -0.005 | 0.035 | -0.009 | 0.019 |
| QTc (F) | 0.035 | 0.035 | 0.038 | 0.073 | 0.238** | 0.196** | 0.09 | 0.07 | 0.09 | 0.025 | -0.007 | 0.012 |
| QTc (H) | 0.045 | 0.014 | 0.03 | 0.079 | 0.223** | 0.191** | 0.101 | 0.088 | 0.106 | 0.022 | -0.005 | 0.011 |
| QTc (K) | 0.035 | 0.031 | 0.035 | 0.075 | 0.237** | 0.196** | 0.087 | 0.067 | 0.086 | 0.023 | -0.013 | 0.008 |
| QTc (R) | 0.027 | 0.025 | 0.027 | 0.072 | 0.227** | 0.187* | 0.066 | 0.031 | 0.054 | 0.025 | -0.008 | 0.012 |
| QTc (S-F) | 0.031 | 0.042 | 0.04 | 0.067 | 0.247** | 0.196** | 0.081 | 0.062 | 0.081 | 0.021 | -0.011 | 0.006 |
In men statistically significant correlation were found between QT and QTc intervals both with l-ICA-IMT (P<0.01) and ICA-IMTm (P<0.01 or P<0.05 depending on which correction formula was used). In women, instead, only non-corrected QT correlated with r-CC-IMT (P<0.05), l-CC-IMT and CC-IMTm (P<0.01).
Performing a multivariate linear regression, the association between QT or QTcs and IMT were adjusted for age (model 1) and for age, BMI, SBP, DBP, HDL-C and LDL-C (Model 2). In (Table 3a,b) were reported the coefficient B for the two models and the two genders. The coefficient B can be interpreted as the mean expected increase in the dependent variables (QT and QTc) for every 1 mm increase in the respective IMT parameter, and all other covariates remaining unchanged.
| a | Men (n=183) | Women (n=222) | ||||||||||
| Model 1
|
r-CC | l-CC | CCm | r-ICA | l-ICA | ICAm | r-CC | l-CC | CCm | r-ICA | l-ICA | ICAm |
| QT | 0.001 | -0.017 | -0.013 | 0.003 | 0.024*
|
0.022 | 0.032 | 0.044* | 0.050* | -0.003 | -0.004 | -0.006 |
| QTc (B) | -0.009 | -0.004 | -0.01 | 0.001 | 0.020* | 0.017 | 0.004 | -0.008 | -0.003 | 0.004 | -0.002 | 0.002 |
| QTc (F) | -0.006 | -0.008 | -0.011 | 0 | 0.021* | 0.019 | 0.013 | 0.01 | 0.015 | 0.001 | -0.003 | 0.001 |
| QTc (H) | -0.004 | -0.012 | -0.013 | 0.001 | 0.020* | 0.019 | 0.015 | 0.013 | 0.018 | 0.001 | -0.003 | 0.001 |
| QTc (K) | -0.005 | -0.009 | 0.011 | 0.001 | 0.021* | 0.019 | 0.012 | 0.008 | 0.013 | 0.001 | -0.004 | 0.001 |
| QTc (R) | -0.006 | -0.008 | -0.011 | 0.001 | 0.020* | 0.019 | 0.009 | 0.003 | 0.007 | 0.002 | -0.002 | 0 |
| QTc (S-F) | -0.006 | -0.007 | -0.01 | 0.001 | 0.022** | 0.019 | 0.011 | 0.008 | 0.012 | 0.001 | -0.003 | 0.001 |
| b | ||||||||||||
| Model 2 | r-CC | l-CC | CCm | r-ICA | l-ICA | ICAm | r-CC | l-CC | CCm | r-ICA | l-ICA | ICAm |
| QT | 0.004 | -0.015 | -0.01 | -0.002 | 0.021 | 0.018 | 0.036 | 0.045* | 0.054** | -0.003 | -0.002 | -0.003 |
| QTc (B) | -0.009 | 0.005 | -0.007 | -0.004 | 0.016 | 0.01 | 0.005 | -0.009 | -0.003 | 0.005 | 0 | 0.004 |
| QTc (F) | -0.005 | -0.005 | -0.008 | -0.003 | 0.018* | 0.012 | 0.016 | 0.01 | 0.017 | 0.002 | 0 | 0.002 |
| QTc (H) | -0.002 | -0.009 | -0.01 | -0.002 | 0.017 | 0.012 | 0.018 | 0.013 | 0.02 | 0.002 | -0.001 | 0.002 |
| QTc (K) | -0.004 | -0.006 | -0.008 | -0.003 | 0.017* | 0.012 | 0.014 | 0.008 | 0.015 | 0.002 | -0.001 | 0.001 |
| QTc (R) | -0.005 | -0.005 | -0.008 | -0.003 | 0.017* | 0.011 | 0.011 | 0.003 | 0.009 | 0.003 | 0 | 0.002 |
| QTc (S-F) | -0.005 | -0.003 | -0.006 | -0.004 | 0.019* | 0.013 | 0.013 | 0.008 | 0.014 | 0.002 | -0.001 | 0.001 |
After having assessed that the strongest correlations were with l-ICA-IMT in men and l-CC-IMT in women (r=0.247 and r=0.187, respectively) a further analysis was performed.
l-ICA-IMT was stratified in men, while l-CC-IMT in women, according to their respective median values: i.e., 1 mm for men and 0.9 mm for women (Figure 1). In men, all QT and QTcs differences were statistically significant (all p<0.05) (Figure 1). In women, only the non-corrected QT was significantly prolonged in the group with l-CC-IMT value above the median (Figure 1).
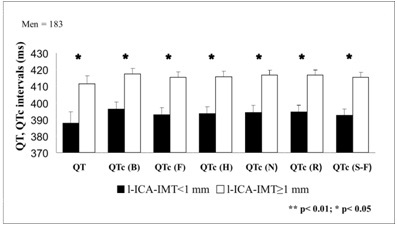
Figure 1: QT and QTc variations depending on carotid IMT in men after adjustment for age, BMI, SBP, DBP, HDL-C, LDL-C.
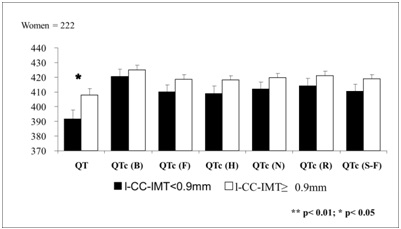
Figure 2: QT and QTc variations depending on carotid IMT in women after adjustment for age, BMI, SBP, DBP, HDL-C, LDL-C.
Covariate analysis was performed using QT and QTc as dependent variables, while carotid IMT and gender as independent variables after adjustment for age, BMI, SBP, DBP, HDL-C and LDL-C.
Significant interaction were found between l-CC-IMT, CC-IMTm and gender for QT, while l-ICA-IMT and gender for QTc (F,K,R,S-F) (Table 4). These results confirm the gender linked differences reported in the linear model analyses.
| Total (n=405) | ||||||
| r-CC*gender | I-CC*gender | CCm*gender | r-ICA*gender | l-ICA*gender | ICAm*gender | |
| F | F | F | F | F | F | |
| QT | 1.042 | 5.872* | 3.915* | 0.218 | 2.559 | 1.972 |
| QTc (B) | 0.077 | 0.558 | 0.051 | 0 | 3.41 | 1.406 |
| QTc (F) | 0.483 | 0.457 | 0.669 | 0.058 | 4.278* | 2.292 |
| QTc (H) | 0.524 | 1.238 | 1.196 | 0.111 | 3.823 | 2.224 |
| QTc (K) | 0.403 | 0.418 | 0.597 | 0.091 | 4.686* | 2.518 |
| QTc (R) | 0.219 | 0.066 | 0.215 | 0.062 | 4.154* | 2.154 |
| QTc (S-F) | 0.355 | 0.218 | 0.411 | 0.067 | 5.072* | 2.65 |
DISCUSSION
Prolonged QT interval and increased carotid IMT have been both associated with cardiovascular morbidity and mortality in epidemiological studies [5,14-20] with significant gender related differences. This was underlined in the report by Nielsen et al., where, in women, a very short QTc interval has an equivalent risk as a moderately prolonged QTc interval. A recent meta-analysis [18] showed consistent associations between prolonged QT interval and increased risk of total, cardiovascular, coronary, and sudden death mortality in the general population; not providing, however, specific gender-related comparisons. In a follow up study of a larger population of both genders [19], the same authors reported an increased mortality risk associated with both the longest and the shortest QT intervals, thus suggesting that the presence of a significant number of women may bring to light the risk of very short QTc intervals.
Besides the association with clinical outcomes, a number of studies have evaluated the association of QT intervals (corrected or uncorrected) and subclinical atherosclerosis. Strohmer et al., [9] showed crude correlations between QT or QTcs (Bazett, Fridericia, Hodges, Rautaharju and Sagie-Framingham) and ICA-IMT in healthy men, as well as a significant crude correlation between QTcs and CC-IMT. In our series of dyslipidemic patients, we observed similar results but only for QT in women (Tables 2,3(a,b)) whereas our findings confirm the correlations between QT or QTc and ICA-IMT in men (Table 2). Differently from other authors [9], we did not find any correlation between QT or QTc and CC-IMT in men. After adjusting for age (Model 1, Table 3a), in men correlations were similar to those reported by Strohmer [9], while after adjusting for other clinical and laboratory parameters (Model 2, Table 3b), we found correlations between ICA-IMT and QTc calculated according to some formulas (F,K,R,S-F), but not for QTc calculated with others (B, H) or for uncorrected QT.
Differently from Strohmer et al., [9], in the present study the two genders were more uniformly represented. In addition, we analyzed separately both right and left CC-IMT and ICA-IMT, not only the mean value of the two [9]. Finally, for the assessment of cardiac repolarization we used six correction formulae, not five.
Taken together, all of these findings indicate that the relationship between QT or QTc intervals and carotid IMT may differ between genders. The present findings, appear thus to indicate a different association between altered QT or QTc and specific arterial segments [9]. Previous data from our group indicated that the carotid IMT is best correlated to coronary IMT, as assessed by intravascular ultrasound [5]. In a recent large European study, Baldassarre et al., [20] evaluated the performance of several carotid IMT markers as predictors of cardiovascular events. They observed that CC-IMT is a better predictor of coronary events vs. ICA-IMT. In contrast, in the same study ICA-IMT was better correlated to combined or cerebrovascular events. In an earlier study by O’Leary et al., [21], on the other hand, there was the indication that, compared to CC-IMT, ICA-IMT may be a better predictor of cardiovascular but not of cerebrovascular events.
A review of several epidemiological studies has recently shown that in all eight studies reviewed CC-IMT by itself or combined with the ICA-IMT, was an independent predictor of cardiovascular events [22]. More recently Polak et al., [23] showed both CC-IMT and ICA-IMT are independent predictors of cardiovascular outcomes.
CONCLUSION
QT intervals, that reflect total duration of ventricular myocardial depolarization and repolarization, are associated with carotid IMT, thus confirming that also these variables are markers of subclinical atherosclerosis. The fact that QT intervals correlate better with common carotid IMT in women and with internal carotid arteries IMT in men suggest that gender-specific differences exist regarding carotid segment involvement. Whether these differences imply also differences in the capacity of QT intervals to predict vascular events in men and in women remains to be determined.
APPENDIX
Log equations[RR interval (s) = 60/HR]
Bazett [QTc (B) = QT/RR interval 1/2]
Fridericia [QTc (F) = QT/RR interval 1/3]
Linear equations: Hodges [QTc (H) = QT + 1.75(HR-60)]
Sagie-Framingham [QTc (S-F) = QT + 154 (1-60/HR)]
Other equations: Rautaharju QT(R) = QT+ [410-656/ (1+HR/100)]
Nomogram-Karjalainen QTc (N) = QT+ Nomogram correction factor
REFERENCES
- Larsen JA, Kadish AH (1998) Effects of gender on cardiac arrhythmias. J Cardiovasc Electrophysiol 9: 655-664.
- Robbins J, Nelson JC, Rautaharju PM, Gottdiener JS (2003) The association between the length of the QT interval and mortality in the Cardiovascular Health Study. Am J Med 115: 689-694.
- Straus SM, Kors JA, De Bruin ML, van der Hooft CS, Hofman A, et al. (2006) Prolonged QTc interval and risk of sudden cardiac death in a population of older adults. J Am Coll Cardiol 47: 362-367.
- Nielsen JB, Graff C, Rasmussen PV, Pietersen A, Lind B, et al. (2014) Risk prediction of cardiovascular death based on the QTc interval: evaluating age and gender differences in a large primary care population. Eur Heart J 35: 1335-1344.
- Amato M, Montorsi P, Ravani A, Oldani E, Galli S, et al. (2007) Carotid intima-media thickness by B-mode ultrasound as surrogate of coronary atherosclerosis: correlation with quantitative coronary angiography and coronary intravascular ultrasound findings. Eur Heart J 28: 2094-2101.
- Festa A, D’Agostino R, Jr, Rautaharju P, O’Leary DH, Rewers M, et al. (1999) Is QT interval a marker of subclinical atherosclerosis in nondiabetic subjects? The Insulin Resistance Atherosclerosis Study (IRAS). Stroke 30: 1566-1571.
- Takebayashi K, Aso Y, Matsutomo R, Wakabayashi S, Inukai T (2004) Association between the corrected QT intervals and combined intimal-medial thickness of the carotid artery in patients with type 2 diabetes. Metabolism 53: 1152-1157.
- Guven A, Ozgen T, Gungor O, Aydin M, Baysal K (2010) Association between the corrected QT interval and carotid artery intima-media thickness in obese children. J Clin Res Pediatr Endocrinol 2: 21-27.
- Strohmer B, Pichler M, Iglseder B, Paulweber B (2005) Relationship of QT interval duration with carotid intima media thickness in a clinically healthy population undergoing cardiovascular risk screening. J Intern Med 257: 238-246.
- Pignoli P, Tremoli E, Poli A, Oreste P, Paoletti R (1986) Intimal plus medial thickness of the arterial wall: a direct measurement with ultrasound imaging. Circulation 74: 1399-1406.
- Chiladakis J, Kalogeropoulos A, Arvanitis P, Koutsogiannis N, Zagli F, et al. (2010) Preferred QT correction formula for the assessment of drug-induced QT interval prolongation. J Cardiovas Electrophysiol 21: 905-913.
- Karjalainen J, Viitasalo M, Manttari M, Manninen V (1994) Relation between QT intervals and heart rates from 40 to 120 beats/min in rest electrocardiograms of men and a simple method to adjust QT interval values. J Am Coll Cardiol 23: 1547-1553.
- Tremblay AJ, Morrissette H, Gagne JM, Bergeron J, Gagne C, et al. (2004) Validation of the Friedewald formula for the determination of low-density lipoprotein cholesterol compared with beta-quantification in a large population. Clin Biochem 37: 785-790.
- Wang TJ, Nam BH, D’Agostino RB, Wolf PA, Lloyd-Jones DM, et al. (2003) Carotid intima-media thickness is associated with premature parental coronary heart disease: the Framingham Heart Study. Circulation 108: 572-576.
- Tran LT, Park HJ, Kim HD (2012) Is the carotid intima-media thickness really a good surrogate marker of atherosclerosis? J Atheroscler Thromb 19: 680-690.
- Grobbee DE, Bots ML (1994) Carotid artery intima-media thickness as an indicator of generalized atherosclerosis. J Int Med 236: 567-573.
- Baldassarre D, Amato M, Pustina L, Castelnuovo S, Sanvito S, et al. (2007) Measurement of carotid artery intima-media thickness in dyslipidemic patients increases the power of traditional risk factors to predict cardiovascular events. Atherosclerosis 191: 403-408.
- Zhang Y, Post WS, Blasco-Colmenares E, Dalal D, Tomaselli GF, et al. (2011) Electrocardiographic QT interval and mortality: a meta-analysis. Epidemiology 22: 660-670.
- Zhang Y, Post WS, Dalal D, Blasco-Colmenares E, Tomaselli GF, et al. (2011) QT-interval duration and mortality rate: results from the Third National Health and Nutrition Examination Survey. Arch Internal Med 171: 1727-1733.
- Baldassarre D, Hamsten A, Veglia F, de Faire U, Humphries SE, et al. (2012) Measurements of carotid intima-media thickness and of interadventitia common carotid diameter improve prediction of cardiovascular events: results of the IMPROVE (Carotid Intima Media Thickness [IMT] and IMT-Progression as Predictors of Vascular Events in a High Risk European Population) study. J Am Coll Cardiol 60: 1489-1499.
- O’Leary DH, Polak JF, Kronmal RA, Manolio TA, Burke GL, et al. (1999) Carotid-artery intima and media thickness as a risk factor for myocardial infarction and stroke in older adults. Cardiovascular Health Study Collaborative Research Group. N Engl J Med 340: 14-22.
- Lorenz MW, Markus HS, Bots ML, Rosvall M, Sitzer M, et al. (2007) Prediction of clinical cardiovascular events with carotid intima-media thickness: a systematic review and meta-analysis. Circulation 115: 459-467.
- Polak JF, Pencina MJ, Pencina KM, O’Donnell CJ, Wolf PA, et al. (2011) Carotid-wall intima-media thickness and cardiovascular events. N Engl J Med 365: 213-221.
Citation: Mombelli G, Castelnuovo S, Pavanello C, Bosisio R, Baldassarre D, et al. (2015) QT Intervals Correlate with Carotid Artery Intima Media Thickness in a Gender-Specific and Segment-Specific Manner in Asymptomatic Dyslipidemic Patients. J Cardiol Stud Res 2: 005.
Copyright: © 2015 Giuliana Mombelli, et al. This is an open-access article distributed under the terms of the Creative Commons Attribution License, which permits unrestricted use, distribution, and reproduction in any medium, provided the original author and source are credited.