Raising Burden of NCD Risk Factors in Rural and Remote areas of South Andaman Islands in India
*Corresponding Author(s):
Manjunatha RamuIndian Council Of Medical Research (ICMR) – Regional Medical Research Centre (RMRC), Port Blair, Andaman And Nicobar Islands, India
Email:r.manjunatha@icmr.gov.in / manjunatha80@yahoo.co.in
Abstract
Introduction: Risk factors of Non-Communicable diseases (NCDs) is showing increase in trends in recent years in India, and its burden and associated factors need to be studied in Andaman and Nicobar Islands.
Methods: A Community based cross-sectional study was conducted in rural areas of South Andaman Islands with a sample size of 295.
Results: 28.8% of participants were known hypertensives, among them 44.19% were irregular in treatment, 21.7% of participants were known diabetics, and among them 16.92% were irregular in treatment. Undiagnosed hypertension (19%) and type – 2 diabetes mellitus (4.1%) found to be high. 67.1% were overweight / obese. Men are having higher chances (AOR: 58.55, 95% CI: 7.86 – 435.85) of smoking, using smokeless tobacco (AOR: 3.101, 95% CI: 1.836 – 5.235) and higher chances of consuming alcohol (AOR: 25.9, 95% CI: 9.649 – 69.517) as compared to women (P<0.01). Participants with no formal education and Primary education had 08 times (AOR: 8.875, 95% CI: 2.258 – 34.878) and 05 times (AOR: 5.249, 95% CI: 1.521 – 18.113) higher chance of using smokeless tobacco products respectively (P < 0.01)
Conclusion: NCD risk factors are high, undiagnosed hypertension and diabetes, irregular treatment are factors of public health concern. Regular screening for NCD risk factors should be enhanced to address these public health concerns.
Keywords
Adult; Andaman; Non-communicable; Risk; Rural
Introduction
WHO describes Non Communicable Diseases (NCDs), as “chronic diseases, tend to be of long duration and are the result of a combination of genetic, physiological, environmental and behavioral factors” [1]. Globally, NCDs are responsible for deaths of 41 million people each year which sums up to 74% of all deaths. Low- and middle-income countries are more affected, where more than three quarters of Global NCD deaths (31.4 million) occur. NCDs are often associated with older age groups; according to WHO factsheets, 17 million NCD deaths occur before the age of 70 years, and among these premature deaths, 86% are estimated to occur in low- and middle-income countries. People of all age groups including Children, adults and the elderly are all vulnerable to the risk factors of NCDs including unhealthy diets, physical inactivity, smoking, use of smokeless tobacco products or the harmful use of alcohol [1]. An important way to control NCDs is to focus on reducing the risk factors associated with these diseases [1].
NCDs contribute to around 5.87 million deaths annually in India which account for around 60 % of all deaths in the Country. It is important to note that India shares more than two-third of the total deaths due to NCDs in the South-East Asia Region (SEAR) of WHO [2]. As measured through surveys of NFHS-4 (2015-16) and NFHS–5 (2019-20), data related to risk factors of NCDs is showing increase in trends of its risk factors in recent years, and same is the trend in Andaman and Nicobar Islands, which is still on a higher side especially in rural areas [3,4], and the data is worrisome while we compare it with National averages in India.
With increase in risk factors and increased burden of NCDs, people are facing double burden of both Communicable and Non-Communicable diseases [5]. Very few studies have been undertaken in India on estimations and surveillance of NCD risk factors, with most of the studies being conducted in main land of India, evidences from Andaman and Nicobar Islands are not much available [6]. These Islands are union territory of India consisting of 836 Islands/Islets/Rocky Outcrops, of which 38 are inhabited; these Islands are unique as they are situated in the South-Eastern part of Bay of Bengal and around 1200 km away in the ocean from the mainland of India [7].
Healthcare delivery for these Islands is of challenging nature because of the rural and remote nature of the geographical locations of these Islands [6]. This study was conducted with an aim to study NCD risk factors using modified WHO STEPS Surveillance Questionnaire in rural areas of South Andaman Islands, WHOs STEP wise approach [8], is an established tool which helps us to understand the risk factors for NCD’s using scientifically validated tools for Verbal screening/ Physical measurements/ Biochemical methods to study the NCD risk factors, and this study is conducted using this validated research tool among adult population in rural areas of South Andaman Islands.
Methods
A Community based cross-sectional study was conducted in rural areas of South Andaman Islands between October 2021 to November 2022, sample size was calculated by using the formula for estimation of proportion for one sample situation to detect prevalence of 24.95% of Hypertension among adults [4], the minimum sample size required was 288 with allowable error of 05%. Ethical approval was taken from Institutional Human Ethics Committee of ICMR -Regional Medical Research Centre, Port Blair.
Out of 99 revenue villages in the South Andaman District, 08 villages were purposively selected in consultation with the Gram Panchayats, and in these villages, consecutive house to house visits were carried out by front line health functionaries, and adults aged ≥ 18 years who were willing to provide informed consent and participate in the study from those localities were recruited for the study. Seriously ill and bed ridden individuals were excluded from the study. Written informed consent was obtained from the participants and data was collected using a predesigned, pretested, structured, modified version of WHO STEPS Surveillance Questionnaire.
Personal interviews, physical measurements and biochemical tests were carried out by a team of trained experts with support from local Gram Panchayat institutions. STEPS 1 included information on Socio-demographic variables, smoking, smokeless tobacco use, alcohol consumption, salt consumption, consumption of fruits / vegetables, physical activity, and information on known status of hypertension and diabetes, and management of those conditions. Information on cervical cancer screening for women was collected. In STEPS 2, height, weight, and blood pressure were measured. Digital weighing machine and Stadiometer were used to measure weight and height, respectively. Body Mass Index (BMI) was then calculated using information on weight and height. Pregnant women were excluded from measurements of height and weight. Blood pressure was measured using digital automatic blood pressure monitor. In STEPS 3, Random Blood Sugar levels were measured using a digital Glucometer, with all standard biomedical safety precautions. Data analysis was conducted using SPSS Version 28.0 software.
Results
A total of 295 respondents participated in the study, mean age was 48.7 + 15.16 years, mean age of men and women are 50.69+15.81 and 47.20 + 14.51 years respectively, with a range of 19 to 88 years. More than half of the respondents were women (56.9%). Majority of the study participants were married (79.3%), living in nuclear families (58%), 20% had no formal education, and majority were from lower socioeconomic class (>80%), and 31.5% were from backward castes.
Tables 1 & 2 shows the behavioural risk factors of the NCDs, 11.5% were ever smokers (26% of men and 0.6% of women), and 4.4% of them self-reported that they smoke regularly. Smokeless tobacco consumption is found to be high (40.3%) (54.3% of men and 29.8% of women), 40.2% of men and 22.6% of women self-reported that they use smokeless tobacco products regularly. 22% were ever users of alcoholic beverages (47.2% of men and 03% of women), and 35.4% of men and 1.8% of women self-reported that they consume alcoholic beverages regularly.
|
Characteristics |
Respondents |
Frequency |
% |
|
Sex |
Male |
127 |
43.1% |
|
Female |
168 |
56.9% |
|
|
Age |
18 - 29 |
35 |
11.9% |
|
30-44 |
89 |
30.2% |
|
|
45-59 |
82 |
27.8% |
|
|
> 60 |
89 |
30.2% |
|
|
Religion |
Hindu |
235 |
79.7% |
|
Muslim |
34 |
11.5% |
|
|
Christian |
26 |
8.8% |
|
|
Caste background |
General |
201 |
68.1% |
|
Backward |
93 |
31.5% |
|
|
Refused |
1 |
0.3% |
|
|
Education |
No formal schooling |
59 |
20.0% |
|
Less than primary school |
36 |
12.2% |
|
|
Primary school completed |
74 |
25.1% |
|
|
Secondary school completed |
56 |
19.0% |
|
|
High school completed |
49 |
16.6% |
|
|
College / University completed |
14 |
4.7% |
|
|
Post graduate degree |
7 |
2.4% |
|
|
Marital status |
Never married |
25 |
8.5% |
|
Currently married |
234 |
79.3% |
|
|
Separated |
5 |
1.7% |
|
|
Widowed |
30 |
10.2% |
|
|
Type of family |
Nuclear |
171 |
58.0% |
|
Joint |
123 |
41.7% |
|
|
Extended |
0 |
Nil |
|
|
Job status |
Government employee |
19 |
6.4% |
|
Non - Government employee |
67 |
22.7% |
|
|
Self - employed |
62 |
21.0% |
|
|
Student |
3 |
1.0% |
|
|
Home maker |
116 |
39.3% |
|
|
Retired |
23 |
7.8% |
|
|
Unemployed (able to work) |
2 |
0.7% |
|
|
Unemployed (unable to work) |
3 |
1.0% |
|
|
Socio - economic status [Per capita income (in INR) per month] (As per modified BG Prasad’s classification, 2021) |
>= 7863 |
16 |
5.4% |
|
3931 - 7862 |
14 |
4.7% |
|
|
2359 - 3930 |
15 |
5.1% |
|
|
1179 - 2358 |
89 |
30.2% |
|
|
<1179 |
158 |
53.6% |
Table 1: Socio - demographic Profile of the respondents.
|
Characteristic |
Frequency |
Percentage |
|
|
Ever Smoker |
Yes |
34 |
11.5% |
|
No |
261 |
88.5% |
|
|
Ever user of Smokeless tobacco |
Yes |
119 |
40.3% |
|
No |
176 |
59.7% |
|
|
Ever Alcohol user |
Yes |
65 |
22.0% |
|
No |
230 |
78.0% |
|
|
Exercises for health reasons |
Yes |
80 |
27.1% |
|
No |
215 |
72.9% |
|
|
Salt intake |
Too much |
58 |
19.7% |
|
Just the right amount |
170 |
57.6% |
|
|
Too little |
58 |
19.7% |
|
|
Far too little |
9 |
3.1% |
|
|
Consumption of fruits per week |
< = 2 times per week |
128 |
43.4% |
|
3 - 5 times per week |
68 |
23.1% |
|
|
> = 6 times per week |
99 |
33.6% |
|
|
Consumption of Vegetables per week |
< = 2 times per week |
22 |
7.5% |
|
3 - 5 times per week |
32 |
10.8% |
|
|
> = 6 times per week |
241 |
81.7% |
|
Table 2: Behavioral risk factors of NCDs.
Only 27.1% reported that they exercise regularly for health reasons which included even walking for health reasons. 57.6% reported that they use right amount of salt in their diet, and 19.7% of the respondents self-reported that they consume an excess amount of salt in their diet. 43.4% reported that they consume fruits less than 02 times per week, and majority (81.7%) reported that they consume vegetables more than 06 times per week.
Table 3, shows the clinical risk factors of NCDs, 28.8% of participants were known hypertensives, among them 44.19% self-reported that they are irregular in taking treatment for hypertension. 19% of the participants were newly detected with hypertension during this study, as per the definition provided in NFHS – 5 surveys [4] and they were not on any treatment as they were unaware of the condition. Overall proportion of hypertension (Known + newly detected) was found to be very high (47.8%). 21.7% of participants reported that they are known diabetics, and among them 16.92% self-reported that they are irregular in taking treatment for diabetes. 4.1% of participants were newly detected with elevated levels of Random Blood Sugar (> 200mg/ dl) during this study. Overall proportion of diabetes (known + newly detected) was found to be 23.1%. Only 5.41% of women were ever screened for cervical cancer in their lifetime. Study of Body Mass Index showed that majority (67.1%) of the participants were detected with overweight / Obesity (66.9% of men and women 67.7% of women).
|
|
Frequency |
Percentage |
|
|
Known hypertensive |
Yes |
85 |
28.8% |
|
No |
210 |
71.2% |
|
|
HTN on regular treatment (n=86) |
Regular |
48 |
55.81% |
|
Irregular |
38 |
44.19% |
|
|
Known diabetic |
Yes |
64 |
21.7% |
|
No |
231 |
78.3% |
|
|
Diabetic on regular treatment (n=65) |
Regular |
54 |
83.08% |
|
Irregular |
11 |
16.92% |
|
|
Women, ever screened for cervical cancer (n=185) |
Yes |
10 |
5.41% |
|
No |
160 |
86.49% |
|
|
Don't know |
15 |
8.11% |
|
|
First time diagnosed with HTN |
Yes |
56 |
19% |
|
No |
239 |
81% |
|
|
First time diagnosed with Diabetes |
Yes |
12 |
4.1% |
|
No |
283 |
95.9% |
|
|
BMI Classification |
Underweight |
26 |
8.8% |
|
Normal |
70 |
23.7% |
|
|
Overweight |
65 |
22.0% |
|
|
Pre - obese |
99 |
33.6% |
|
|
Obese |
34 |
11.5% |
|
|
Overall Hypertensive (Known Hypertensives + newly detected Hypertensives) |
Hypertensive |
141 |
47.8% |
|
Normotensive |
154 |
52.2% |
|
|
Overall Diabetic (Known Diabetics + newly detected Diabetics) |
Diabetic |
68 |
23.1% |
|
Non - diabetic |
227 |
76.9% |
|
Table 3: Clinical risk factors of NCDs.
Operationalization of variables
Hypertension: Elevated blood pressure (Systolic ≥140 mm of Hg and/or Diastolic ≥90 mm of Hg) or taking medicine to control blood pressure (%)
Diabetes: RBS = 200 mg/dl or above or taking medicines to control blood sugar levels
Obesity / Overweight was found to be high among participants of higher socioeconomic status while compared with people of lower socioeconomic status (Figure 1), and these differences are found to be statistically significant (P < 0.01).
 Figure 1: Relationship between Obesity / Overweight with Socioeconomic status.
Multiple logistic regression analysis: Only those variables which showed significant relationship with NCD risk factors in bivariate analysis were considered for multiple logistic regression analysis.
Tables 4 & 5 shows the multiple logistic regression analysis showing factors associated with smoking. Men are having 58 times higher chances (AOR: 58.55, 95% CI: 7.86 – 435.85) of smoking as compared to women (P < 0.01)
Table 05 shows the multiple logistic regression analysis showing factors associated with use of smokeless tobacco. Men have 03 times higher chances of using smokeless tobacco (AOR: 3.101, 95% CI: 1.836 – 5.235) as compared to women (P < 0.01). Participants with no formal education and Primary education had 08 times (AOR: 8.875, 95% CI: 2.258 – 34.878) and 05 times (AOR: 5.249, 95% CI: 1.521 – 18.113) higher chance of using smokeless tobacco products respectively (P < 0.01) as compared with participants those who had college / University education. Participants who belong to backward castes have higher chances of using smokeless tobacco as compared with others (P < 0.01)
|
Smoking |
|||||
|
|
Yes |
No |
Odds ratio |
95% CI |
P value |
|
Gender |
|
|
|
|
|
|
Male |
33 (26%) |
94 (74%) |
58.55 |
(7.86 - 435.85) |
0.000 |
|
Female |
1 (0.6%) |
167 (99.4%) |
1 |
|
|
|
Caste background |
|
|
|
|
|
|
General caste |
18 (9%) |
183 (91%) |
0.495 |
(0.223 - 1.098) |
0.084 |
|
Backward caste |
16(17.2) |
77 (82.8%) |
1 |
|
|
Table 4: Multiple Logistic Regression showing factors associated with smoking
|
Smokeless tobacco user |
|||||
|
|
Yes |
No |
Odds ratio |
95% CI |
P value |
|
Gender |
|
|
|
|
|
|
Male |
69 (54.3%) |
58 (45.7%) |
3.101 |
(1.836 5.235) |
0.000 |
|
Female |
50 (29.8%) |
118 (70.2%) |
1 |
|
|
|
Age group
|
|
|
|
|
|
|
18 - 29 years |
8 (22.9%) |
27 (77.1%) |
0.952 |
(0.333 2.724) |
0.926 |
|
30 - 44 yearsQ |
32 (36%) |
57 (64%) |
1.348 |
(0.658 2.761) |
0.415 |
|
45-59 years |
39 (47.6%) |
43 (52.4%) |
1.989 |
(0.996 3.973) |
0.051 |
|
> = 60 years |
40 (44.9%) |
49 (55.1%) |
1 |
|
|
|
Educational status |
|
|
|
|
|
|
No formal education |
30 (50.8%) |
29 (49.2%) |
8.875 |
(2.258 34.878) |
0.002 |
|
Primary school |
52 (47.3%) |
58 (52.7%) |
5.249 |
(1.521 18.113) |
0.009 |
|
Secondary school |
33 (31.4%) |
72 (68.6%) |
2.563 |
(0.749 8.768) |
0.134 |
|
College / University education |
4 (19%) |
17 (81%) |
1 |
|
|
|
Caste background |
|
|
|
|
|
|
General |
71 (35.3%) |
130 (64.7%) |
0.398 |
(0.227 0.700) |
0.001 |
|
Backward caste |
47 (50.5%) |
46 (49.5%) |
1 |
|
|
Table 5: Multiple Logistic Regression showing factors associated with smokeless tobacco use.
Table 6 shows the multiple logistic regression analysis showing factors associated with the consumption of alcohol, men have 25 times higher chances (AOR: 25.9, 95% CI: 9.649 – 69.517) of consuming alcohol as compared with women (P < 0.01). Participants who belonged to upper class of socioeconomic status have higher chances of being overweight / obese as compared with those who belonged to lower socioeconomic status.
|
Consumption of alcohol |
|||||
|
|
Yes |
No |
Odds ratio |
95% CI |
P value |
|
Gender |
|
|
|
|
|
|
Male |
60 (47.2%) |
67 (52.8%) |
25.900 |
(9.649 69.517) |
0.000 |
|
Female |
5 (3%) |
163 (97%) |
1 |
|
|
|
Socio - economic status |
|
|
|
|
|
|
>= 7863 |
8 (50%) |
27 (77.1%) |
0.952 |
(0.333 2.724) |
0.926 |
|
3931 - 7862 |
5 (35.7%) |
57 (64%) |
1.348 |
(0.658 2.761) |
0.415 |
|
2359 - 3930 |
3 (16.7%) |
43 (52.4%) |
1.989 |
(0.996 3.973) |
0.051 |
|
1179 - 2358 |
17 (19.1%) |
49 (55.1%) |
1 |
|
|
|
<1179 |
32 (20.3%) |
126 (79.7%)
|
1 |
|
|
|
Marital status |
|
|
|
|
|
|
Never married |
11 (44%) |
14 (56%)
|
2.415 |
(0.344 16.947) |
0.375 |
|
Currently married |
52 (22.1%) |
183 (77.9%)
|
1.412 |
(0.245 8.129) |
0.699 |
|
Widow / Separated |
2 (5.7%) |
33 (94.3%)
|
2.563 |
(0.749 8.768) |
0.134 |
|
College / University education |
4 (19%) |
17 (81%) |
1 |
|
|
Table 6: Multiple logistic regression showing factors associated with consumption of alcohol.
Participants with younger age group are less likely to have hypertension as compared with elderly participants (age group >= 60 years), and being an elderly person is strongly associated with hypertension (P < 0.01) (Tables 7 & 8), similarly participants with lower / normal BMI are less likely to have hypertension (AOR: 0.310, 95% CI 0.170 – 0.563) as compared with participants who are overweight / obese (Figure 2).
|
BMI |
|||||
|
|
Underweight / Normal |
Overweight / Obese |
Odds ratio |
95% Confidence Interval |
P value |
|
Socio - economic status |
|
|
|
|
|
|
>= 7863 |
3 (18.8%) |
13 (81.3%) |
0.382 |
(0.103 1.423) |
0.152 |
|
3931 - 7862 |
3 (21.4%) |
11 (78.6%) |
0.407 |
(0.108 1.530) |
0.183 |
|
2359 - 3930 |
5 (27.8%) |
13 (72.2%) |
0.599 |
(0.201 1.787) |
0.358 |
|
1179 - 2358 |
19 (21.3%) |
70 (78.7%) |
0.388 |
(0.213 0.708) |
0.002 |
|
<1179 |
66 (42%) |
91 (58%) |
1 |
|
|
|
Caste background |
5 (35.7%) |
57 (64%) |
1.348 |
(0.658 2.761) |
0.415 |
|
General caste |
74 (37%) |
126 (63%) |
1.714 |
(0.963 3.053) |
0.067 |
|
Backward caste |
22 (23.7%) |
71 (76.3%) |
1 |
|
|
Table 7: Multiple logistic regression showing factors associated with Body Mass Index (BMI).
|
Hypertension |
|||||
|
|
Yes |
No |
Odds ratio |
95% CI |
P value |
|
Age group |
|
|
|
|
|
|
18 - 29 years |
3 (8.6%) |
32 (91.4%) |
0.028 |
(0.008 0.103) |
0.000 |
|
30 - 44 years |
28 (31.5%) |
61 (68.5%) |
0.117 |
(0.058 0.236) |
0.000 |
|
45 - 59 years |
42 (51.2%) |
40 (48.8%) |
0.270 |
(0.135 0.538) |
0.000 |
|
> = 60 years |
68 (76.4%) |
21 (23.6%) |
|
|
|
|
BMI |
|
|
|
|
|
|
Underweight / Normal |
31 (32.3%) |
65 (67.7%) |
0.310 |
(0.170 0.563) |
0.000 |
|
Overweight / Obese |
110 (55.6%) |
88 (44.4%) |
|
|
|
Table 8: Multiple logistic regression showing factors associated with hypertension.
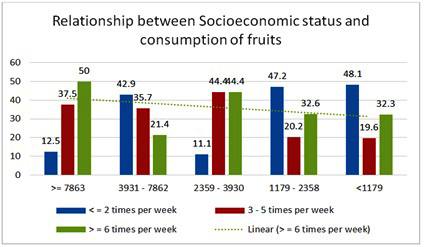 Figure 2: Relationship between socioeconomic status and consumption of fruits.
Participants with lower socioeconomic status have lesser frequency of fruits consumption per week and these differences are found to be statistically significant (P = 0.017)
Discussion
In a cross-sectional study conducted by Sanjay Kinra, and team on Sociodemographic patterning of non-communicable disease risk factors in rural India [9] ; it was concluded that the prevalence of most of the risk factors was generally high across a range of socio-demographic groups among rural villagers in India; in particular, the prevalence of tobacco use among men and obesity among women was striking, in our study we found that both smoke and smokeless tobacco use is very high among men, high proportion of obesity was found (67.1%), but we have not found much difference in occurrence of obesity between men (66.9%) and women (67.7%). In their study, low fruit and vegetable consumption (69% (66% to 71%) men, 75% (71% to 78%) women) was observed, in our study fruits consumption was found to be lower than this, only 33.6% of the participants consume fruits on more than 05 times per week. Vegetable intake was comparatively high as 81.7% of the participants reported that they consume vegetables on more than 06 times per week; Sanjay Kinra and team reported that obesity among women of higher socioeconomic status was high while compared with women of lower socioeconomic status, we found a similar pattern of obesity among both men and women; in their study, 20% were detected with hypertension, where as in our study we found a very high proportion of hypertension at 47.8% (Known Hypertensives + newly detected Hypertensives), and hypertension was found to be high even among people with lower socioeconomic status; It is striking to document in our study that we have found 16.5% of men and 20.8% of women detected with hypertension for the first time. This higher level of proportions of hypertension could be because of the fact that, our sample is restricted only to rural areas where it is already a known fact that hypertension and some of the CVD risk factors were found to be high while compared with urban areas of Andaman and Nicobar Islands [4,6].
Only 06% were detected with diabetes in their study [9], where as in our study we found a very high proportion of diabetes (23.1%) (Known Diabetics + newly detected Diabetics). In our study, we detected 4.7% of men and 3.6% of women with highly elevated levels of random blood sugar (> 200 mg/dl) for the first time and included them as diabetics by using operational definition for diabetes from the American Diabetes Association (CDC, USA) [6], making overall proportion of diabetes high at 23.1% (20.5% of men and 25% of women).
A study conducted by Manoj Mahajan and team [10], on Noncommunicable Diseases Among Rural Women in India, with a purpose to recognize the burden of NCDs and to asses Knowledge, attitude and practices of rural women, it was revealed that the Self-reported diagnosis of hypertension and diabetes was significantly lower than the reported National prevalence, where as in our study we have found a higher level of self-reported as well as overall (including self-reported and newly detected ones) level of hypertension and diabetes through our study.
It was concluded in a study conducted by Aonungdok Tushi, and group [11], on Prevalence of risk factors for non-communicable diseases in a rural tribal population of Mokokchung, Nagaland, India, high prevalence of behavioural risk factors for NCDs and of hypertension was observed in rural tribal people in Nagaland. In this study even though the percentage of smokers were more among men, the use of smokeless tobacco was common among both males (58.9%) and females (49.6%), in our study we found a slightly lower proportion of use of smokeless tobacco among women, we report that 54.3% of men and 29.8% of women were using smokeless tobacco.
In a cross-sectional study conducted by Aswathy Sand group [12] on Cervical cancer screening: Current knowledge & practice among women in a rural population of Kerala, India, only half of the study population was aware of symptoms and the majority (89.2%) were unaware of the risk factors for cervical cancer, only 6.9 per cent had ever done the Pap test, we found almost a similar type of result, Another study conducted by Sandeep Singh and Sorabh Badaya [13], on Factors Influencing uptake of Cervical Cancer Screening among Women in India, it was reported that only 11.62% underwent at least one cervical screening in their life time, in our result only 5.41% of women have undergone screening test for cervical cancer in their life time.
In a study conducted by K. Premanandh, and group [14-16] to predict 10-year cardiovascular risk using WHO/ISH risk prediction chart in Salem, it was found that the level of physical activity was insufficient among 48.36% of males and 76.22% of females. Females were more inactive than males; in our study we found that only 32.3% of men and only 23.2% of women do any exercise for health reasons, and in our enquiry we have even considered walking for health reasons as a physical activity for health reasons.
Conclusion
High burden of behavioural and clinical risk factors for NCDs exists among adult population in rural areas of South Andaman Islands, especially among men, and elderly people. Elderly age, male gender, socioeconomic status, illiteracy, lower level of education, belonging to backward caste is the factors associated with NCD risk factors. Undiagnosed hypertension and type – 2 diabetes mellitus, irregular treatment are factors of public health concern. Increasing regular screening activities for NCD risk factors, IEC / IPC activities to mitigate those risk factors and regular care for clinical risk factors should be enhanced to address these public health concerns in South Andaman Islands.
Conflicts of interest
None
Funding
Intramural funds from ICMR – Regional Medical Research Centre, Port Blair
Acknowledgements
The authors are thankful for the Pradhans, Members and staff of Gram Panchayat institutions of these villages - Guptapara, Naya shehar, Humfrigunj, Wandoor, Bambooflat, Calicut, Beodnabad and Chouldari.
References
- https://www.who.int/news-room/fact-sheets/detail/noncommunicable-diseases
- https://www.who.int/docs/default-source/searo/india/health-topic-pdf/noncommunicable-diseases/ncd-situation-global-report-ncds-2014.pdf?sfvrsn=ee0a9307_2#:~:text=Four%20behavioural%20risk%20factors%20are,raised%20blood%20total%20cholesterol%20levels.
- https://dhsprogram.com/pubs/pdf/fr339/fr339.pdf
- http://rchiips.org/nfhs/factsheet_NFHS-5.shtml
- Mohan P, Mohan SB, Dutta M (2019) Communicable or Noncommunicable diseases? Building strong primary health care systems to address double burden of disease in India. J Family Med Prim Care 8: 326-329.
- Ramu M (2022) A Letter on Evidences for Action on CVD Risk Factors in Andaman and Nicobar Islands, India. International Journal of Medical Science and Health Research 4: 83-88.
- https://www.andaman.gov.in/about
- https://www.who.int/docs/default-source/gho-documents/world-health-statistic-reports/world-health-statistics-2015.pdf
- Kinra S, Bowen LJ, Lyngdoh T, Prabhakaran D, Reddy KS, et al. (2010) Sociodemographic patterning of non-communicable disease risk factors in rural India: A cross sectional study. BMJ 27: 4974.
- Mahajan M, Naik N, Jain K, Patira N, Prasad S, et al. (2019) Study of Knowledge, Attitudes, and Practices Toward Risk Factors and Early Detection of Noncommunicable Diseases Among Rural Women in India. J Glob Oncol 5: 1-10.
- Tushi A, Rao SR, Pattabi K, Kaur P (2018) Prevalence of risk factors for non-communicable diseases in a rural tribal population of Mokokchung, Nagaland, India. Natl Med J India 31: 11-14.
- Aswathy S, Quereshi MA, Kurian B, Leelamoni K (2012) Cervical cancer screening: Current knowledge & practice among women in a rural population of Kerala, India. Indian J Med Res 136: 205-210.
- Singh S, Badaya S (2012) Factors Influencing uptake of Cervical Cancer Screening among Women in India: A Hospital based Pilot Study. J Community Med Health Educ 2: 157.
- Premanandh K, Shankar R (2018) Predicting 10-year cardiovascular risk using WHO/ISH risk prediction chart among urban population in Salem. International Journal of Community Medicine and Public Health 5: 5228-5234.
- District fact sheet for South Andaman, National Family Health Survey-5 (2019-20) Ministry of Health and Family welfare (MOHFW) Government of India.
- https://www.cdc.gov/diabetes/basics/getting-tested.html
Citation: Ramu M, Ghoshal SR, Biji S, Saida K, Mandal A, et al. (2023) Raising Burden of NCD Risk Factors in Rural and Remote areas of South Andaman Islands in India. J Community Med Public Health Care 10: 123.
Copyright: © 2023 Manjunatha Ramu, et al. This is an open-access article distributed under the terms of the Creative Commons Attribution License, which permits unrestricted use, distribution, and reproduction in any medium, provided the original author and source are credited.