Reduced Proportion of CD39+ Treg Cells Correlates with the Development of Primary Biliary Cholangitis in Patients and a Murine Model
*Corresponding Author(s):
Tingwang JiangDepartment Of Key Laboratory, The Second People’s Hospital Of Changshu, The Affiliated Changshu Hospital Of Xuzhou Medical University, Changshu, China
Tel:+86 15995921425,
Email:jtwgyp@163.com
Abstract
Primary Biliary Cholangitis (PBC) is a chronic autoimmune cholestatic liver disease. This study investigated changes of adenosine metabolism pathway related molecules and their contribution to inflammatory injury in PBC. Clinical results showed that the concentrations of alanine Aminotransferase (ALT), Aspartate Aminotransferase (AST), Alkaline Phosphatase (ALP) and g-Glutamyl Transferase (GGT) in serum of 64 PBC subjects increased compared with 60 Healthy Controls (HC). The proportion of CD39+CD4+ cells was decreased in PBMCs from PBC patients in comparsion to HC. Moreover, the proportion of CD39+ Treg cells in PBMCs from PBC patients also significantly decreased in comparsion to HC. A PBC murine model results showed that, compared with the normal mice, the concentrations of ALT, AST and GGT in serum significantly increased induced by polyinosinic-polycytidylic acid (poly I:C). Histopathology result revealed that poly I:C induced liver inflammation in mice. The proportion of CD39+ cells in PBMCs from poly I:C-treated mice was decreased compared with the normal mice. Meanwhile, the proportions of CD39+CD4+ cells and CD39+Treg cells were markedly reduced in poly I:C-induced mouse spleen. Finally, poly I:C significantly induced a global reduction of CD39 and adenosine receptor A2a expression in mouse liver. In addition, poly I:C treatment didn’t alter the proportions of CD39+CD8+ and CD39+CD19+ cells in mouse liver. In conclusion, our results suggest that the proportion of CD39+ Treg cells decreasing in PBC patients and animal model are closely associated with the disease progression. Our study offers a novel perspective on the role of adenosine metabolism pathway in PBC pathogenesis.
Keywords
Animal model; CD39; Patient; Primary biliary cholangitis; Regulatory T cells
Abbreviations
PBC: Primary Biliary Cholangitis
ALT: Alanine Aminotransferase
AST: Aspartate Aminotransferase
ALP: Alkaline Phosphatase
GGT: g-Glutamyl Transferase
HC: Healthy Controls
UDCA: Ursodeoxycholic Acid
NAFLD: Nonalcoholic Fatty Liver Disease
AASLD: American Association for the Study of Liver Diseases
AIH: Autoimmune Hepatitis
PBMCs: Peripheral Blood Mononuclear Cells
BSA: Bovine Serum Albumin
Introduction
Primary Biliary Cholangitis (PBC) is a chronic autoimmune cholestatic liver disease. It results from a progressive damage of the small intrahepatic bile ducts, which results in scarring, inflammation, fibrosis and cirrhosis [1]. As a secondary bile acid, Ursodeoxycholic Acid (UDCA) is a metabolic by-product by intestinal bacteria and the most frequently used nonsurgical treatment of cholesterol gallstones and PBC [2]. Although it exists hepatoprotective effects, 30% to 40% of PBC patients respond poorly to UDCA therapy [3]. The previous study has reported that treatment with 600 mg/day UDCA for 2 years or 800 IU/day vitamin E effectively ameliorate liver function in Nonalcoholic Fatty Liver Disease (NAFLD) patients [4,5]. However, the therapeutic effects of UDCA in liver disease are still undefined. So far, there are no exhaustive studies to reveal the efficacy of UDCA in liver disease. Therefore, it is much important to identify significantly changed endogenous genes and factors, which may help to elucidate the etiopathogenesis of PBC and acquire a good curative.
Regulatory T (Treg) cells as a subpopulation of T cells have a profound function in the control of self-tolerance to self-antigens, preventing autoimmune disease and inflammatory responses [6]. Treg cells mainly derived from the thymus and a substantial Treg cells are from the periphery. Treg cells are thought to be derived from naïve CD4+ cells and express biomarkers CD4, CD25 and Foxp3 [7]. It is well known that the liver is the metabolic center of the organism and an important source of peripherally derived Tregs [8]. Many studies have revealed the importance and role of Treg cells in the liver. For example, imbalance between Foxp3+ Treg cells and Th1/Th17/Th22 cells in patients contributed to the pathogenic process of Autoimmune Hepatitis (AIH) [9]. In addition, the recent study showed that the low dose IL-12 treatment increased sensitivity of Treg cells from patients with PBC to drive their differentiation into IFN-g secreting cells [10].
Ectonucleoside Triphosphate Diphosphohydrolase-1 (NTPDase1) also known as CD39 (cluster of differentiation 39), is an integral membrane protein with an extracellular catalytic site [11]. It catalyzes the hydrolysis of phosphoric acid residues of triphosphate and diphosphate to form nucleoside monophosphate derivatives as the final product [12]. CD39 as an important purinergic signal molecule participates in the process of energy metabolism and various inflammatory diseases [13]. It has been reported that pro-inflammatory cytokines, hypoxia and oxidative stress regulated CD39 expression in cortical astrocytes and immune cells. The mechanism involved in several transcription factors such as Sp1 and Stat3 [14-16]. However, the role of CD39 in the pathogenesis of PBC remains unknown. In this study, we investigated the expression of CD39 in Treg cells obtained from PBC patients. Moreover, a PBC animal model was used to confirm the population of CD39+ Treg cells in poly I:C-induced liver injury in mice. It was found that reduced the population of CD39+ Treg correlates with the development of PBC in patients and a murine model.
Materials And Methods
PBC patients and healthy controls
The study involved subjects (PBC patients and healthy controls) recruited from Department of Scientific Research and Microbiology and Changshu Institution for Laboratory Medicine (Changshu, Jiangsu Province, China) between 2016 and 2017. There was no significant difference in age and gender between PBC and the healthy control. The PBC patients were diagnosed according to the American association for the study of liver diseases (AASLD) practice guideline when two of the following three criteria are met: (1) Biochemical evidence of cholestasis based mainly on alkaline phosphatase elevation; (2) Presence of AMA; (3) Histologic evidence of nonsuppurative destructive cholangitis and destruction of interlobular bile ducts [17]. The experimental protocol was approved by the Ethics Committee of Institute of Laboratory Medicine of Changshu. An informed written consent was obtained from each patient. The diagnosis of cirrhosis was based on liver biopsy and all patients were treatment naive. Exclusion criteria included individuals infected with hepatitis virus or other inflammatory diseases. The healthy controls had no medical history of any liver disease or other diseases.
PBC animal model
Adult 6-8 weeks old C57BL/6J male mice were purchased from the Laboratory Animal Center of Jiangsu University (Zhenjiang, China), and maintained with free access to pellet food and water under controlled conditions (22°C, 55% humidity, 12 h day/night). All animals received adequate care in compliance with laboratory practice guidelines and the experimental protocol was approved by the Ethics Committee of Jiangsu University. For PBC animal model, mice were injected with 5 mg/kg poly I:C or normal saline twice per week for 16 weeks, according to the previous study [18]. At week 16, mice were sacrificed by cervical dislocation. Liver tissues were fixed in 10% formalin solution. Serum and tissue samples were stored at -80°C. The serum concentrations of Alkaline Phosphatase (ALP), Aspartate Aminotransferase (AST), Alanine Aminotransferase (ALT) and g-Glutamyl Transferase (GGT) were measured by commercial kits (Nanjing Jiancheng bioengineering institute, Nanjing, China).
Histopathology
Formalin-fixed liver tissues were embedded by paraffin and sections were cut into 5 μm slices. The sections were deparaffinized in xylene, dehydrated in ethanol, rehydrated in distilled water and subjected to Hematoxylin and Eosin (H&E). The images of liver sections were read, in blinded fashion, by a single pathologist. The clinical scores were evaluated as described previously with some modification. 0 = occasional inflammatory cells infiltration; 1= mild inflammation; 2 = inflammation with fibrosis.
Flow cytometry
Briefly, peripheral blood was collected from patients or mice and gradient centrifuged with lymphocyte separation medium (Solarbio Life Sciences, China) to separate Peripheral Blood Mononuclear Cells (PBMCs). The cells were incubated with indicated antibodies at 4°C for 20 min. To detect the proportion of Treg cells, the cells were fixed and permeabilized with Perm/Fix solution and incubated with Foxp3 antibody. The proportions of cells were determined by flow cytometry. All staining was performed according to manufacturer’s protocols. Anti-human CD4-FITC (clone: OKT4, #317407), anti-human CD39-percp-cy5.5 (clone: A1), anti-human CD73-percp-cy5.5 (clone: AD2), isotype control PerCP/Cy5.5 mouse IgG1 (clone: MOPC-21), anti-human CD25-APC (clone: BC96), anti-human Foxp3-PE (clone: 206D), anti-mouse CD4-FITC (#100405), anti-mouse CD39-PE (clone: Duha59), anti-mouse CD73-PE (clone: TY/11.8), isotype control PE Rat IgG1(clone: RTK2071) and anti-mouse CD25-APC (3C7) antibodies were purchased from Biolegend (San Diego, CA). Anti-mouse Foxp3-FITC (clone: FJK-16s) antibody was purchased from eBioscience (Waltham, MA).
Real-time quantitative PCR (qPCR)
Total RNA from mice liver was prepared using Trizol reagent (Invitrogen, Carlsbad, CA) according to the manufacturer’s instructions. Briefly, cDNA was synthesized from 1 μg RNA using SuperScript™ II Reverse Transcriptase (Invitrogen, Carlsbad, CA). qPCR was performed using Taqman master Mix (Thermo Fisher Scientific, Waltham, MA) and ABI 7500 sequence detection system (Applied Biosystems, Foster City, CA). Data were analyzed by the 2∧(-ΔΔXt) method. Each sample was performed in triplicate and the relative mRNA expression was normalized by b-actin. The taqman primers of b-actin, CD39 and CD73 were purchased from Invitrogen (Carlsbad, CA).
Western blot
Liver samples were homogenized in RIPA buffer (25mM Tris-HCl pH 7.6, 150mM NaCl, 1% NP-40, 1% sodium deoxycholate, 0.1% SDS) containing 1 mmol/L PMSF (Cell signaling Technology, Danvers, MA). After centrifugation for 10 min, the concentration of the protein in the supernatant was determined by Pierce™ BCA Protein Assay Kit (Thermo Fisher Scientific, Waltham, MA). The protein was separated by 10 % SDS-PAGE and transferred onto a PVDF membrane. After blocking with 1.5 % bovine serum albumin (BSA) in Tris-buffered saline, the membrane was incubated with primary antibodies and horseradish peroxidase (HRP)-conjugated antibody. The bands were detected by ECL reagent (Cell Signaling Technology, MA) using western blot detect system according to the manufacturer’s instructions. Rabbit monoclonal anti-CD39 (EPR20627), rabbit polyclonal anti-CD73, mouse monoclonal anti-β-actin (mAbcam 8226), rabbit monoclonal anti-adenosine receptor A1 (EPR6179), rabbit polyclonal anti-adenosine receptor A2a, A2b and A3 antibodies were purchased from ABCAM (Cambridge, MA).
Statistical analysis
Data were analyzed using SPSS 17.0 Version and expressed as mean ± SEM. Statistical comparisons between two groups were performed using the Student t test. The p value < 0.05 was considered statistically significant.
Results
The proportion of CD39+CD4+ cells decreased in PBMCs from PBC patients
Firstly, biochemical analysis was evaluated from 64 PBC patients and 60 healthy controls. As shown in table 1, the results showed that the concentrations of ALT, AST, ALP and GGT in serum from PBC patients were significantly increased, indicating that these patients suffered from liver injury. Meanwhile, PBMCs from PBC patients and the healthy subjects were isolated and the proportion of CD39+CD4+ cells in PBMCs were detected by flow cytometry. The results showed that the proportion of CD39+CD4+ cells decreased in PBMCs from PBC patients compared to the healthy control. The proportion of CD39+CD4+ cells in PBC patients was 2.14 ± 1.31 %, while the proportion in the healthy control was 18.35 ± 3.20 %. However, there was no significant difference between PBC patients and the healthy control for proportion of CD73+CD4+ cells (Figure 1).
|
|
HC (n=60) |
PBC (n=64) |
P |
|
Age (year) |
62.3±8.8 |
59.0±11.4 |
0.422 |
|
Male/Female |
18/42 |
17/47 |
—— |
|
AST(U/L) |
19.8±4.9 |
86.3±9.0 |
<0.001 |
|
ALT(U/L) |
18.6±11.5 |
80.3±88.3 |
<0.001 |
|
GGT(U/L) |
21.0±13.3 |
270.1±204.5 |
<0.001 |
|
ALP(μmol/L) |
70.3±18.5 |
287.2±391.1 |
<0.001 |
Table 1: Clinical data of biochemical analysis on patients and healthy controls.
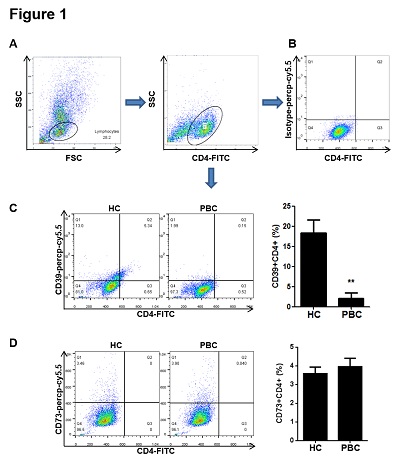 Figure 1: The proportion of CD39+CD4+ cells decreased in PBMCs from PBC patients. PBMCs were isolated from patients and the healthy controls and incubated with CD4-FITC and isotype-percp-cy5.5, CD39-percp-cy5.5 or CD73-percp-cy5.5 antibodies at 4°C for 20 min. (A) PBMCs were collected and CD4-FITC positive lymphocytes were gated for the further analysis. (B) The CD4+ lymphocytes incubated with isotype-percp-cy5.5 antibody were used as a negative control. (C-D) The proportions of CD39+CD4+ and CD73+CD4+ cells were determined by flow cytometry. Data are shown as means ± S.E.M. **p < 0.01 in comparison to the healthy control.
The proportion of CD39+ Treg cells decreased in PBMCs from PBC patients
Next, we further detected the proportion of CD39+ and CD73+ Treg cells in PBC patients. PBMCs from PBC patients and the healthy subjects were isolated and CD4+CD25+Foxp3+ cells were considered as Treg cells. As shown in figure 2, the proportion of CD39+ Treg cells in PBC patients was 2.5 ± 0.5 %, while the proportion in the healthy control was 7.8 ± 1.2 %. Compared with the healthy control, the proportion of CD39+ Treg cells significantly decreased in PBC patients. In addition, there was no significant difference between PBC patients and the healthy control for proportion of CD73+ Treg cells in PBMCs.
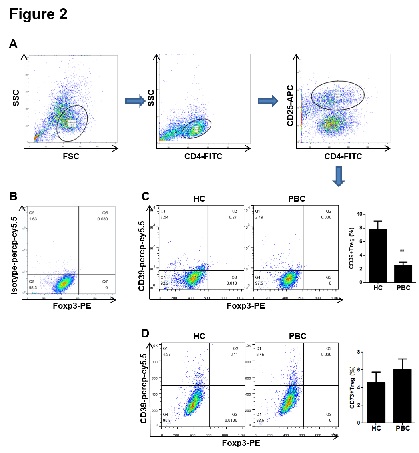 Figure 2: The proportion of CD39+ Treg cells decreased in PBMCs from PBC patients. PBMCs were isolated from patients and the healthy controls and incubated with CD4-FITC, CD25-APC, Foxp3-PE and isotype-percp-cy5.5, CD39-percp-cy5.5 or CD73-percp-cy5.5 antibodies at 4°C for 20 min. (A) PBMCs were collected and CD4+CD25+ lymphocytes were gated for the further analysis. (B) The CD4+CD25+ lymphocytes incubated with isotype-percp-cy5.5 antibody were used as a negative control. (C-D) The proportions of CD39+CD4+CD25+Fopx3+ and CD73+CD4+CD25+Fopx3+ cells were determined by flow cytometry. Data are shown as means ± S.E.M. **p < 0.01 in comparison to the healthy control.
Poly I:C induced liver injury and inflammation in mice
According to the protocol of PBC animal model, mice were sacrificed at week 16. The liver tissue and serum were collected to evaluate the content of liver inflammation. As shown in table 2, poly I:C administration increased the concentrations of ALT, AST and GGT in serum. In line with the previous study, poly I:C didn’t induce ALP concentration increasing (p = 0.2263). Histopathology results showed that poly I:C significantly increased liver injury and inflammation in mice (Figure 3).
|
|
Normal (n=10) |
ploy I:C (n=10) |
P |
|
AST(U/L) |
19.65±5.2 |
223.5±16.5 |
<0.001 |
|
ALT(U/L) |
20.1±3.5 |
264.5±24.6 |
<0.001 |
|
GGT(U/L) |
19.54±5.2 |
301.2±45.6 |
<0.001 |
|
ALP (U/L) |
35.6±6.8 |
51.6±10.6 |
0.2263 |
Table 2: poly I:C increased the concentrations of ALT, AST and GGT in mouse serum.
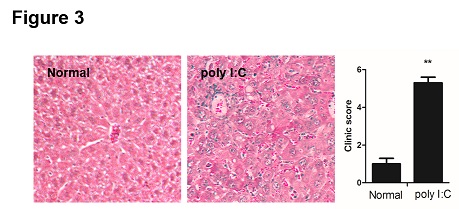 Figure 3: Poly I:C induced liver injury and inflammation in mice. Formalin-fixed liver tissues were embedded by paraffin and sections were cut into 5 μm slices. The sections were deparaffinized in xylene, dehydrated in ethanol, rehydrated in distilled water and subjected to hematoxylin and eosin (H&E). The clinical scores were evaluated as described previously with some modification. 0 = occasional inflammatory cells infiltration; 1= mild inflammation; 2 = inflammation with fibrosis. Data are shown as means ± S.E.M. **p < 0.01 in comparison to the normal group (n = 8).
The proportion of CD39+ Treg cells decreased in model group
Firstly, PBMCs from normal and poly I:C-treated mice were isolated by density gradient centrifugation, and the proportions of CD39+ cell and CD73+ cells in PBMCs were determined by flow cytometry. As shown in figure 4, the proportion of CD39+ cells in PBMCs decreased in model group (72.3 ± 6.8 %) compared with the normal group (92.3 ± 8.4 %). However, there was no significant difference between the normal group and the model group for proportion of CD73+ cells in PBMCs. Furthermore, the CD4+ cells were purified from spleen of mice by magnetic separation with the Mini-MACS system. The proportion of CD39+CD4+ cells in spleen was detected by flow cytometry. As shown in figure 5, poly I:C significantly inhibited the proportion of CD39+CD4+ cells in poly I:C-treated mice. The proportion of CD39+CD4+cells in normal group was 26.4 ± 3.5 %, and that in model group was 16.5 ± 2.1 %. Finally, CD4+ cells were isolated form spleen; the proportion of CD39+ Foxp3+CD4+ cells was detected by flow cytometry. The results showed that poly I:C markedly inhibited the proportion of CD39+Foxp3+CD4+ cells in mouse spleen. However, the proportion of CD73+Foxp3+CD4+ cells has no change (Figure 6).
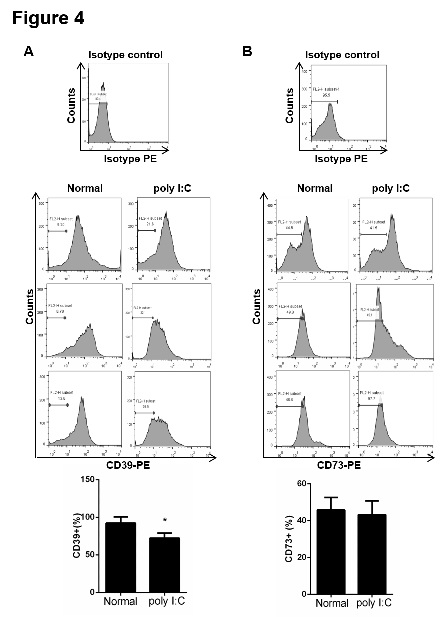 Figure 4: The proportion of CD39+ decreased in PBMCs from the model mice. PBMCs from mice were incubated with CD39-PE (A) and CD73-PE (B) antibodies at 4°C for 20 min. The proportions of CD39+ and CD73+ cells were determined by flow cytometry. PBMCs incubated with isotype-PE antibody were used as a negative control. Data are shown as means ± S.E.M. *p < 0.05 in comparison to the normal group (n = 8).
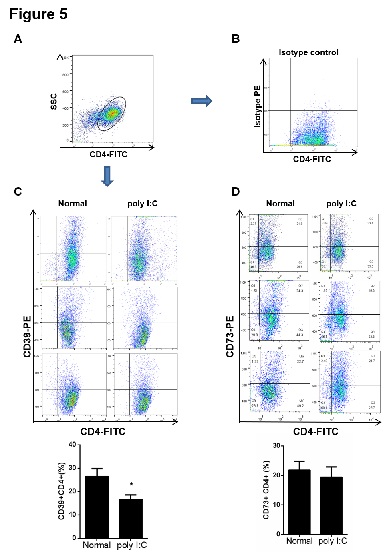
Figure 5: The proportion of CD39+CD4+ cells decreased in spleen from the model mice. The CD4+ cells were purified from spleen by magnetic separation with the Mini-MACS system. The cells were incubated with CD4-FITC and isotype-PE, CD39-PE or CD73-PE antibodies at 4°C for 20 min. (A) The purified CD4+ lymphocytes from spleen was gated for the further analysis. (B) The proportion of CD4+ lymphocytes incubated with isotype-PE antibody was determined by flow cytometry and used as a negative control. (C-D) The proportions of CD39+CD4+ and CD73+CD4+ cells were determined by flow cytometry. Data are shown as means ± S.E.M. *p < 0.05 in comparison to the normal group (n = 8).
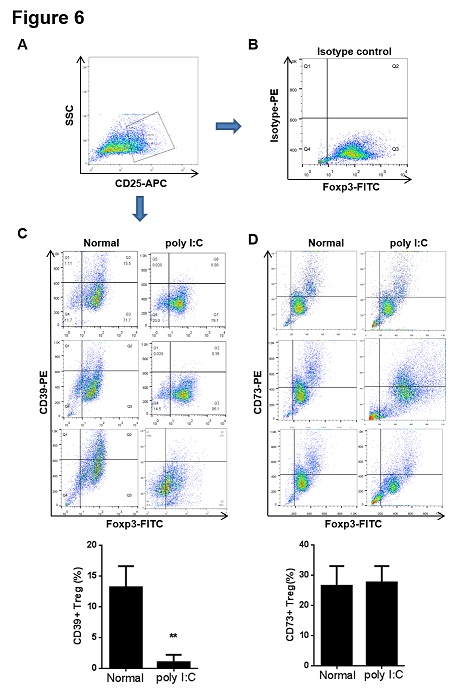 Figure 6: The proportion of CD39+ Treg cells decreased in spleen from the model mice. The CD4+ cells were purified from spleen by magnetic separation with the Mini-MACS system. The CD4+ cells were incubated with CD25-APC, Foxp3-FITC and isotype-PE, CD39-PE or CD73-PE antibodies at 4°C for 20 min. (A) The purified CD25+CD4+ lymphocytes from spleen was gated for the further analysis. (B) The proportion of CD25+Foxp3+CD4+ lymphocytes incubated with isotype-PE antibody was determined by flow cytometry and used as a negative control. (C-D) The proportions of CD39+ CD25+Foxp3+CD4+ and CD73+CD25+Foxp3+CD4+ cells were determined by flow cytometry. Data are shown as means ± S.E.M. **p < 0.01 in comparison to the normal group (n = 8).
Poly I:C inhibited the expression of CD39 in mouse liver
In order to confirm the roles of CD39 and CD73 in PBC model, the mRNA and protein levels of CD39 and CD73 in liver were detected by qPCR and western blot. As shown in figure 7, poly I:C inhibited the mRNA expression and protein of CD39 in mouse liver but not CD73. Furthermore, the CD8+ T cells and B cells (CD19+) from liver of mice treated by poly I:C were isolated by magnetic separation with the Mini-MACS system. The proportions of CD39+CD8+ and CD39+CD19+ cells were determined by flow cytometry from the model mice and normal mice. The results showed that poly I:C treatment did not alter the proportions of CD39+CD8+ and CD39+CD19+ cells in mouse liver (Figure 8), which indicating that the proportion of CD39+Foxp3+CD4+ cells may specifically decreased in PBC mouse liver.
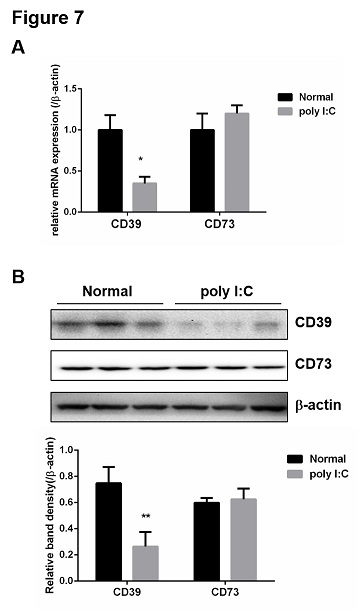 Figure 7: Poly I:C inhibited the expression of CD39 in mouse liver. (A) Total RNA was isolated from liver and the mRNA levels of CD39 and CD73 were determined by qPCR. (B) Total protein was isolated from liver and the expression levels of CD39 and CD73 were determined by western blot. b-actin was used as the internal controls for qPCR and western blot analysis . Bands were quantified using ImageJ and normalized to b-actin. Data are shown as means ± S.E.M. *p < 0.05, **p < 0.01 in comparison to the normal group (n = 8).
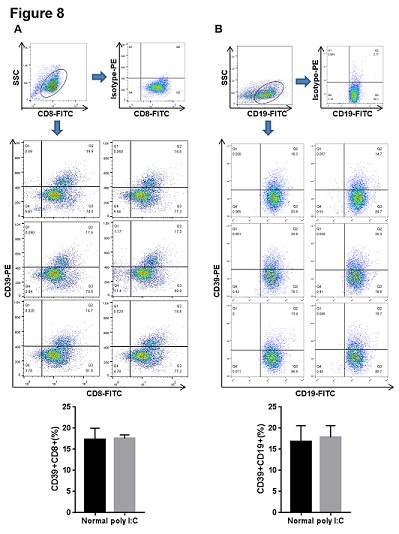 Figure 8: Poly I:C treatment did not alter the proportions of CD39+CD8+ and CD39+CD19+ cells in liver from the model mice. The CD8+ and CD19+ cells were purified from liver by magnetic separation with the Mini-MACS system and gated for the further analysis. (A) The purified CD8+ cells were incubated with isotype-PE antibody and the proportion was determined by flow cytometry as a negative control. The purified CD8+ cells were incubated with CD39-PE antibody at 4°C for 20 min and the proportion of CD39+CD8+ cells from liver was determined by flow cytometry. (B) The purified CD19+ cells were incubated with isotype-PE antibody and the proportion was determined by flow cytometry as a negative control. The purified CD19+ cells were incubated with CD39-PE antibody at 4°C for 20 min and the proportion of CD39+CD19+ cells from liver was determined by flow cytometry. Data are shown as means ± S.E.M. **p < 0.01 in comparison to the normal group (n = 8).
Poly I:C inhibited adenosine receptor A2a level in mice liver
It is known that CD39 converts ATP into AMP, and then CD73 dephosphorylates AMP into adenosine, which binds to adenosine receptors to exert immunosuppressive effects [19]. Our hypothsis is that the decresed population of CD39+ Treg cells in PBC mice may weaken immunosuppressive effects through inhibition of adenosine production and promote the development of PBC by reducing adenosine receptor signaling activation. Therefore, the levels of adenosine receptor A1, A2a, A2b and A3 in mouse liver were detected by qPCR and western blot. As shown in figure 9, poly I:C significantly inhibited mRNA expression and protein of A2a in mouse liver but not A1, A2b and A3.
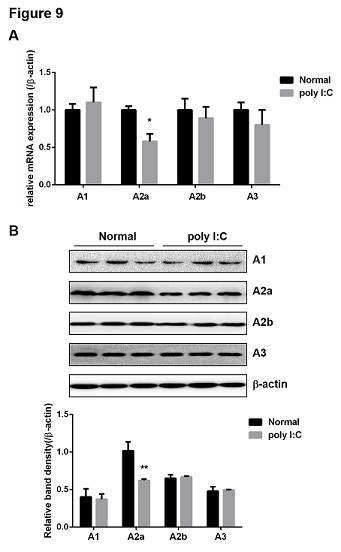 Figure 9: Poly I:C inhibited the level of adenosine receptor A2a in mice liver. (A) Total RNA was isolated from liver and the mRNA levels of adenosine receptors (A1, A2a, A2b, A3) were determined by qPCR. (B) Total protein was isolated from liver and the expression levels of adenosine receptors were determined by western blot. b-actin was used as the internal controls for qPCR and western blot analysis. Bands were quantified using Image J and normalized to b-actin. Data are shown as means ± S.E.M. *p < 0.05, **p < 0.01 in comparison to the control group (n = 8).
Discussion
PBC is a chronic autoimmune cholestatic liver disease characterized by mild destruction of intrahepatic bile ducts and liver inflammation. It may lead to cirrhosis and eventually require liver transplantation. Although there have been numerous studies and clinical improvements in PBC, such as UDCA therapy, the pathogenesis of this disease is still unknown [20]. The maintenance of Treg cells in quantity or function is extremely important for controlling immune response [21]. Treg cells release immune regulators and interact with their target cells to inhibit lymphocyte proliferation and cytokine production, which participate in the pathogenesis of PBC [22]. Many specific molecules expressed in Treg cells, the most important of which is the transcription factor Foxp3 [23]. In this study, both clinical samples and animal model were used to investigate the role of Treg cells in the development of PBC. It was found that the proportion of CD39+ Treg cells in PBMCs from patient was reduced, which was consistent with the results of animal model. The data suggest that reduced CD39+ Treg cells might offers a novel perspective in the pathogenesis of PBC.
CD39 is involved in many autoimmune diseases, such as multiple sclerosis, autoimmune hepatitis and autoimmune arthritis [24-26]. It has been reported that human Treg cells with high expression CD39 is more stable and functional in inflammatory state [27]. Our data showed that the serum concentrations of AST, ALT, GGT and ALP were increased in 64 PBC patients with the proportion of CD39+CD4+ cells and CD39+Treg cells decreasing in patient PBMCs compared with the healthy controls. To confirm these results, we used poly I:C to induce a PBC model in mice. Consistent with the data from PBC patients, the concentrations of ALT, AST, and GGT in serum and liver inflammation were also significantly increased. Importantly, we found that the proportions of CD39+CD4+ cells and CD39+Foxp3+CD4+ cells in spleen were decreased significantly in the model group compared with the normal group. These results strongly suggested that CD39+ Treg cells were involved in the pathogenesis of PBC. Interestingly, little had altered in the proportion of CD73+CD4+ cells and CD73+ Treg cells from patient samples and PBC animals. So far, few study reported the roles of CD39 and CD73 in PBC. Our study firstly suggested CD39+ Treg cell may be a key regulator for the pathogenesis of PBC.
Indeed, CD4+ T helper cells are an essential part in autoimmune diseases such as PBC. It is well known that autoimmune diseases are characterized by imbalance between regulatory T cells and effecter T cell subsets [28,29]. It has been reported that CD39 expressed in monocytes, endothelial cells, dendritic cells and NK cells [30,31]. Few study reported the function and the expression level of CD39 in T help cells of PBC. However, Th1 or Th17 cells overactivation aggravated the development of PBC. It has been reported that CD39 and CD161 modulated Th17 responses in Crohn’s disease through alterations in purinergic nucleotide-mediated responses [32]. The decreased population of CD39+CD4+ cells in our study indicated that CD39+ Th17 cells may contribute to the development of PBC. Therefore, the role of CD39 in helper T cells and contribution to pathogenesis of PBC still need to be further studied and explored. In addition, it was reported that CD8+ Treg populations from PBC patients, but not controls, have significant phenotypic alterations, including increased expression of CD127 and reduced CD39 [33]. It was also reported that both patients with PBC and their first-degree relatives that a deficiency of regulatory T cells (Tregs) was an integral component for susceptibility to PBC [34]. CD39 as a marker of CD8+ T cell implicated the purinergic pathway in the regulation of T cell exhaustion [35]. NADH oxidase-dependent CD39 expression in CD8 T cells modulates interferon gamma responses via generation of adenosine [36]. In this study, we found that poly I:C treatment did not alter the proportions of CD39+CD8+ and CD39+CD19+ cells in liver of PBC mice, which indicated the importance of CD39+ Treg cells in the development of PBC.
CD39 and CD73 are exonucleases with catalytic sites and highly express on Foxp3+ Treg cells. CD39 converts ATP into ADP and AMP, and then CD73 dephosphorylates AMP to adenosine, which binds to adenosine receptors [19]. These receptors belong to G protein coupled receptors, including A1, A2a, A2b and A3. Interestingly, Our data showed that poly I:C significantly inhibited mRNA expression and the protein and mRNA expression of A2a in mouse liver but not A1, A2b and A3, suggesting that the decreased population of CD39+ Treg cells may reduce the content of adenosine and block adenosine A2a receptor signaling to weaken immunosuppressive effects. The A2a receptor is mainly combined with adenosine, which activates the downstream pathway and plays an immunosuppressive role [37]. Adenosine receptors exist anti-inflammatory functions. Treg and effector T cells produce synergistic effect and secrete inhibitory cytokines [38]. Therefore, regulation of extracellular adenosine production by CD39 may be an important way for Treg cells to exert immunosuppressive effect.
Funding
This study was supported by grants from the Key Technologies of Prevention and Control for Infectious Diseases of Suzhou (GWZX201604), Jiangsu youth Medical Talents Project (QNRC2016214), Clinical Medicine Foundation of Jiangsu University (JLY20180023), Medical Talents Project of Soochow (GSWS2020106).
Conflict of Interest
The authors declare no conflict of interest.
Ethical Approval
All procedures performed in studies involving human participants were in accordance with the ethical standards of the institutional and/or national research committee.
Informed Consent
Informed consent was obtained from all individual participants included in the study.
References
- Karlsen TH, Vesterhus M, Boberg KM (2014) Review article: controversies in the management of primary biliary cirrhosis and primary sclerosing cholangitis. Aliment Pharmacol Ther 39: 282-301.
- Guarino MPL, Cocca S, Altomare A, Emerenziani S, Cicala M (2013) Ursodeoxycholic acid therapy in gallbladder disease, a story not yet completed. World J Gastroenterol 19: 5029-5034.
- Arenas F, Hervias I, Uriz M, Joplin R, Prieto J, et al. (2008) Combination of ursodeoxycholic acid and glucocorticoids upregulates the AE2 alternate promoter in human liver cells. J Clin Invest 118: 695-709.
- Feng BL, Yu HH, Shen W (2019) Ursodeoxycholic acid combined with bezafibrate in the treatment of refractory primary biliary cholangitis: a meta-analysis. Zhonghua Gan Zang Bing Za Zhi 27: 304-311.
- Parikh P, Ingle M, Patel J, Bhate P, Pandey V, et al. (2016) An open-label randomized control study to compare the efficacy of vitamin e versus ursodeoxycholic acid in nondiabetic and noncirrhotic Indian NAFLD patients. Saudi J Gastroenterol 22: 192-197.
- Curiel TJ (2007) Tregs and rethinking cancer immunotherapy. J Clin Invest 117: 1167-1174.
- Sawant DV, Vignali DA (2014) Once a Treg, always a Treg? Immunol Rev 259: 173-191.
- Lu L, Barbi J, Pan F (2017) The regulation of immune tolerance by FOXP3. Nat Rev Immunol 17: 703-717.
- Liang M, Liwen Z, Yun Z, Yanbo D, Jianping C (2018) The Imbalance between Foxp3(+)Tregs and Th1/Th17/Th22 Cells in Patients with Newly Diagnosed Autoimmune Hepatitis. J Immunol Res 2018: 3753081.
- Liaskou E, Patel SR, Webb G, Dimakou DB, Akiror S, et al. (2018) Increased sensitivity of Treg cells from patients with PBC to low dose IL-12 drives their differentiation into IFN-γ secreting cells. J Autoimmun 94: 143-155.
- Mizumoto N, Kumamoto T, Robson SC, Sévigny J, Matsue H, et al. (2002) CD39 is the dominant Langerhans cell-associated ecto-NTPDase: modulatory roles in inflammation and immune responsiveness. Nat Med 8: 358-65.
- Antonioli L, Kumamoto T, Robson SC, Sévigny J, Matsue H, et al. (2013) CD39 and CD73 in immunity and inflammation. Trends Mol Med 19: 355-367.
- Junger WG (2011) Immune cell regulation by autocrine purinergic signalling. Nat Rev Immunol 11: 201-112.
- Brisevac D, Bajic A, Bjelobaba I, Milosevic M, Stojiljkovic M, et al. (2013) Expression of ecto-nucleoside triphosphate diphosphohydrolase1-3 (NTPDase1-3) by cortical astrocytes after exposure to pro-inflammatory factors in vitro. J Mol Neurosci 51: 871-879.
- Eltzschig HK, Köhler D, Eckle T, Kong T, Robson SC, et al. (2009) Central role of Sp1-regulated CD39 in hypoxia/ischemia protection. Blood 113: 224-232.
- Deaglio S, Robson SC (2011) Ectonucleotidases as regulators of purinergic signaling in thrombosis, inflammation, and immunity. Adv Pharmacol 61: 301-332.
- Lindor KD, Juran BD, Lazaridis KN (2009) Primary biliary cirrhosis. Hepatology 50: 291-308.
- Jiang T, Han Z, Chen S, Wu C, Tang Y, et al. (2009) Resistance to activation-induced cell death and elevated FLIPL expression of CD4+ T cells in a polyI:C-induced primary biliary cirrhosis mouse model. Clin Exp Med 9: 269-276.
- Yegutkin GG (2008) Nucleotide- and nucleoside-converting ectoenzymes: Important modulators of purinergic signalling cascade. Biochim Biophys Acta 1783: 673-694.
- Paumgartner G, Beuers U (2002) Ursodeoxycholic acid in cholestatic liver disease: mechanisms of action and therapeutic use revisited. Hepatology 36: 525-531.
- Zhang D, Tu E, Kasagi S, Zanvit P, Chen Q, et al. (2015) Manipulating regulatory T cells: a promising strategy to treat autoimmunity. Immunotherapy 7: 1201-1211.
- Garetto S, Trovato AE, Lleo A, Sala F, Martini E, et al. (2015) Peak inflammation in atherosclerosis, primary biliary cirrhosis and autoimmune arthritis is counter-intuitively associated with regulatory T cell enrichment. Immunobiology 220: 1025-1029.
- Gavin MA, Torgerson TR, Houston E, Roos P, Ho WY, et al. (2006) Single-cell analysis of normal and FOXP3-mutant human T cells: FOXP3 expression without regulatory T cell development. Proc Natl Acad Sci USA 103: 6659-6664.
- Grant CR, Liberal R, Holder BS, Cardone J, Ma Y, et al. (2014) Dysfunctional CD39(POS) regulatory T cells and aberrant control of T-helper type 17 cells in autoimmune hepatitis. Hepatology 59: 1007-1015.
- Muls N, Dang HA, Sindic CJA, Pesch VV (2014) Fingolimod increases CD39-expressing regulatory T cells in multiple sclerosis patients. PLoS One 9: 113025.
- Maddaloni M, Kochetkova I, Jun S, Callis G, Thornburg T, et al. (2015) Milk-based nutraceutical for treating autoimmune arthritis via the stimulation of IL-10- and TGF-β-producing CD39+ regulatory T cells. PLoS One 10: 0117825.
- Gu J, Ni X, Pan X, Lu H, Lu Y, et al. (2017) Human CD39(hi) regulatory T cells present stronger stability and function under inflammatory conditions. Cell Mol Immunol 14: 521-528.
- Mikulkova Z, Praksova P, Stourac P, Bednarik J, Michalek J (2011) Imbalance in T-cell and cytokine profiles in patients with relapsing-remitting multiple sclerosis. J Neurol Sci 300: 135-141.
- Muratori L, Longhi MS (2013) The interplay between regulatory and effector T cells in autoimmune hepatitis: Implications for innovative treatment strategies. J Autoimmun 46: 74-80.
- Borsellino G, Kleinewietfeld M, Mitri DD, Sternjak A, Diamantini A, et al. (2007) Expression of ectonucleotidase CD39 by Foxp3+ Treg cells: hydrolysis of extracellular ATP and immune suppression. Blood 110: 1225-1232.
- Pulte ED, Broekman MJ, Olson KE, Drosopoulos JHF, Kizer JR, et al. (2007) CD39/NTPDase-1 activity and expression in normal leukocytes. Thromb Res 121: 309-317.
- Bai A, Moss A, Kokkotou E, Usheva A, Sun X, et al. (2014), CD39 and CD161 modulate Th17 responses in Crohn's disease. J Immunol 193: 3366-3377.
- Bernuzzi F, Fenoglio D, Battaglia F, Fravega M, Gershwin ME, et al. (2010) Phenotypical and functional alterations of CD8 regulatory T cells in primary biliary cirrhosis. J Autoimmun 35: 176-180.
- Wakabayashi K, Lian Z-X, Moritoki Y, Lan RY, Tsuneyama K, et al. (2006) IL-2 receptor alpha(-/-) mice and the development of primary biliary cirrhosis. Hepatology 44: 1240-1249.
- Gupta PK, Godec J, Wolski D, Adland E, Yates K, et al. (2015) CD39 Expression Identifies Terminally Exhausted CD8+ T Cells. PLoS Pathog 11: 1005177.
- Bai A, Moss A, Rothweiler S, Longhi MS, Wu Y, et al. (2015) NADH oxidase-dependent CD39 expression by CD8(+) T cells modulates interferon gamma responses via generation of adenosine. Nat Commun 6: 8819.
- Gomez G, Sitkovsky MV (2003) Differential requirement for A2a and A3 adenosine receptors for the protective effect of inosine in vivo. Blood 102: 4472-4478.
- Mazzarella G (2015) Effector and suppressor T cells in celiac disease. World J Gastroenterol 21: 7349-7356.
Citation: Gong Y, Xue J, Yang Z, Zhu W, Lu F, et al. (2021) Reduced Proportion of CD39+ Treg Cells Correlates with the Development of Primary Biliary Cholangitis in Patients and a Murine Model. J Altern Complement Integr Med 7: 180.
Copyright: © 2021 Yanping Gong, et al. This is an open-access article distributed under the terms of the Creative Commons Attribution License, which permits unrestricted use, distribution, and reproduction in any medium, provided the original author and source are credited.