Review on the Application of Machine Learning to Cancer Research
*Corresponding Author(s):
Henry ChibudikeDepartment Of Chemical, Fiber And Environmental Technology, Federal Institute Of Industrial Research, Oshodi, Lagos, Nigeria
Email:henrychibudike@gmail.com
Abstract
This study reviews the application of machine learning through different algorithms in cancer research. The research on machine learning is digitalized through improved artificial network connectivity and computational power. This shifted the effect of machine learning from artificial intelligence to solving practically natural problems. Cancer has been characterized as a heterogeneous disease consisting of many different subtypes. The early diagnosis and prognosis of a cancer type have become a necessity in cancer research, as it can facilitate the subsequent clinical management of patients. The importance of classifying cancer patients into high or low risk groups has led many research teams, from the biomedical and the bioinformatics field, to study the application of Machine Learning (ML) methods. Therefore, these techniques have been utilized as an aim to model the progression and treatment of cancerous conditions. In addition, the ability of ML tools to detect key features from complex datasets reveals their importance. A variety of these techniques, including Artificial Neural Networks (ANNs), Bayesian Networks (BNs), Support Vector Machines (SVMs) and Decision Trees (DTs) have been widely applied in cancer research for the development of predictive models, resulting in effective and accurate decision making. The potential of machine learning is obvious in medical science and has gained its ground in medical specialties such as radiology, cardiology, mental health and pathology. In health care machine learning is used to interpret data hence speed up workflow, reduce medical error and promote human health. Pathologists are accurate at diagnosing cancer but have an accuracy rate of only 65% when predicting the development of cancer. Computed tomography, mammography, Magnetic Resonance Imaging (MRI), or histopathology have been derived from imaging datasets over decades for diagnoses and staging prognosis of various cancers. The development of novel computational tools for stratification, grading, prognostication of patients with the goal of improving patient care has been achieved through the impact of machine learning. Even though it is evident that the use of ML methods can improve our understanding of cancer progression, an appropriate level of validation is needed in order for these methods to be considered in the everyday clinical practice. In this work, we present a review of recent ML approaches employed in the modeling of cancer progression. The predictive models discussed here are based on various supervised ML techniques as well as on different input features and data samples. Given the growing trend on the application of ML methods in cancer research, we present here recent advances that employ these techniques as an aim to model cancer risk or patient outcomes.
Keywords
Artificial Intelligence; Cancer diagnosis; Cancer predicting; Cancer research; Dataset; Machine learning
Introduction
In recent years, the availability of large datasets combined with the improvement in algorithms and the exponential growth in computing power led to an unparalleled surge of interest in the topic of machine learning [1]. Nowadays, machine learning algorithms are successfully employed for classification, regression, clustering, or dimensionality reduction tasks of large sets of especially high-dimensional input data [2]. In fact, machine learning has proved to have superhuman abilities in numerous fields (such as prediction, self-driving cars, image classification, 4 medical diagnoses etc.). As a result, huge parts of our daily life, for example, image and speech recognition, web-searches, fraud detection, email/spam filtering, credit scores, report extraction and many more are powered by machine learning algorithms [3]. While data-driven research and more specifically machine learning, have already a long history in biology or chemistry, they only rose to prominence recently in the field of cancer research. A first computational revolution in cancer research was fueled by the advent of computational methods, especially Magnetic Resonance Imaging (MRI) [4]. The constant increase in computing power and the development of more efficient codes also allowed for computational high-throughput studies of large samples in order to screen for the ideal experimental candidates. Over decades, cancer researchers have researched into cancer to identify causes and dive into measures for its prevention, diagnosis, treatment and cure. The epidemiology, molecular bioscience to the performance of clinical trials have been evaluated and compared for the application of their various treatments [5]. It could be applied in surgery, immunotherapy, hormone therapy, chemotherapy, radiation therapy and combined treatment modalities such as chemo-radiotherapy. In the mid-1990s the clinical cancer research shifted to therapies and this was derived from biotechnology research such as immunotherapy and gene therapy. Cancer research is done in academia, research institutes, and corporate environments, and is largely government funded, according to Martin Stumpe (AI and Data Science, MI, USA 2019), and collaborators developed a Deep-Learning System (DLS) 2019. However, the challenges and interesting tasks of physicians are the accurate prediction outcomes of diseases. For this reason, Machine Learning methods have taken over in medical research as a popular tool. This review has an indication of some of the models that have been developed for cancer biopsies and prognoses. For instance, there a model that predicts cancer susceptibility; Craig Mermel (Google AI Healthcare, CA, USA 2019). The model was built to discriminate tumors as either malignant or benign in the midst of breast cancer patients. In this model, the completion of the tasks was done by ANN.
The building of this model was with a large number of hidden layers that could generalize data better. As thousands of mammographic data were fed in the model to obtain and learn the difference between benign and malignant tumors. Before being inputted, all the data was reviewed by radiologists. An approach by Regina Barzilay (MGH, MA, USA) 2019. The causes of cancer have been researched into many different disciplines including genetics, diet, environmental factors (i.e. chemical carcinogens). During the investigation of causes and also potential therapy targets, the route with data derived from clinical observations, basic research commences, and once convinced and independently obtained results are confirmed, proceeds with clinical research, which involves appropriate designed trials on consenting human subjects, with the goal to ascertain safety and efficiency of the therapeutic intervention method; Connie Lehman at Massachusetts General Hospital (MGH, MA, USA) 2019. One of the important parts of basic research is characterization of the potential mechanisms of carcinogenesis, having in mind the types of genetic and epigenetic changes that are associated with cancer development. The use of mouse is like a model for mammalian manipulation of the function of genes that play a role in tumor formation, while basic aspects such as bacteria and mammalian cells are assayed on cultures for tumor initiation, such as mutagenesis.
Methodology
In this review we examined a few of the most widely used image processing algorithms, then move on to machine learning implementation in image processing. At a glance is as follows:
- Feature mapping using the scale-invariant feature transform (SIFT) algorithm
- Image registration using the random sample consensus (RANSAC) algorithm
- Image Classification using artificial neural networks
- Image Classification using Convolutional Neural Networks (CNNs)
- Image Classification using machine learning
- Important Terms
Dynamic Contrast enhancement
Conventional contrast-enhanced magnetic resonance imaging (MRI) displays a single snapshot of tumor enhancement after contrast administration; although the anatomical information derived from such images is valuable, it lacks functional information (National Institute of Health, 2017). Dynamic contrast-enhanced magnetic resonance imaging (DCE-MRI), which relies on fast MRI sequences obtained before, during and after the rapid Intravenous (IV) administration of a Gadolinium (Gd) based contrast agent is analogous to a movie and is an emerging imaging method to assess tumor angiogenesis. To investigate whether a combination of radionics and automatic machine learning applied to Dynamic Contrast-Enhanced Magnetic Resonance Imaging (DCE-MRI) of primary breast cancer can non-invasively predict axillary Sentinel Lymph Node (SLN) metastasis.
Image segmentation and radiomic feature extraction
Axial DCE-MRI Digital Imaging and Communications in Medicine (DICOM) images were archived from the Picture Archiving and Communication System (PACS) [6]. The calculation of time signal intensity curves for tumor lesions in the DCE-MRI images were done using a GE Advanced Workstation ADW4.4 [7]. Based on these curves, the Volumes Of Interest (VOIs) were delineated on the whole tumor in the images with the strongest enhanced phase. The VOIs were determined manually by a radiologist with 10 years of experience who was blinded to the clinical information of the patients, and all contours were reviewed by another senior radiologist with 20 years of experience [8]. If the discrepancy was ≥5%, the senior radiologist determined the tumor borders. Cohen's kappa method was used to assess inter-reader agreement. In general, the (pre- processing of images are often the first step to later extraction of the features that would be used to train a machine learning classifier. Signal processing can be used to improve or eliminate properties of the image that could enhance the performance of the machine learning algorithm.
Classification of effectiveness of model
In machine learning, classification models are often used to get a predicted result of population data. Classification is one of the two sections of supervised learning deals with data from different categories [9]. The training dataset trains the model to predict the unknown labels of population data. There are multiple algorithms, namely, Logistic regression, K-nearest neighbor, Decision tree, Naive Bayes etc. All these algorithms have their own way of execution and different methods of prediction. But, at the end, we need to find the effectiveness of an algorithm [10]. To find the most suitable algorithm for a particular problem, there are model evaluation techniques. In this article several model evaluation techniques will be discussed, epicts the workflow applied in supervised learning. One generally chooses a subset of the relevant population for which values of the target property are known or creates the data if necessary. This process is accompanied by the selection of a machine learning algorithm that will be used to fit the desired target quantity (Figure 1).
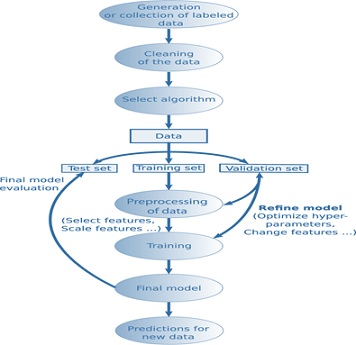 Figure 1: Supervised learning workflow.
Evaluation
One of the evaluations to conduct during prediction is Confusion matrix in the image. A confusion matrix is a table that describes the performance of a classifier/classification model. It contains information about the actual and prediction classifications done by the classifier and this information is used to evaluate the performance of the classifier. Here is the sample of a Confusion Matrix [11].
Confusion matrix is the image given above. This is a matrix representing the results of any binary testing. For example, let us take the case of predicting a disease. (Figure 2). You have done some medical testing and with the help of the results of those tests, you are going to predict whether the person is having a disease. So, actually you are going to validate if the hypothesis of declaring a person as having disease is acceptable or not. Say, among 100 people you are predicting 20 people to have the disease. In actual only 15 people to have the disease and among those 15 people you have diagnosed 12 people correctly. So, if I put the result in a confusion matrix, it will look like the following As observed in (Figure 3).
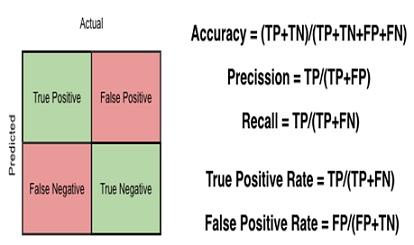 Figure 2: Confusion Matrix [11].
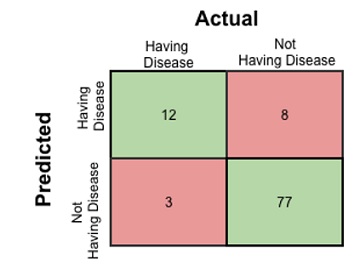 Figure 3: Confusion Matrix of predicting a disease.
- True Positive: 12 (You have predicted the positive case correctly!)
- True Negative: 77 (You have predicted negative case correctly!)
- False Positive:8 (You have predicted these people as having disease, but in actual they do not have. There is no course for alarm; this can be rectified during further medical analysis. So, this is a low risk error. This is type-II error in this case.)
- False Negative: 3 (You have predicted these three poor fellows as fit. But actually they have the disease. This is dangerous! Be careful! This is type-I error in this case.)
Now, this is the accuracy of the prediction model was followed to get this results; i.e. the ratio of the accurately predicted number and the total number of people which is (12+77)/100 = 0.89. There is need for you to study the confusion matrix thoroughly so as to find the following things
Test for specificity and sensitivity
In medical diagnosis, the term test sensitivity is the reliability of a test to correctly identify those affected with the disease (true positive rate), while test specificity is the ability of the test to correctly identify those that are not affected with the disease (true negative rate).
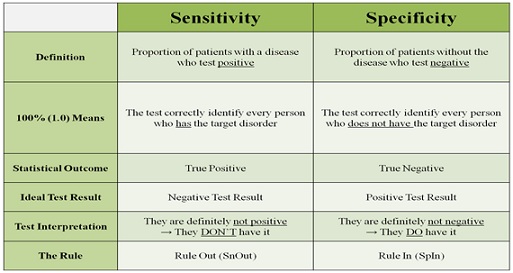 Table 1: Test for specificity and sensitivity [12].
Sensitivity and specificity are great values to lead you in your fair clinical examination. It gives more information regarding the patient and guide to a better assessment and authentic diagnosis. Keep in mind that there is always the possibility of false positives and negatives. Special tests should never be the only sign to determine a patient’s pathology. It is merely a piece of the clinical examination and assessment [12].
Results And Discussion
Parameters for cancer dictation
In the development of metastases there is a negative prognostic parameter for the clinical result of breast cancer. Bone consists of the first site of distant metastases for several affected women. The idea of this attribute information is to perform an exploratory analysis of the information contained in the dataset, figuring out ways of making the dataset tidier. The ultimate objective is to, in the end, build and compare models to predict if a given tumor is benign or malignant (breast cancer) using the information available on the dataset in (Table 2) below.
|
Sample code number |
Id number |
|
Clump Thickness |
1 – 10 |
|
Uniformity of Cell Size |
1 – 10 |
|
Uniformity of Cell Shape |
1 – 10 |
|
Marginal Adhesion |
1 – 10 |
|
Single Epithelial Cell Size |
1 – 10 |
|
Bare Nuclei |
1 – 10 |
|
Bland Chromatin |
1 – 10 |
|
Normal Nucleoli |
1 – 10 |
|
Mitoses |
1 – 10 |
|
Class |
(2 for benign, 4 for malignant)
|
Table 2: A Sample of Analysis and Modeling of Breast Cancer Data (Random Forest model) from (ml-repository '@' ics.uci.edu).
The analysis shows that, with a Random Forest model, we can predict if a given tumor is malignant with 97.86% of Accuracy. This result is 1.96% higher than the Accuracy of 95.90% reported in the UCI Machine Learning as the highest for this dataset (ml-repository '@' ics.uci.edu). We also conclude that the most important information for this prediction is the ‘uniformity of the cell size’. The idea is to perform an exploratory analysis of the information contained in the dataset, figuring out ways of making the dataset tidier. The ultimate objective is to, in the end, build and compare models to predict if a given tumor is available on this dataset. The analysis show that, with a Random Forest model, we can predict if a given tumor is malignant or benign for (breast cancer) using the information (ml-repository '@' ics.uci.edu).
|
idID |
ID number |
radius mean |
texture mean |
Perimeter mean |
Smoothness mean |
Compactness mean |
concavity mean |
concave points mean |
symmetry mean |
fractal dimension mean |
Diagnosis |
|
|
3 |
842302 |
17.99 |
10.38 |
122.8 |
0.118 |
0.2776 |
0.3001 |
0.1471 |
0.2419 |
0.07871 |
1 |
|
|
4 |
842517 |
20.57 |
17.77 |
132.9 |
0.085 |
0.07864 |
0.0869 |
0.07017 |
0.1812 |
0.05667 |
1 |
|
|
5 |
84300903 |
19.69 |
21.25 |
130 |
0.11 |
0.1599 |
0.1974 |
0.1279 |
0.2069 |
0.05999 |
1 |
|
|
6 |
84348301 |
11.42 |
20.38 |
77.58 |
0.143 |
0.2839 |
0.2414 |
0.1052 |
0.2597 |
0.09744 |
1 |
|
|
7 |
84358402 |
20.29 |
14.34 |
135.1 |
0.1 |
0.1328 |
0.198 |
0.1043 |
0.1809 |
0.05883 |
1 |
|
|
8 |
843786 |
12.45 |
15.7 |
82.57 |
0.128 |
0.17 |
0.1578 |
0.08089 |
0.2087 |
0.07613 |
1 |
|
|
9 |
844359 |
18.25 |
19.98 |
119.6 |
0.095 |
0.109 |
0.1127 |
0.074 |
0.1794 |
0.05742 |
1 |
|
|
10 |
84458202 |
13.71 |
20.83 |
90.2 |
0.119 |
0.1645 |
0.09366 |
0.05985 |
0.2196 |
0.07451 |
1 |
|
|
11 |
844981 |
13 |
21.82 |
87.5 |
0.127 |
0.1932 |
0.1859 |
0.09353 |
0.235 |
0.07389 |
1 |
|
|
12 |
84501001 |
12.46 |
24.04 |
83.97 |
0.119 |
0.2396 |
0.2273 |
0.08543 |
0.203 |
0.08243 |
1 |
|
|
13 |
845636 |
16.02 |
23.24 |
102.7 |
0.082 |
0.06669 |
0.03299 |
0.03323 |
0.1528 |
0.05697 |
1 |
|
|
14 |
84610002 |
15.78 |
17.89 |
103.6 |
0.097 |
0.1292 |
0.09954 |
0.06606 |
0.1842 |
0.06082 |
1 |
|
|
15 |
846226 |
19.17 |
24.8 |
132.4 |
0.097 |
0.2458 |
0.2065 |
0.1118 |
0.2397 |
0.078 |
1 |
|
|
16 |
846381 |
15.85 |
23.95 |
103.7 |
0.084 |
0.1002 |
0.09938 |
0.05364 |
0.1847 |
0.05338 |
1 |
|
|
17 |
84667401 |
13.73 |
22.61 |
93.6 |
0.113 |
0.2293 |
0.2128 |
0.08025 |
0.2069 |
0.07682 |
1 |
|
|
18 |
84799002 |
14.54 |
27.54 |
96.73 |
0.114 |
0.1595 |
0.1639 |
0.07364 |
0.2303 |
0.07077 |
1 |
|
|
19 |
848406 |
14.68 |
20.13 |
94.74 |
0.099 |
0.072 |
0.07395 |
0.05259 |
0.1586 |
0.05922 |
1 |
|
|
20 |
84862001 |
16.13 |
20.68 |
108.1 |
0.117 |
0.2022 |
0.1722 |
0.1028 |
0.2164 |
0.07356 |
1 |
Table 3: A sample of Dataset (ml-repository '@' ics.uci.edu) The diagnosis of breast tissue (1 = malignant, 0 = benign).
Datasets and their Features
In (Table 3) above, when it comes to classification, there is a need of dataset to classify. Dataset is a statistical matrix which represents different features. It is a matrix where all the information about different features is given. Each column of the dataset represents the feature of the tumorous tissue and each row represents the number of instances. Table 4 is the details of attributes found in WDBC dataset (19): ID number, Diagnosis (M=Malignant, B=Benign) and ten real real-valued features are computed for each cell nucleus: radius, Texture, Perimeter, Area, Smoothness, Compactness, Concavity, Concave points, Symmetry and Fractal dimension (20) [13]. These features are computed from digitized image of a fine needless aspirate (FNA) of a breast mass (ml-repository '@' ics.uci.edu). They described characteristics of the cell nuclei present in the image (21). When the radius of an individual nucleus measured by averaging the length of the radial line segments, it is defined by the centroid of the snake and the individual snake points. The Nuclear Perimeter constitutes of the total distance between consecutive snake points.
Exploratory Analysis
To explore this data and later also be able to create models correctly, we need to separate our data into train and test data. This is to achieve a simulated real world dataset (test) that have class information that has not been used in anyway during the analysis (instead we use train). This ensures that our test dataset is really simulating real world data, since it has not been seen during exploration or modeling [14]. For this purpose, the R package caTools, as displayed below.
Library (caTools)
- Seed (1000)
- split= Split (cancer$Class, Split Ratio=0.80)
- train=subset (cancer, split==TRUE)
- test=subset (cancer, split==FALSE)
Cancer Research
Cancer research is a research into the cause of cancer, prevention, diagnosis, treatment and cure which involves many diverse disciplines including genetics, diet, environmental factors (i.e. chemical carcinogens).The ranges of cancer research are from epidemiology, molecular bioscience to the performance of clinical trials to make evaluation and comparison of the application of various cancer treatments [15].
Cancer research has been on for ages. In the early years of research, the focus was on the causes of cancer. The first identification of environmental trigger (chimney soot) for cancer was and identification of cigarette smoking as a cause of lung cancer in 1950. The treatment of cancer was early focused on enhancing surgical techniques for removing tumors. Radiation therapy took hold in the 1900s [15]. The development and definition of Chemotherapeutics were done throughout the 20th century. Cancer research involves various types and interdisciplinary areas of research. Scientists in cancer research may get their trainings in areas such as epidemiology, chemistry, biomedical engineering, molecular biology, medical physics, physiology and biochemistry. Research principles and mechanisms were always clarified at basic research level. Translational research aims to discover the mechanisms of cancer development and progression and convert n basic scientific results into ideas that can be applied to the treatment and prevention of cancer. The development of pharmaceuticals, surgical procedures, and medical technologies for the eventual treatment of patients are achieved through clinical research.
Genes involved in cancer
The aim of oncogenomics is to discover new oncogenes or tumor suppressor genes that may provide new knowledge into diagnosing cancer, predicting clinical outcome of cancers, and an update targets for cancer therapies. As the Cancer Genome Project stated in a 2004 review article, a central aim of cancer research has been to identify the mutated genes that are causally implicated in oncogenesis (cancer genes). The project of Cancer Genome Atlas is a related effort which focused in investigating the genomic changes that relates to cancer, while the genetic mutations from hundreds of thousands of human cancer samples were acquired from COSMIC cancer database documents. In the cause of several literature reviews, there is an indication that projects have been carried out, involving about 350 different types of cancer, have identified ~130,000 mutations in ~3000 genes that have been mutated in the tumors. The majority occurred in 319 genes, of which 286 were tumor suppressor genes and 33 oncogenes (American Association for Cancer Research, Databases for oncogenomic research). Some hereditary factors can shoot up the chance of cancer-causing mutations that includes activating oncogenes or inhibiting tumor suppressor genes. The functioning of various oncogenes and tumor suppressor genes can be interrupted at different levels of tumor progression. Gene’s mutations can be used to classify the malignancy of a tumor. In some stages, tumors can form a resistance to cancer treatment. The understanding of tumor progression and treatment success is achieved when identification of oncogenes and tumor suppressor genes done. The function of a given gene in cancer progression may differ tremendously, as it depends on the stage and type of cancer involved.
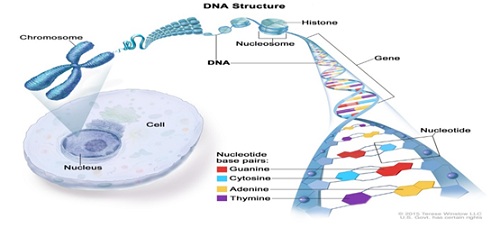 Figure 4: Structure of DNA.
It has been ascertained that most DNA is seen inside the nucleus of a cell, where it forms the chromosomes. Chromosomes acquire proteins called histones that join to DNA. DNA has two strands that fickle into the shape of a spiral ladder called a helix. DNA is made up of four building blocks called nucleotides: adenine (A), thymine (T), guanine (G), and cytosine (C) (the National Cancer Institute 2017). The nucleotides attach to each other (A with T, and G with C) to form chemical bonds called base pairs, which connect the two DNA strands (the National Cancer Institute 2017). Genes are short pieces of DNA that carry specific genetic information (the National Cancer Institute 2017) (Figure 4).
Cancer Detection
It is advisable to dictate cancer early so as to avert the difficulty of treating it in later stages. Accuracy in detection of cancer is paramount because false positives can cause harm owing to unnecessary medical procedures. Some screening procedures are not accurate currently (such as prostate-specific antigen testing). In some other cases like a colonoscopy or mammogram are unpleasant and gives room for some patients to opt out. Active research is to address all these problems [16].
- Three main ways cancer cells can spread
- Through the blood vessels: This is known as hematogenous spread. Cancerous cells invade blood vessels and use the flow of blood cells as transportation.
- Through nearby tissue: This is known as transcoelomic spread. Cancerous cells penetrate the surfaces of peritoneal cavities in the body.
- Through the Lymphatic system: This is known as lymphatic spread. Cancerous cells invade the lymph nodes and use the lymphatic system to travel.
Application Of Machine Learning To Cancer Research
There are two ways to cancer, Prediction/Prognosis and Detection/Diagnosis. In cancer Prediction/Prognosis there are three core points:
- Prediction of cancer susceptibility (i.e. risk assessment)
- Prediction of cancer recurrence
- Prediction of cancer survivability
- Risk assessment is predicting the probability of developing a type of cancer prior to the occurrence of the disease. The prediction of cancer recurrence is about trying hard to discover the likelihood of re-developing cancer after to the apparent resolution of the disease. The predicting of cancer survivability is determining outcomes like life expectancy, progression, survivability, tumor-drug sensitivity after the diagnosis of the disease [17]. The quality of the diagnosis and other factors determines the success of the prognostic prediction. However, a medical diagnosis and a prognostic prediction must take into account more than just a simple diagnosis before disease prognosis can takes place.
Experts in cancer research have already compiled a list of features to dictate cancer cells, which is preferably to adding chemicals to blood samples that destroys cells. Refractive indices is an example of what data is used to help the machine predict and diagnose cancer and by using that, it tells us how much light slows down when passing through cells. It helps in light absorption, scattering properties as well as morphological features [17]. The input is an image, then the neural networks help identify the cancer cells by learning the relationships of what values of the features leads to cancer cells. The deep learning algorithm makes use of these features to classify cells based on learning the values of each feature that leads to a cancerous cell. Metastasized detection requires highly.
Artificial Intelligence
Artificial Intelligence manages more comprehensive issues of automating a system. This computerization should be possible by utilizing anything any field such as image processing, cognitive science, neural systems, machine learning etc. Most recent updates in Artificial Intelligence (AI) are due to application of machine learning to very large data sets. Artificial Intelligence is when computer algorithm does intelligent work. Artificial intelligence is the superset of machine learning i.e. all the machine learning is artificial intelligence but not all the AI is machine learning. Machine learning (ML) manages and influences user’s machine to gain from the external environment. This external environment can be sensors, electronic segments, external storage gadgets and numerous other devices. Machine Learning enables computers to learn by themselves. With the aid of modern computers, it is easier manipulating large data sets. The algorithms detect patterns and learn ways to make predictions and recommendations by processing data and experiences, instead of being explicitly written in program.
Machine Learning is made up of three major types:
- Supervised: In which data is labeled. The model is to identify the labels and put them in groups accordingly. In other words, the input is provided to the model and the desired output is offered. This process is done countless times until the desired output is obtained.
- Unsupervised:In which data is not labeled [18]. Different features and classifications have to be identified based on the distinct characteristics through the model. In this case, the input is given, but there is no expected output. The logical classifications or groupings are made by computer.
- Reinforcement: This learning treats the problem of finding optimal or sufficiently good actions for a situation in order to maximize a reward. In other words, it learns from interactions.
Algorithm for Cancer Cell Development Prediction
Machine learning algorithms have already revolutionized other fields, such as image recognition. However, the development from the first perception up to modern deep convolutional neural networks was a long and tortuous process. In order to produce significant results in cancer research, one necessarily has not only to play to the strength of machine learning techniques but also apply the lessons already learned in other fields (Figure 5) [19].
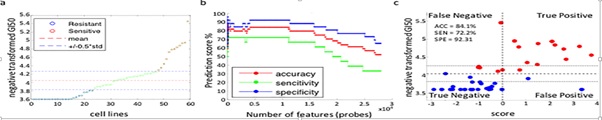 Figure 5: A Sample Algorithm for Cancer Prediction [19].
Conclusion
In conclusion, there has been an estimated 100 plus types of cancerous cells. This imposes difficulty in curing cancer. For example, if a certain group of similar cancer cells accepts a particular drug or treatment, it could have a peculiar different effect on another group.
- Skilled pathologists or radiologists that perform manual segmentation, which is time-consuming and prone to error, particularly in cases where tumors are few or there are no tumors. Deep learning networks have significantly enhanced accuracy on a wide range of computer vision tasks such as object detection, image recognition, and semantic segmentation.
- Machine learning is now a veritable tool used in cancer research labs to classify tumors based on growth characteristics; features such as where they grow, how fast they grow and size etc. and they are classified into groups based on similar range of predictive outcomes. The reason being that, one can create a controlled environment by picking a classified group and perform desired experiments to see the effect.
References
- Khan Academy launches free Official LSAT Prep June 1 2018 Archived from the original on March 21 2021. Retrieved 29.
- Jose A, Shenoy GG, Rodrigues GS, Naveena ANK, Munisamy M, et al. (2017) Histone Demethylase KDM5B as a Therapeutic Target for Cancer Therapy. Cancer 12: 2121.
- Schmidt J, Nicholas K, Hennig P (2021) A Probabilistic State Space Model for Joint Inference from Differential Equations and Data. Part of Advances in Neural Information Processing Systems 34 (NeurIPS 2021).
- Mandeep K, Drake AC, Guangan H, Stephen R, Qingfeng C, et al. (2019) Induction and Therapeutic Targeting of Human NPM1c+ Myeloid Leukemia in the Presence of Autologous Immune System in Mice. The Journal of Immunology 202: 1885-1894.
- Susan AND, Geoff T, Joel PVP, Madhusudana SN, Alexander IW (2007) Emergence of Arctic-like Rabies Lineage in India. Emerging Infectious Diseases 13: 111-116.
- Stefan L, Alex Z, Karoline P, Sebastian Z, Klaus Z, et al. (2019) CT imaging during treatment improves radiomic models for patients with locally advanced head and neck cancer. Radiotherapy and Oncology 130: 10-17
- Jan CP, Tatyana G, Thomas P, Michael B, Benedikt W, et al. (2019) Combining multimodal imaging and treatment features improves machine learning-based prognostic assessment in patients with glioblastoma multiforme. Cancer Medicine 8: 128-136.
- Pan S, Defeng W, Vincent CM, Lin S (2019) Comparison of Feature Selection Methods and Machine Learning Classifiers for Radiomics Analysis in Glioma Grading. Journals & Magazines IEEE Access 7: 102010 – 102020.
- Manojit C, Sourav S, Tamal G, Sitanath M (2013) Neuro-Genetic Impact on Cell Formation Methods of Cellular Manufacturing System Design: A Quantitative Review and Analysis. Computers & Industrial Engineering 64: 256-272.
- Iqbal HS (2019) A machine learning based robust prediction model for real-life mobile phone data. Internet of Things 5: 180-193.
- Koprowski R, Foster KR (2018) Machine learning and medicine: Book review and commentary. BioMed Eng Online 17: 17
- Subhankar C, Michael JB, Aaron RS, Surinder KB (2011) Current status of molecular markers for early detection of sporadic pancreatic cancer. Biochimica Biophysica Acta (BBA)-Reviews on Cancer 1815: 44-64.
- Anirban Banerji (2013) An attempt to construct a (general) mathematical framework to model biological “context-dependence”. Systems and Synthetic Biology 7: 221–227.
- Prasad P, Giovanni P (2018) Training replicable predictors in multiple studies. PNAS 115: 2578-2583.
- Elizabeth A, Ian BW, Douglas H (2011) Brivanib, a Dual FGF/VEGF Inhibitor, Is Active Both First and Second Line against Mouse Pancreatic Neuroendocrine Tumors Developing Adaptive/Evasive Resistance to VEGF Inhibition. Clinical Cancer Research 17: 5299-531.
- Andrew M (2016) Autoimmune Encephalopathies and Dementias. Dementia 22: 538-558.
- Joseph AC, David SW (2006) Applications of Machine Learning in Cancer Prediction and Prognosis. Cancer Informatics.
- Copeland BJ (2021) Artificial Intelligence in the Healthcare Industry. International Journal of Research in Humanities Artsand science 5: 2456-5571
- Konstantina K, Themis PE, Konstantinos PE, Karamouzis MV, Dimitrios IF (2015) Machine learning applications in cancer prognosis and prediction. Computational and Structural Biotechnology Journal 13: 8-17
Citation: Chibudike H, Chibudike E, Ezeanyanaso C, Odega N, Okpara V, et.al (2022) Review on the Application of Machine Learning to Cancer Research. Adv Ind Biotechnol 4: 013.
Copyright: © 2022 Eunice Chibudike, et al. This is an open-access article distributed under the terms of the Creative Commons Attribution License, which permits unrestricted use, distribution, and reproduction in any medium, provided the original author and source are credited.