Risk of Human Exposure to the Intestinal Schistosome, Schistosoma mansoni, across Seasons along the Senegal River
*Corresponding Author(s):
Rohr JRDepartment Of Biological Sciences, Environmental Change Initiative, Eck Institute Of Global Health, University Of Notre Dame, Notre Dame, IN, United States
Tel:574-631-3587,
Email:jrohr2@nd.edu
Abstract
Background: Schistosomiasis is an emerging disease associated with changes to the environment that have increased human contact rates with disease-causing parasites, flatworms that are released from freshwater snails. For example, schistosomiasis remains a major public health problem in Northern Senegal, where prevalence in schoolchildren often reaches 90%.
Aim: This study focuses on the impact of seasonality on the risk of human exposure (RHE) to Schistosoma mansoni, defined as the total number of cercariae (the free-living life stage that infects humans) shed from all Biomphalaria pfeifferi snails collected at a site using standardized methods. We focus on RHE because it is rarely quantified and a recent study demonstrated that snails stop shedding cercariae when snail densities increase and thus per capita snail resources become limited [2], suggesting that densities of snails might not be directly proportional to RHE to schistosomes.
Method: We sampled four water access points in three villages every other week during the early (Dry1) and later dry seasons (Dry2) and the rainy season, quantifying the abundance of infected and non-infected snail intermediate hosts, cercariae released per infected snail, and water chemistry. We used simple and multiple linear regressions to assess how seasonality and environmental parameters affect non-infected and infected snail abundance and RHE.
Results: Although RHE was found across all seasons, the abundance of infected and non-infected snail intermediate hosts and cercariae, as well as prevalence (23.71%), were all highest in the rainy season. In the rainy season, RHE was positively associated with the density of snail hosts and their periphyton food resource.
Conclusion: Although previous studies have examined the influence of seasonality on snail densities, few studies have explored the effects of seasonality on cercarial densities, which is the primary source of infection to humans. Our study demonstrates that cercarial densities are greater in the rainy season than in the early or late dry seasons. Given that cercarial densities directly pose risk of infection to humans, unlike non-infected or infected snails, these finding should help to inform decision making and schistosomiasis control efforts in West Africa.
Keywords
Linear regression model; Risk of human exposure; Schistosomiasis; Seasonality
Background
Infectious diseases are emerging globally at an unprecedented rate [1], and hosts and parasites are heterogeneous entities that exist in dynamic environments [2]. Globally, over 230 million people are infected with schistosomiasis, an infectious disease that is caused by parasitic helminthes [3-5]. Schistosomiasis remains a significant health burden in many areas of the world and ranks among the most important water-based diseases of humans in developing countries [6].
Schistosoma mansoni, the trematode (flatworm) that causes intestinal schistosomiasis, has a complex life cycle. While a vast proportion of S. mansoni eggs fail to leave the definitive human host and evoke potentially life-threatening pathology [7], S. mansoni eggs must migrate from the mesenteric vessels, across the intestinal wall, and into the feces to exit the human body and progress to their successive snail host. The excreted eggs hatch in the water resulting in a free-swimming miracidium that penetrates the intermediate snail host [8,9]. The flatworm then reproduces asexually to release cercariae from the snail [10]. The cercariae swim through the water in the hopes of penetrating the skin of definitive human hosts [11]. The worm reproduces sexually in humans and releases eggs in feces. If these eggs enter freshwater containing intermediate hosts, the life cycle can restart.
The abundance of intermediate host snails of human schistosomes is often strongly driven by environmental factors [12] and seasonality [13,14]. For example, the transformation of ecosystems in and around the Senegal River has created favorable environmental conditions for snails [12] and schistosomiasis, as described in past studies [15]. Similarly, seasonality can influence the amount of rain and thus aquatic habitat for snails.
Although previous studies have examined the influence of seasonality on snail densities [9,10], few studies have explored the effects of seasonality on cercarial densities, which is the primary source of infection to humans. This is an important gap in the literature because it was recently shown that snails stop shedding cercariae when snail densities increase and thus per capita snail resources become limited [2]. This creates a potential scenario where densities of snails might not be directly proportional to densities of cercariae, a proxy of the risk of human exposure (RHE) to schistosomes.
The aim of this study was to investigate how seasonality affects RHE to S. mansoni (i.e., number of cercariae shed from snails collected at water access points using standardized methods) along the Senegal and Lampsar Rivers in St. Louis, Senegal. We sampled four water access points in three villages every other week from October 2019 to October 2020 (n = 21visits per site), quantifying the abundance of infected and non-infected snail intermediate hosts, Biomphalaria pfeifferi, S. mansoni cercariae released per infected snail, and water chemistry. Thus, our sampling spanned the dry season that runs roughly from mid-October to mid-June, and the rainy season, which is approximately from late June to early October [16].
Method
Study sites and seasonal displaying
To select sites for our study, we initially quantified the abundance of snail hosts and cercariae parasites in the water access points of several villages in the Delta of the Senegal River. We focused on four water access points after our initial survey because they had a considerable abundance of B. pfeifferi snails infected with S. mansoni and humans regularly entering the water access point. We sampled intermediate hosts every other week at four water access points across three villages in Senegal, West Africa: Kaban (KA: 16° 3.338 N - 16°24.133 O) Minguegne (ME 1: 16°01.055' N - 16°21.397' O and ME2 :16°01.090' N - 16°21.369 O) and Ndiawdoune (NW: 16°4.075' N - 16°23.635' O). Kaban village is bordered by the Senegal River, Minguegne is bordered to the Ngalam outlet Senegal River in the “Trois marigots” zone and Ndiawdoune is bordered by the Lampsar River. Because the dry season spans roughly 9 months of the year in Senegal, we partitioned this season into early (Dry1) and late dry seasons (Dry2) corresponding to early in the season when temperatures were generally decreasing from late October to mid-January (29.4 C ≥ Dry1 ≥ 15.6 C) and later in the season, from mid-January to late June, when temperatures were generally increasing (19.9 < T (Dry2) ≤ 23.9).
Quantification of snail hosts
We used the snail sampling method described by Haggerty et al [15]. Briefly, at each water access point, we conducted 10 1-m sweeps with a 2.5-mm mesh aquatic dipnet at random sampling points. To select random points, the access point was mapped ahead of time, partitioned into a grid, and sections of the grid were selected randomly. Any aquatic plants in the dipnet were placed into a wash pale with water, shaken vigorously to remove snails, and examined for any attached snails before weighing the vegetation mass using a spring scale. We recorded the number of B. pfeiferii snails captured per sweep (Figure 1). We defined the density of snails as the number of snail hosts captured per site and per visit.
All collected snails were brought to the laboratory to determine if they were infected by S. mansoni. In the laboratory, individuals were exposed to a lamp for one hour (1 h) to promote schistosome cercarial shedding. Once cercariae were shed, S. mansoni, the unique schistosome species infecting B. pfeifferii in Senegal, were identified by their diagnostic forked tail and counted with the assistance of a dissecting microscope. Thus, RHE is defined as the total number of cercariae shed from all B. pfeiferii snails collected at a water access point using standardized methods during any snail collecting visit (Figure 1).
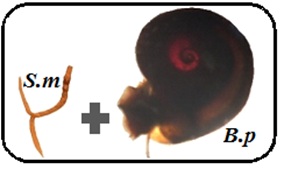 Figure 1: Risk of human exposure is defined as the total number of cercariae shed in collected snails at a water access point during any snail collecting visit and thus is the number of infected Biomphalaria pfeifferi (B.p.) x the mean number of Schistosoma mansoni (S.m.) cercariae shed per snail.
Environmental parameters predictors of hosts infection and RHE across seasonality
We recorded dissolved oxygen (DO), pH, water conductivity and water temperature using a YSI Professional Plus handheld multiparameter meter during each visit to each water access point. We also recorded periphyton and the phytoplankton fluorescence using an Aquapen AP 100-C handheld flourometer. Periphyton was collected from a study site during snail sampling (see below) by wading into the water and cutting a stem of Typha spp. vegetation at the water surface and again at a depth of 10 cm below the water. The 10 cm section of Typha was taken to the lab and its surface scrubbed using a toothbrush. We then washed all algae off the Typha and brush using deionized water into a 50mL falcon tube and filled all samples to a standardized volume of 50 mL. Chlorophyll a was then quantified by shaking the Falcon tube vigorously to homogenize, transferring a subsample from the Falcon tube to a1-mL cuvette, and recording Ft and Qy (which measure chlorophyll a and photosynthetic efficiency) values using the Aquapen. We recorded the surface area of Typha that was sampled and used it to standardize the periphyton fluorescence values based on sampling area. For the phytoplankton, we sampled open water at each site during each visit, transferred a 1-mL sample into a cuvette, and recorded the Ft and Qy values using the Aquapen.
Statistical analysis
We conducted our data analysis using R software version 4.0.5 (2021-03-31).To assess the significance of temperature on seasonality (model 1) and seasonality (Dry1, Dry2, and rainy) on RHE (model 2), we used two simple linear regression models. To elucidate how abiotic (pH, dissolved oxygen, water conductivity, water temperature, periphyton, phytoplankton) and biotic parameters (snail density, periphyton, phytoplankton, vegetation) affected the snail infection and RHE across seasons, we used three multiple linear regression models (model 3: model 3a, model 3b and model 3c), one for each of the three seasons Dry1, Dry2, and rainy. To each season we applied a model where the environmental parameters were predictors of RHE. To identify the best fit model, we included all variables as predictors and removed the single term with the highest non-significant p-value until the model contained only significant terms (S1 Table).
Results
Seasonal densities of Biomphalaria pfeifferi
Of the 895 Biomphalaria pfeifferi we collected in 840 sweeps across the four sites, 83 were collected in the Dry1season (9.27 %), 192 in the Dry2season (21.45 %), and 620 in the rainy (69.28 %) season (Table 1, Figure 2). All three seasons differed from one another in densities of snails (P< 0.05).
|
|
Mean |
Max |
|
|
|
Dry1 (N = 83) |
3.46 |
18.00 |
|
Seasons |
Dry2 (N = 192) |
9.60 |
33.00 |
|
|
Rainy (N = 620) |
15.50 |
87.00 |
|
Total (N = 895) |
10.65 |
87.00 |
|
Table 1: Total mean and maximum of the total and seasonal densities of Biomphalaria pfeifferi.
Seasonality of infected Biomphalaria pfeifferi
Of the 895 Biomphalaria pfeifferi we collected, a total of 168 shed S. mansoni cercariae for an overall prevalence of 18.77%. Of the S. mansoni -infected snails, 147 were found in the rainy season (infection rate = 87.5%), 19 during Dry2 (infection rate = 11.31 %) and only 2 individuals were found infected in the Dry1 period (infection rate = 1.19 %) (Figure 2). Thus, prevalence in the rainy, Dry2, and Dry1 seasons was 23.71%, 9.90%, and 2.40%, respectively. There was no significant relationship during the Dry1 season between density of snail hosts and density of infected snails (Figure 3), likely because of the extremely low prevalence during this season. In contrast, there was a significant relationship between total snail densities and infected snail densities in the Dry2 and rainy seasons (Figure 3).
|
|
Mean |
Max |
|
|
|
Dry1 (N = 2) |
0.08 |
1.00 |
|
Seasons |
Dry2 (N = 19) |
0.95 |
4.00 |
|
|
Rainy (N = 147) |
3.67 |
28.00 |
|
Total infected (N = 167) |
1.99 |
28.00 |
|
Table 2: Total, mean and maximum of the total and seasonal infected individuals of Biomphalaria pfeifferi.
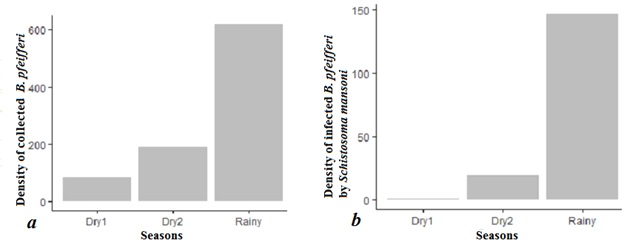 Figure 2: Histograms of collected (a) and infected (b) hosts densities across the seasons.
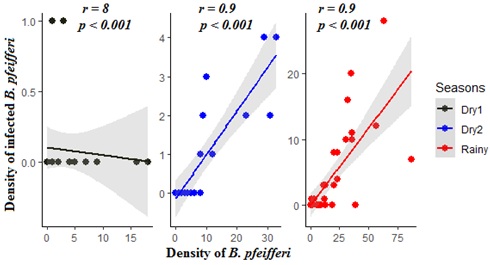 Figure 3: Linear relationship between density of hosts and infected hosts across seasonality.
Environmental factors predicting the infection of snails per season
Associations between environmental parameters and the abundance of infected snails in the early dry season were not conducted because we caught too few infected snails (two) to justify these analyses. In Dry2, the density of infected hosts was positively associated with the density of hosts and dissolved oxygen, and negatively associated with water temperature (Table 3). In the rainy season, the density of infected snails was positively associated with the density of snails and periphyton abundance, and negatively associated with pH, water temperature, and the density of Bulinus snails that are likely competitors with B. pfeifferi (Table 4).
|
Season |
Predictors |
Estimate |
Std. Error |
t value |
Pr(>|t|) |
|
Dry2 |
(Intercept) |
-5.39417 |
2.28482 |
-2.361 |
0.030 ** |
|
Density of hosts |
0.08755 |
0.01776 |
4.930 |
< 0.001*** |
|
|
Dissolved oxygen |
0.75913 |
0.32777 |
2.316 |
0.030* |
|
|
Rainy |
(Intercept) |
61.564843 |
21.117682 |
2.915 |
0.006 ** |
|
Density of hosts |
0.216169 |
0.029935 |
7.221 |
< 0.001*** |
|
|
pH |
-3.869580 |
1.464975 |
-2.641 |
0.010* |
|
|
Water Temperature |
-1.138422 |
0.401187 |
-2.838 |
0.007 ** |
|
|
Periphyton |
0.006423 |
0.001412 |
4.548 |
< 0.001*** |
|
|
Bulinus spp |
-0.027456 |
0.009795 |
-2.803 |
0.008** |
Table 3: Abiotic and biotic factors associated with the abundance of infected snails in the later dry season (Dry2) and the rainy season. Analyses were not conducted in the early dry season because we caught too few infected snails (two) to justify analyses.
From the 167 infected B. pfeifferi, a total of 10,644 S. mansoni cercariae were shed. Sixteen cercariae were produced in Dry1 (rate of parasite density = 0.15 %), 1,751 in Dry2 (rate of parasite density = 16.45%) and 8,877 (rate of parasite density = 83.4 %) in the rainy season.
|
|
Mean |
Max |
|
|
|
Dry1 (N = 16) |
0.66 |
10 |
|
Seasons |
Dry2 (N = 1751) |
87.55 |
449 |
|
|
Rainy (N = 8877) |
221.93 |
2370 |
|
Total infected (N = 10644) |
126.71 |
2370 |
|
Table 4: Total, mean, and maximum of seasonal cercariae shed.
There was strong and significant relationship between density of infected snails and the RHE in all seasons (Figure 4).
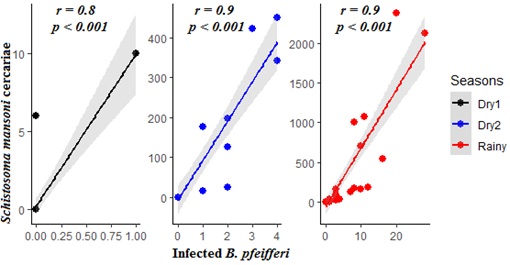 Figure 4: Linear relationship between infected hosts and cercariae production across the seasonality.
Even if the density of infected snail hosts was significantly associated to the RHE in all seasons, RHE was only significantly different from zero in the rainy season (P= 0.03) (Figure 5).
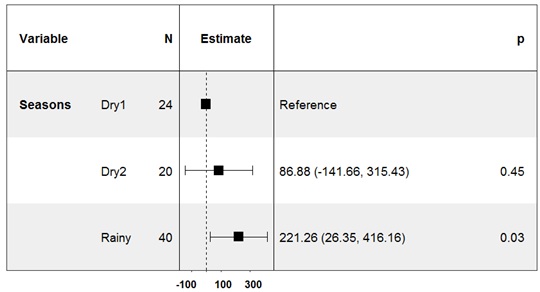 Figure 5: Forest plot of the linear model showing the coefficient for risk of human exposure (RHE) to Schistosoma mansoni across the three seasons. RHE was only significantly different from zero in the rainy season.
Environmental factors predicting the RHE per season
In Dry1, RHE was associated positively with water temperature, and negatively with the density of Bulinus spp. snails and water conductivity (Table 5). In Dry2, RHE was associated positively with the density of Bulinus spp. snails (Table 5). In the rainy season, RHE was associated positively with the density of B. pfeifferi and periphyton, and negatively with the abundance of Bulinus spp. snails (Table 5).
|
|
Predictors |
Estimate |
Std. Error |
t value |
Pr(>|t|) |
|
|
Seasons |
Dry1 |
(Intercept) |
-3.38719 |
2.10890 |
-1.606 |
0.123917 |
|
Water Temperature |
0.57016 |
0.13976 |
4.080 |
< 0.001*** |
||
|
Bulinussp |
-0.03956 |
0.01306 |
-3.028 |
0.007 ** |
||
|
Water Conductivity |
-0.05316 |
0.01478 |
-3.597 |
0.002** |
||
|
Dry2 |
(Intercept) |
-46.989 |
32.705 |
-1.437 |
0.168 |
|
|
Bulinusspp |
2.097 |
0.387 |
5.419 |
< 0.001*** |
||
|
Rainy |
(Intercept) |
-167.0064 |
94.2808 |
-1.771 |
0.08. |
|
|
Density of hosts |
12.3690 |
3.7162 |
3.328 |
0.002 ** |
||
|
Bulinussp |
-3.1513 |
1.1795 |
-2.672 |
0.01 * |
||
|
Periphyton |
0.7327 |
0.1641 |
4.465 |
< 0.001*** |
||
Table 5: Multiple regression model results predicting RHE across seasons.
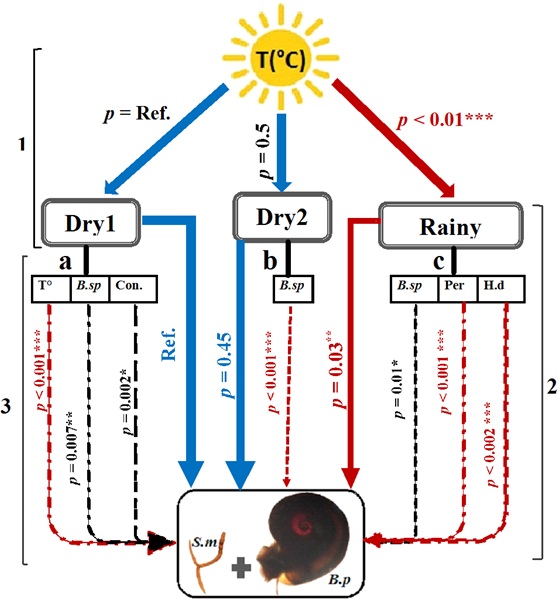 Figure 6: Summarized results of models eliciting effects of seasonality and biotic and abiotic factors on the risk of human exposure (RHE) to Schistosoma mansoni along of the Senegal River of Senegal. S.m = Schistosoma mansoni (parasite), B.f = Biomphalaria pfeifferi (intermédiate snail host).We built two simple regression models (1, 2) and three multiple regression models (3: a, b and c) model 1= Temperature prediction across seasonality: T(°C) = temperature, model 2 = RHE by seasonality; model 3 = multiple regression model between environmental parameters and the RHE per season: a = Dry1 model: T° = temperature, B. sp = Bulinus species and con. = conductivity. b = Dry2 model and c =rainy model: per = periphyton. Dry1, Dry2 and rainy are the different seasons. P = p-value obtained from output of the models. The red lines refer to the positive significant prediction, the black to the negative significance, the doted refer to the abiotic and biotic parameters predictors and the blue lines refer to the no significant responses.
Discussion
Seasonal densities of Biomphalaria pfeifferi
Snail density contributes directly to the force of human infection [17,18], as schistosomiasis transmission is dependent on the presence of compatible snail intermediate hosts at water-contact sites [14]. The transformation of ecosystems in the Senegal River has created favorable biotopes to the development of intermediate host snails of human schistosomes [12]. The presence of the intermediate host B. pfeifferi in our study region was previously described by several other authors [12,13,15,19,20], and is only second to Bulinus truncatus in abundance in this part of Senegal. We found the greatest density of the snail hosts during the rainy season. This finding is likely because of the dependence of B. pfeifferi on freshwater environments and resource availability in these environments. This hypothesis is consistent with the documentation that seasonal variation in temperature, rainfall and resource availability ubiquitously exert strong pressures on host-parasite systems [21].The lowest densities of snails were found during the Dry1 season, corresponding to decreasing temperatures. Given the role of temperature on natural process, declining temperature might slow down host development and limit food resources.
Seasonality dynamic and environmental factors predicting snail hosts infection and the RHE
Environmental conditions experienced by hosts are known to affect parasite transmission [22] and may mediate the outcome of infection [23].These environmental factors, coupled with human behavior, likely act together to facilitate the acquisition and accumulation of schistosome infections across space and time [24].Both snail infection and RHE were significantly associated with several biotic and abiotic factors and seasonality. We found that there was a significant seasonal signature on the density of infected hosts and RHE, consistent with the findings of Gurarie et al. [17]. In general, across both the Dry2 and rainy season RHE was positively associated with the density of snails and periphyton. The density of hosts and dissolved oxygen (with their greatest measures) were associated with the number of infected hosts but not with the RHE during Dry2. The RHE was only predicted by the density of Bulinus species that we collected simultaneously with B. pfeifferi during this period. In contrast to B. pfeifferi, the density of Bulinus species was negatively associated with RHE in the rainy season. Interestingly, Bulinus species are competitors with B. pfeifferi and had a negative relationship with B. pfeifferi in the Dry2 season when resources are scarcer than in the rainy season, but a positive relationship with B. pfeifferi in the rainy season when food resources are more abundant. This finding is consistent with Civitello et al. [2] who showed in outside mesocosms that snails stop shedding cercariae when snail densities, and thus per capita snail resources, become limited.
The rainy season harbored over 87% of infected hosts. We did not quantify inputs of chemical fertilizers but, during the rainy season, water bodies regularly receive runoff from crop fields. This process can increase the growth of aquatic vegetation and periphytic algae that constitute the habitat and food resource, respectively, for snail hosts [26-28]. In past studies, authors found that agrochemicals might affect the transmission of schistosomes and other trematodes, as well as snail intermediate hosts, snail predators, and snail algal resources [6,26-38].Periphyton was most abundant in the rainy season and the schistosome parasites rely on host feeding for their own growth, survival, and reproduction [39,40].The fact that the abundance of infected hosts was associated negatively with temperature during the rainy season may be explained by maximal temperatures during this season (32.5 °C) being detrimental to snails or to free-living larval stages of the parasite [41]. Importantly, parasitism, including schistosomiasis, is expected to change in a warmer world [42-47]. For example, several authors predict that S. mansoni infection risk may increase across much of eastern Africa as temperatures increase over the next few decades [48,49].
Conclusion
Few studies have explored the effects of seasonality on cercarial densities, which is the primary source of infection to humans. This is an important gap in the literature because snails stop shedding cercariae when snail densities increase and thus per capita snail resources become limited [2]. This creates a potential scenario where densities of snails might not be directly proportional to densities of cercariae, a proxy of the RHE to schistosomes [50]. Although snails shed less when snail densities peak, we did find a strong seasonal signature to RHE. RHE was unequivocally the highest in the rainy season relative to the early and late dry seasons. Additionally, densities of both noninfected and infected snails were also highest in the rainy season. Thus, despite resource competition and limitations affecting RHE, risk of schistosomiasis along the Senegal River is highest in the productive rainy season.
References
- Rohr JR, Barrett CB, Civitello DJ, Craft ME, Delius B, et al. (2019) Emerging human infectious diseases and the links to global food production. Nat Sustain 2: 445-456.
- Civitello DJ, Fatima H, Johnson LR, Nisbet RM Rohr JR (2018) Bioenergetic theory predicts infection dynamics of human schistosomes in intermediate host snails across ecological gradients. Ecol Lett 21: 692-670.
- You H, Jones MK, Whitworth DJ, McManus DP (2021) Innovations and Advances in Schistosome Stem Cell Research. Front Immunol 12: 599014.
- Trienekens SCM, Faust CL, Meginnis K, Pickering L, Ericsson O, et al. (2020) Impacts of host gender on Schistosoma mansoni risk in rural Uganda- A mixed-methods approach. PLoS Negl Trop Dis 14: e0008266.
- Lo NC, Gurariec D, Yoon N, Coulibalye JT, Bendavid E, et al. (2018) Impact and cost-effectiveness of snail control to achieve disease control targets for schistosomiasis. PNAS 115: E584-E591.
- Halstead NT, Hoover CM, Arakala A, Civitello DJ, De Leo GA, et al. (2018) Agrochemicals increase risk of human schistosomiasis by supporting higher densities of intermediate hosts. Nat Commun 9: 837.
- Costain AH, MacDonald AS, Smits HH (2018). Schistosome Egg Migration: Mechanisms, Pathogenesis and Host Immune Responses. Frontiers in immunology 9: 3042.
- Lund AJ, Sam MM, Sy AB, Sow OW, Ali S, et al. (2019) Unavoidable Risks: Local Perspectives on Water Contact Behavior and Implications for Schistosomiasis Control in an Agricultural Region of Northern Senegal. Am J Trop Med Hyg 101: 837-847.
- Civitello DJ, Rohr JR (2014) Disentangling the effects of exposure and susceptibility on transmission of the zoonotic parasite Schistosoma mansoni. J Anim Ecol 83: 1379-1386.
- McCreesh N, Booth M (2013) Challenges in predicting the effects of climate change on Schistosoma mansoni and Schistosoma haematobium transmission potential. Trends Parasitol 29: 548-555.
- Jones DK, Davila DD, Nguyen KH, Rohr JR (2020) Effect of Agrochemical Exposure on Schistosoma mansoni Cercariae Survival and Activity. Environ Toxicol Chem 39: 1421-1428.
- Bakhoum S, Ndione RA, Haggerty CJE, Wolfe C, Sow S, et al. (2019) Influence des paramètres physico-chimiques sur la répartition spatiale des mollusques hôtes intermédiaires des schistosomes humains dans le delta du fleuve Sénégal. Med Sante Trop 29: 61-67.
- Bakhoum S, Haggerty CJE, Ba CT, Jouanard N, Riveau G, et al. (2021) Seasonal variations of densities of Biomphalaria pfeifferi, the intermediate host of Schistosoma mansoni parasite at the North of Senegal. Intech Open Chapter: Basic Appl Malacol.
- Rabone M, Wiethase JH, Allan F, Gouvras AN, Pennance T, et al. (2019) Freshwater snails of biomedical importance in the Niger River Valley: Evidence of temporal and spatial patterns in abundance, distribution and infection with Schistosoma spp. Parasit Vectors 12: 498.
- Haggerty CJE, Bakhoum S, Civitello DJ, De Leo GA, Jouanard N, et al. (2020) Aquatic macrophytes and macro invertebrate predators affect densities of snail hosts and local production of schistosome cercariae that cause human schistosomiasis. PLoS Negl Trop Dis 14: e0008417.
- Fall S, Niyogi D, Semazzi FHM (2006) Analysis of Mean Climate Conditions in Senegal (1971-98). Earth Interact 10: 1-40.
- Gurarie D, King CH, Yoon N, Wang X, Alsallaq R (2017) Seasonal dynamics of snail populations in coastal Kenya: Model calibration and snail control. Advances in Water Resources 108: 397-405.
- Liu ZY, Chamberlin AJ, Shome P, Jones IJ, Riveau G, et al. (2019) Identification of snails and parasites of medical importance via convolutional neural network: an application for human schistosomiasis. PLOS Negl Trop Dis.
- Ndir O (2000) Situation des Schistosomes au Sénégal. In : Chippaux JP. Lutte contre les schistosomes en Afrique de l’Ouest, 15-18 février. Niamey-Cermes. Paris IRD pp. 225-236.
- Diaw OT (1997) Population dynamics of schistosome intermediate host snails in a village in the delta of the Senegal river basin. Proceedings of workshop on medical malacology in africa. Service de Parasitologie, Harare, Zimbabwe pp. 173-184.
- Altizer S, Dobson A, Hosseini P, Hudson P, Pascual M, et al. (2006) Seasonality and the dynamics of infectious diseases. Ecol Lett 9: 467-484.
- Vale PF, Choisy M, Little TJ (2013) Host nutrition alters the variance in parasite transmission potential. Biol Lett 20121145.
- Tseng M (2006) Interactions between the Parasite’s Previous and Current Environment Mediate the Outcome of Parasite Infection. Am Nat 168: 565-571.
- Lund AJ, Sokolow SH, Jones IJ, Wood CL, Chamberlin A, et al. (2021) Exposure, hazard, and vulnerability and their contribution to Schistosoma haematobium re-infection in northern Senegal. Lancet Planet Health 5: 2542-5196.
- Donnelly R, Best A, White A, Boots M (2013) Seasonality selects for more acutely virulent parasites when virulence is density dependent. Proc R Soc B 280: 20122464.
- Becker JM, Ganatra AA, Kandie F, Mühlbauer L, Ahlheim J, et al. (2020) Pesticide pollution in freshwater paves the way for schistosomiasis transmission. Sci Rep 10: 3650.
- Rohr JR, Halstead NT, Raffel TR (2012) The herbicide atrazine, algae, and snail populations. Environ Toxicol Chem 31: 973-976.
- Halstead NT, McMahon TA, Johnson S, Raffel TR, Romansic JM, et al. (2014) Community ecology theory predicts the effects of agrochemical mixtures on aquatic biodiversity and ecosystem properties. Ecol Lett 17: 932-941.
- Rohr JR, Civitello DJ, Crumrine PW, Halstead NT, Miller AD, et al. (2015) Predator diversity, intraguild predation, and indirect effects drive parasite transmission. PNAS 112: 3008-3013.
- Rohr JR, Schotthoefer AM, Raffel TR, Carrick HJ, Halstead N, et al. (2008) Agrochemicals increase trematode infections in a declining amphibian species. Nature 455: 1235-1239.
- Schotthoefer AM, Rohr JR, Cole RA, Koehler AV, Johnson CM, et al. (2011) Effects of wetland and landscape variables on parasite communities of Rana pipiens: links to anthropogenic changes. Ecol Appl 21: 1257-1271.
- Staley ZR, Harwood VJ, Rohr JR (2015) A synthesis of the effects of pesticides on microbial persistence in aquatic ecosystems. Crit Rev Toxicol 45: 813-836.
- Haggerty CJE, Halstead NT, Civitello DJ, Rohr JR (2021) Reducing disease and producing food: Effects of 13 agrochemicals on snail biomass and human schistosomes. bioRxiv 2021.01.05.425422.
- Haggerty CJE, Delius B, Jouanard N, Ndaod PD, De Leo GA, et al. (2020) Identifying low risk insecticides that can enhance food production without increasing mortality of biocontrol agents for human schistosomiasis. bioRxiv 2021.01.05.425425.
- Halstead NT, Civitello DJ, Rohr JR (2015) Comparative toxicities of organophosphate and pyrethroid insecticides to aquatic macroarthropods. Chemosphere 135: 265-271.
- Hoover CM, Rumschlag SL, Strgar L, Arakala A, Gambhir M, et al. (2020) Effects of agrochemical pollution on schistosomiasis transmission: a systematic review and modelling analysis, Lancet Planet Health4: e280-e291.
- Rumschlag SL, Halstead, NT, Hoverman JT, Raffel TR, Carrick HJ, et al. (2019) Effects of pesticides on exposure and susceptibility to parasites can be generalized to pesticide class and type in aquatic communities. Ecol Lett 22: 962-972.
- Rumschlag SL, Mahon MB, Halstead NT, Hoverman JT, Raffel TR, et al. (2020) Consistent effects of pesticides on community structure and ecosystem function in freshwater systems. Nat Commun 11: 6333.
- Regoes RR, Nowak MA, Bonhoeffer S (2000) Evolution of virulence in a heterogeneous host population. Evolution 54: 64-71.
- Civitello DJ, Baker LH, Maduraiveeran S, Hartman RB (2020) Resource fluctuations inhibit the reproduction and virulence of the human parasite Schistosoma mansoni in its snail intermediate host. Proc R Soc B 287: 20192446.
- Nguyen KH, Gemmell BJ, Rohr JR (2020) Effects of temperature and viscosity on miracidial and cercarial movement of Schistosoma mansoni: ramifications for disease transmission. Int J Parasitol 50: 153-159.
- Rohr JR, Cohen JM (2020) Understanding how temperature shifts could impact infectious disease. PLoS Biology 18: e3000938.
- Cohen JM, Sauer EL, Santiago O, Spencer S, Rohr JR (2020) Divergent impacts of warming weather on disease risk across climates. Science 370: eabb1702.
- Cohen JM, Civitello DJ, Venesky MD, McMahon TA, Rohr JR (2019) An interaction between climate change and infectious disease drove widespread amphibian declines. Glob Chang Biol 25: 927-937.
- Rohr JR, Dobson AP, Johnson PTJ, Kilpatrick AM, Paull SH, et al. (2011) Frontiers in climate change-disease research. Trends Ecol Evol 26: 270-277.
- Raffel TR, Romansic JM, Halstead NT, McMahon TA, Venesky MD, et al. (2013) Disease and thermal acclimation in a more variable and unpredictable climate. Nat Clim Chang 3: 146-151.
- Rohr JR, Raffel TR, Blaustein AR, Johnson PTJ, Paull SH, et al. (2013) Using physiology to understand climate-driven changes in disease and their implications for conservation. Conserv Physiol 1: cot022-cot022.
- McCreesh N, Nikulin G, Booth M (2015) Predicting the effects of climate change on Schistosoma mansonitransmission in eastern Africa. Parasit Vectors 8: 4.
- Nguyen KH, Boersch-Supan PH, Hartman RB, Mendiola SY, Harwood VJ, et al. (2021) Interventions can shift the thermal optimum for parasitic disease transmission. PNAS 118: e2017537118.
- Arakala A, Hoover CM, Marshall J, Sokolow S, de Leo G, et al. (2019) Estimating the elimination feasibility in the 'end game' of control efforts for parasites subjected to regular mass drug administration: Methods and their application to schistosomiasis. PLoS Negl Trop Dis 12: e0006794.
Supporting Information
|
Predictors |
Estimate |
Std. Error |
t value |
Pr(>|t|) |
|
(Intercept) |
-2.0429524 |
6.4340374 |
-0.318 |
0.751754 |
|
Density of hosts |
0.2110943 |
0.0290041 |
7.278 |
3.17e-10 *** |
|
pH |
-0.1421507 |
0.4206818 |
-0.338 |
0.736404 |
|
Temperature |
0.1233653 |
0.1213435 |
1.017 |
0.312672 |
|
Bulinus spp |
-0.0174996 |
0.0079046 |
-2.214 |
0.029964 * |
|
Periphyton |
0.0034901 |
0.0009815 |
3.556 |
0.000665 *** |
|
Vegetation mass |
-0.0001518 |
0.0002398 |
-0.633 |
0.528690 |
|
Dissolved oxygen |
0.0277973 |
0.2769924 |
0.100 |
0.920338 |
|
Conductivity |
-0.0010181 |
0.0203757 |
-0.050 |
0.960284 |
|
Phytoplankton |
-0.0098581 |
0.0056870 |
-1.733 |
0.087240 |
|
Salinity |
24.2520062 |
34.2393410 |
0.708 |
0.481010 |
S1 Table: List of all used predictors in the starting full model: host density (Biomphalaria pfeifferi individuals), temperature, conductivity, pH, salinity, dissolved oxygen, vegetation mass, periphyton, competitors (Bulinus sp) and phytoplankton. If t-statistics < 0.05, associated predictor was retained in a model, while t-statistics > 0.05, the associated predictor was dropped. To fit the best model, we included all variables (abiotic and biotic) as predictors in the model and we removed the single term with the highest non-significant p-value until the model contains only significant terms. Example: full starting model on an overall prediction of snail’s infection by factors.
|
|
Seasons |
||
|
Social Human Activities |
Dry1 |
Dry2 |
Rainy |
|
Swimming |
+ |
+++ |
+++ |
|
Irrigation |
+++ |
+++ |
--- |
|
Dishes wash |
+++ |
+++ |
+++ |
|
Landry wash |
+++ |
+++ |
+++ |
|
Fishing |
+++ |
+++ |
+++ |
S2 Table: Social human activities linked to human risk exposure.
(+) = presence of activity and (-) = absence of activity. Human was frequented freshwater (Table 1). Most of the time they were making their domestically activities: washing-up, swimming, fishing or drawing water for crops irrigation. During all our monitoring in all seasons we had found at each site to each sample visit, humans making their activities into the water and they were directly exposed to infection (if cercariae are produced by snail), indirectly exposed (if snails were infected), or not exposed to the aquatic free-life stage (cercariae) of Schistosoma mansoni (when there was any snail host infected).
|
Predictors |
Estimate |
Std. Error |
t value |
Pr(>|t|) |
|
(Intercept) |
0.6667 |
77.4424 |
0.009 |
0.9932 |
|
Dry2 |
86.8833 |
114.8656 |
0.756 |
0.4516 |
|
Rainy |
221.2583 |
97.9577 |
2.259 |
0.0266 * |
S3 Table: Significant response from a simple linear regression model of the RHE prediction by seasonality factor, p-value = 0.03.
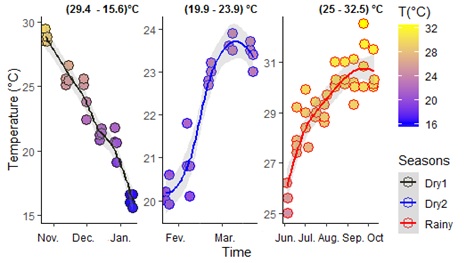
S1 Figure: Seasonal dynamic of water temperature recording.
There was a linear dynamic of temperature that was highly in variation per season (e.g.: 25°- 32.5° during Rainy) and from a season to another: e.g.: (29.4°-15.6° in Dry1 and 19.9°-23.9° in Dry2). The measures decrease and fall to 15.6° C (minimum) in Dry1 season. When it was in increasing in Dry2 and Rainy seasons, it reached a peak (maximum) of 32.5° C. This greatest water temperature (32.5° C) was found in Rainy period and the weakest (15.6° C) during the Dry1 season. However, temperature declined earlier in October. The Rainy season was significantly associated to the temperature (p-value = 0.001).
Citation: Bakhoum S, Ba CT, Haggerty CJE, Jouanard N, Riveau G, et al. (2021) Risk of Human Exposure to the Intestinal Schistosome, Schistosoma mansoni, across Seasons along the Senegal River. J Gastroenterol Hepatology Res 6: 038.
Copyright: © 2021 Bakhoum S, et al. This is an open-access article distributed under the terms of the Creative Commons Attribution License, which permits unrestricted use, distribution, and reproduction in any medium, provided the original author and source are credited.