Safety and Hepatoprotective Assessments of Polyherbal Formulation in Lead and Acetaminophen-induced Hepatotoxicity in Rats
*Corresponding Author(s):
Richard SedeaforHepato-Renal Research Group, Department Of Biochemistry And Biotechnology, College Of Science, Kwame Nkrumah University Of Science And Technology (KNUST), Kumasi, Ghana
Email:richardsedeafor6@gmail.com
Abstract
Liver disease is a major health problem as it continues to lead to so many deaths worldwide. The cost of treatment for liver diseases is very costly, thus treatment options become available to only a select few. Therefore, it has become necessary to protect the liver against injury. This study aimed at assessing the safety and hepatoprotective activity of a polyherbal formulation of ginger, turmeric, cinnamon, moringa and black pepper extracts against lead and acetaminophen-induced hepatotoxicity. Materials and Methods: Extracts were characterized by phytochemical screening, heavy metals analyses, Invitro antioxidant assays such as DPPH, assessment of total phenolics in comparison to gallic acid, assessment of total flavonoids in comparison to quercetin. Hepatoprotective activities were assessed using the Lead model (50mg/kg) and para model (500mg/kg). Extracts were tested at 100 mg/kg, 250 mg/kg and 500 mg/kg btw and Silymarin as standard drug (100 mg/kg). Serum liver function was assessed based on liver biochemical parameters such as ALT, GGT, TBIL. Histological examinations were made on the liver sections. Results: Saponins and terpenoids were present in the aqueous extract while alkaloids, phenols, saponins, tannins and terpenoids were present in the 50% hydroethanolic extract. Heavy metals such as Cr and Pb were below detection limits in both extracts while Cu, Fe and Ni were within acceptable limits accepted by FAO/WHO. Both extracts exhibited good free radical scavenging activity. The extracts did not have significant effect on relative organ weight. Treatment with lead and acetaminophen (para) induced hepatocellular injury with significant (p < 0.05) increase in the levels of ALT, AST, ALP, GGT and total bilirubin (TBIL), and inflammatory indices (NLR and PLR). However, co-treatment with the aqueous and 50% hydroethanolic extracts resulted in significant (p < 0.05) decrease in these parameters. The biochemical data were confirmed by histological observations. Conclusion: This study suggests that the polyherbal formulation of ginger, turmeric, cinnamon, moringa and black pepper extracts is safe and possesses significant hepatoprotective activity.
Keywords
Acetaminophen; Hepatoprotective; Hepatotoxicity; Lead; Polyherbal; Safety
Introduction
The liver is the second largest and an essential organ in the body. It performs a lot of functions which include but not limited to assisting in blood clotting, eliminating toxins from the blood, combating infections and illnesses, the ability to regenerate after an injury, metabolizing cholesterol, glucose, iron as well as regulating their levels [1]. Liver injury due to environmental toxicants and drugs can lead to complete loss in the functions of the liver and this can further lead to death [1].
Liver disease remains one of the main causes of death yearly and accounts for about 3.5% of all deaths that occur worldwide [2]. According to the latest data, about 3.46% of total deaths in Ghana are attributed to liver diseases with the adjusted rate being 36.74 per 10,000 [2]. One of the main causes of liver diseases is drug overdose. Drug-induced liver injury accounts for about 50% of total cases of acute liver failure [3]. Acetaminophen remains the most common cause of acute liver injury, with cases rising each year [4]. Apart from drugs, environmental toxicants are also responsible for many cases of liver injury. Lead is a well-known environmental toxicant that has detrimental effects on people’s health and still remains an important public health problem [5]. In many parts of West Africa, Lead exposure exceeds the recommended limits set by the World Health Organization [6]. Liver transplantation has become the first-choice treatment for the management of liver conditions. Although this method has been hailed in the past, it is now facing certain setbacks such as having a mortality rate of about 5% and also 1 and 5 years survival rate of 85% and 65% respectively. Besides, this mode of treatment is very expensive for people to afford and also comes with other medical consequences such as frequent hospitalization with a rise in the cost of care, unavailability of donors and increased mortality rate [7]. Apart from this mode of treatment, certain synthetic drugs are also employed in the management of liver conditions. These drugs do not only come with their own side effects but also come with high cost hence side-lining the ordinary in the society from affording. Thus, it has become necessary to look for cost effective and safe means of protecting the liver from drugs and environmental toxicants induced liver injury.
Since time immemorial, natural products have been employed in the treatment of numerous illnesses. Natural products have now gained so much attention and are now referred to as natural medicine. They are seen to be safer and cost effective than their synthetic counterparts. Plants are the ultimate source of a large number of natural drugs [8]. Spices such as ginger (Zingiber officinale), turmeric (Curcuma longa), cinnamon (Cnnamomum verum), moringa (Moringa oleifera) and black pepper (Piper nigrum) are natural food condiments which are used in the preparation of our daily diets. They have been used since time immemorial to enliven our foods. They house both nutritional and medicinal properties. Due to their health benefits, they are employed in the medical field for the management and treatment of numerous illnesses. They have both antioxidant and anti-inflammatory potentials [9]. There has not been any report on the safety and hepatoprotective activity of a polyherbal formulation of ginger, turmeric, cinnamon, moringa and black pepper. Therefore, this study aimed at assessing the safety and hepatoprotective activity of a polyherbal of a polyherbal formulation of Ginger, Turmeric, Cinnamon, Moringa and Black Pepper (GTCMB) extracts in lead and acetaminophen-induced hepatotoxicity.
Materials And Methods
- Chemicals
Ethanol was obtained from Changshu Hongsheng Fine Chemicals Co. Ltd. (China). All other chemicals and reagents were of analytical grade and were obtained from standard suppliers.
- Plant collection and Extraction
Plant materials. Fresh ginger roots, turmeric stem, cinnamon bark, moringa leaves and black pepper fruit were obtained from a nearby market within the KNUST environ in Kumasi in the Ashanti region of Ghana in September 2021. The various parts of these spices were, washed, air dried and milled into a powder. A 100 g each of the milled ginger, turmeric, cinnamon and moringa were weighed. A 25 g of the milled black pepper was also weighed. They were then transferred into a Ziplock bag and mixed thoroughly. A 50% hydroethanolic extraction and aqueous extraction were carried out by suspending the mixture in 5000mL of 50% ethanol (50:50, ethanol: water, v/v) and 500mL of distilled water respectively. The mixture was then left to stand for 24 hours in the dark. The liquid extract was then decanted and the sediment was squeezed in a clean white cloth over a pan to obtain more liquid extract. The liquid extract was then filtered using a cotton wool and dried over a water bath at 70 0C allowing the evaporation of some of the ethanol content before freeze drying using a freeze dryer. The freeze-dried samples were then conveyed into sterile zip lock. Preparation of the doses for the study was done by reconstituting the extracts in freshly distilled water. The extracts were analysed for phytochemical constituents using standard procedures [10], in vitro antioxidant assays such as DPPH scavenging activity [11], total phenolic [12] and total flavonoid determination [13]. Heavy metals composition was also assessed using standard procedures [14]. FTIR spectrometer was used for functional group assessment.
- Animals
Adult male rats of Wistar strain with a weight ranging between 130 and 150 g were obtained from the animal facility of the Department of Biochemistry and Biotechnology, KNUST were used in this study. They were kept under standard laboratory conditions and handled as stipulated in the guidelines of the Committee for the purpose of Control and Supervision of Experiment on Animals (CPCSEA, New Delhi, India). The Animals were housed at Clinical Analyses Laboratory of the department of Biochemistry and Biotechnology, KNUST-Kumasi in clean plastic cages bedded with wood shavings which were changed daily and the animals were kept under standard laboratory conditions of humidity and temperature. They were also given standard feed and distilled water, except for an overnight fast before being sacrificed. They were also given the opportunity to adapt to their new environment for seven days before the experiment. They were then marked uniquely on their tails with permanent markers for easy identification. Animals were humanely handled according to the Guide for Care and Use of Laboratory Animals [15]. The protocol for the animal study was reviewed and approved by a veterinarian in the team.
- Treatments
Sixty-nine animals (23 groups, n= 3) were employed to study the acute safety and hepatoprotective activity the polyherbal formulation of ginger, turmeric, cinnamon, moringa and black pepper extracts in lead and acetaminophen-induced hepatotoxicity. Details of the experimental design and treatments are shown in tables 1-3. In the acute safety study (Table 1), Group 1 served as a vehicle control. Group 1 received 1mL/kg body weight (b.wt) of distilled water throughout the experiment. Group II, III and IV were treated with 100 mg/kg, 250 mg/kg and 500 mg/kg of the aqueous extracts only throughout the study. Group V, VI and VII were also treated with 100 mg/kg, 250 mg/kg and 500 mg/kg of the 50% hydroethanolic extract throughout the study. In the Lead model (Table 2), Group 1 served as a vehicle control. Group 1 received 1mL/kg body weight (b.wt) of distilled water throughout the experiments. Group II to IX were treated with 1 mL of 50 mg/kg Lead acetate (Pb (Ac)2) intraperitoneally on day 2,3,4 and 6. Group II was maintained as Pb (Ac)2 control without any drug treatment. Group III was treated with standard hepatoprotective agent (100 mg/kg b.wt silymarin orally), from day 1 to 8. Group IV, V and VI were co-treated with 100 mg/kg, 250 mg/kg and 500 mg/kg aqueous extracts from day 1 to 8. Group VII, VIII and IX were co-treated with 100 mg/kg, 250 mg/kg and 500 mg/kg 50% hydroethanolic (HE) extract from day 1 to 8. In the para model (Table 3), Group 1 served as a vehicle control. Group 1 received 1mL/kg body weight (b.wt) of distilled water throughout the experiment. Group II to IX were treated with 1 mL of 500 mg/kg paracetamol (para) orally from day 2 to day 8. Group II was maintained as Para control without any drug treatment. Group III was treated with standard protective agent (silymarin) orally for 8 consecutive days. Group IV, V, VI were co-treated with 100 mg/kg, 250 mg/kg and 500 mg/kg aqueous extract from day 1 to 8. Group VII, VIII and IX were co-treated with 100 mg/kg, 250 mg/kg and 500 mg/kg 50% HE from day 1 to 8.
|
Group Number |
Group |
Treatment |
|
I |
Normal (Control) |
Water p.o (1 mL/kg b.wt) |
|
II |
100 mg AQ only |
100 mg/kg Aqueous (AQ) only (per day, p.o.) for 8 consecutive days |
|
III |
250 mg AQ only |
250 mg/kg AQ only (per day, p.o.) for 8 consecutive days |
|
IV |
500 mg AQ only |
500 mg/kg AQ only (per day, p.o.) for 8 consecutive days |
|
V |
100 mg HE only |
100 mg/kg Hydroethanolic (HE) only (per day, p.o.) for 8 consecutive days |
|
VI |
250 mg HE only |
250 mg/kg HE only (per day, p.o.) for 8 consecutive days |
|
VII |
500 mg HE only |
500 mg/kg HE only (per day, p.o.) for 8 consecutive days |
Table 1: Safety assessment (Acute study).
|
Group Number |
Group |
Treatment |
|
I |
Normal (Control) |
Water p.o (1 mL/kg b.wt) |
|
II |
Pb (Ac)2 |
50 mg/kg Pb (Ac)2 i.p on day 2,3,4 and 6 |
|
III |
Sily + Pb (Ac)2 |
100 mg/kg Silymarin (per day, p.o) for 8 consecutive days and 50 mg/kg Pb (Ac)2 i.p on day 2,3,4 and 6 |
|
IV |
100 mg AQ +Pb (Ac)2 |
100 mg/kg AQ (per day, p.o) for 8 consecutive days and 50 mg/kg Pb (Ac)2 i.p on day 2,3,4 and 6 |
|
V |
250 mg AQ +Pb (Ac)2 |
250 mg/kg AQ (per day, p.o) for 8 consecutive days and 50 mg/kg Pb (Ac)2 i.p on day 2,3,4 and 6 |
|
VI |
500 mg AQ +Pb (Ac)2 |
500 mg/kg AQ (per day, p.o) for 8 consecutive days and 50 mg/kg Pb (Ac)2 i.p on day 2,3,4 and 6 |
|
VII |
100 mg HE +Pb (Ac)2 |
100 mg/kg HE (per day, p.o) for 8 consecutive days and 50 mg/kg Pb (Ac)2 i.p on day 2,3,4 and 6 |
|
VIII |
250 mg HE +Pb (Ac)2 |
250 mg/kg HE (per day, p.o.) for 8 consecutive days and 50 mg/kg Pb (Ac)2 i.p on day 2,3,4 and 6 |
|
IX |
500 mg HE +Pb (Ac)2 |
500 mg/kg HE (per day, p.o.) for 8 consecutive days and 50 mg/kg Pb (Ac)2 i.p on day 2,3,4 and 6 |
Table 2: Pb (Ac)2 model.
|
Group Number |
Group |
Treatment |
|
I |
Normal (Control) |
Water p.o (1 mL/kg b.wt) |
|
II |
Para |
500 mg/kg para from day 2 to day 8 |
|
III |
Sily + para |
100 mg/kg Silymarin (per day, p.o) for 8 consecutive days and 500 mg/kg para from day 2 to day 8 |
|
IV |
100 mg AQ +para |
100 mg/kg AQ (per day, p.o.) for 8 consecutive days and 500 mg/kg Para p.o. from day 2 to day 8. |
|
V |
250 mg AQ +para |
250 mg/kg AQ (per day, p.o.) for 8 consecutive days and 500 mg/kg Para p.o. from day 2 to day 8. |
|
VI |
500 mg AQ +para |
500 mg/kg AQ (per day, p.o.) for 8 consecutive days and 500 mg/kg Para p.o. from day 2 to day 8. |
|
VII |
100 mg HE+para |
100 mg/kg HE (per day, p.o.) for 8 consecutive days and 500 mg/kg Para p.o. from day 2 to day 8. |
|
VIII |
250 mg HE+para |
250 mg/kg HE (per day, p.o.) for 8 consecutive days and 500 mg/kg Para p.o. from day 2 to day 8. |
|
IX |
500 mg HE+para |
500 mg/kg HE (per day, p.o.) for 8 consecutive days and 500 mg/kg Para p.o. from day 2 to day 8. |
Table 3: Para (Acetaminophen) model.
- Blood Collection and Assessment of Hepatoprotective Activity
At the end of the study, all the animals were sacrificed after an overnight fast on the 8th day by cervical dislocation. Blood samples were collected into gel activated and EDTA tubes by creating an incision in the cervical region with the aid of a sterile blade for biochemical and haematological analyses. Biochemical parameters such as Alanine Transaminase (ALT), Alanine Phosphatase (ALP), Aspartate Transaminase (AST), Total Protein (TP), Albumin (ALB), Globulin |(GLO), Total Cholesterol (TC), Indirect Bilirubin (IBIL), Direct bilirubin (DBIL) were measured using the Selectra E (Vital Scientific, Japan) autoanalyzer. Haematological parameters such as White Blood Count (WBC), Haemoglobin (HGB), Haematocrit (HCT), Mean Corpuscular Volume (MCV), Mean Corpuscular Haemoglobin (MCH), Mean Corpuscular Haemoglobin Concentration (MCHC), Platelets (PLT), Lymphocyte (LYM), MXD, Neutrophil (NEUT), Red Cell Distribution Width (RDW-SD and RDW-CV), Platelet Distribution Width (PDW) and Mean Platelet Volume (MPV) were analyzed using a haematology analyzer.
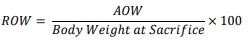
- Determination of Relative Organ Weight (ROW)
Excised liver of rats was washed in buffered normal saline and weighed to obtain the absolute liver weights (ALW). The relative organ weights (RLW) were calculated using the formula:
- Histology
Pieces of liver tissues were submerged in 10% buffered formaldehyde solution to ensure that they were well for proper 24 h fixation. Afterward, the samples were washed using double distilled water and dehydrated with dilutions of methanol and ethanol. Specimens were purified in xylene and then embedded in paraffin at 56 0C in an oven for 24 h. Paraffin beeswax 8 blocks were prepared for sectioning with a thickness of 4 µm using a sled microtome. The tissue sections obtained were placed on glass slides, deparaffinized, and counterstained with haematoxylin and eosin for analysis. The stained tissues were examined under a microscope at magnification of X40 (BX-51) and photographed by a chare-couple device (CCD) camera.
- Statistical analysis
Data was analyzed by Graphpad prism 9 for windows and the results were expressed as the mean ± standard error mean (SEM). Data was then assessed by two-way analysis of variance followed by Tukey’s multiple comparison test to determine significant difference between the various groups. Values for which p < 0.05 was considered as statistically significant.
Percentage protection was calculated based on the principal indicators of liver protection; AST, ALT, ALP, GGT and TBIL using the formula:
% Protection = [(a-b)/(a-c)]x100,
Where a is the mean value of biomarkers (AST, ALT, ALP, GGT and TBIL) produced by hepatotoxin only, b is the mean values of biomarkers (AST, ALT, ALP, GGT and TBIL) produced by hepatotoxin plus test substance (extracts) and c is the mean value of biomarkers (AST, ALT, ALP, GGT and TBIL) produced by the normal control.
Results
- Preliminary Phytochemical screening
Preliminary phytochemical screening of the aqueous and HE extracts revealed the presence of major phytochemical groups as shown in table 4.
|
Phytochemicals |
GTCM Raw |
GTCMB Aqueous |
GTCMB Hydroethanolic |
|
Alkaloids |
- |
- |
+ |
|
Flavonoids |
- |
- |
- |
|
Phenols |
- |
|
+ + + |
|
Saponins |
+ |
+ + |
+ + + |
|
Tannins |
- |
+ + + |
+ + + |
|
Terpenoids |
+ |
- |
+ + + |
Table 4: Phytochemical constituents of Raw, aqueous and hydroethanolic extracts of GTCMB.
= Absent, + = Present, ++ = Present in moderate concentration, +++ = Present in high concentration
- Heavy metals analysis
The raw, aqueous and HE extracts were screened for the presence of heavy metals such as Chromium (Cr), Copper (Cu), Iron (Fe), Nickel (Ni) and Lead (Pb) as shown in table 5.
|
|
Cr (mg/l) |
Cu (mg/l) |
Fe (mg/l) |
Ni (mg/l) |
Pb (mg/l) |
|
Raw GTCMB |
BDL |
BDL |
6.92±0.11 |
2.47±0.31 |
BDL |
|
Aqueous GTCMB |
BDL |
BDL |
4.21±0.06 |
4.61±0.08 |
BDL |
|
Hydroethanolic GTCMB |
BDL |
0.23±0.00
|
2.70±0.05 |
4.65±0.15 |
BDL |
Table 5: Heavy metals constituents of the raw, aqueous and hydroethanolic extract of GTCMB.
Values are expressed as mean± SD, BDL means below detection limit Detection Limit - 0.00001mg/l.
- In vitro Antioxidant assay
1,1-diphenyl-2-picrylhydrazyl (DPPH) Scavenging Activity: The DPPH scavenging ability of GTCMB aqueous and hydroethanolic extracts were evaluated to determine the antioxidant activity of both extracts. Figure 1 shows the % inhibition of DPPH by the GTCMB Aqueous and 50% hydroethanolic extracts, comparing it to gallic acid, a standard known to have potent antioxidant activity. Gallic acid had a % inhibition (97.60 ± 0.04 %) while the GTCMB aqueous and 50% hydroethanolic extracts have % inhibition (75.35 ± 0.42 %) and (75.81 ± 0.57 %) respectively.
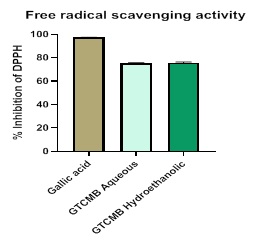 Figure 1: Free radical scavenging activity by GTCMB aqueous and hydroethanolic extracts compared to gallic acid standard. Each bar represents a mean ± standard deviation, n = 2, p < 0.005 between the extracts and gallic acid. Gallic acid has a % inhibition (97.60 ± 0.04 %) while the GTCMB aqueous and hydroethanolic extracts have % inhibition (75.35 ± 0.42 %) and (75.81 ± 0.57 %) respectively.
Estimation of total phenolic Content (TPC) compared to Gallic acid as a standard: The total phenolic content was estimated and compared to gallic acid standard.
A linear plot of Gallic acid standard produced a straight line (y = 10.303x + 0.4944, R2 = 0.9884) as shown in Figure 2. The total phenolic content of the GTCMB aqueous and GTCMB hydroethanolic extracts were extrapolated from the Gallic acid standard curve and was estimated as gallic acid equivalent (GAE); [phenolic] mg GAE/100g.
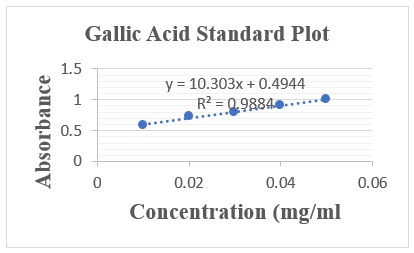 Figure 2: Standard concentration curve of absorbance against concentration of Standard Gallic Acid. In terms of Gallic acid equivalence, the total phenolic in the GTCMB aqueous extract was estimated to be 513.34 ± 0.14 mg GAE/ 100 g while the GTCMB hydroethanolic extract was estimated to be 5740.46 ± 0.62 mg GAE/ 100 g.
Estimation of total flavonoid content compared to quercetin as standard: A linear plot of Quercetin standard produced a straight line (y = 22.612x + 0.006, R2 = 0.996) as shown in figure 3. The total flavonoid content of the combinatory formulation of ginger, turmeric, cinnamon, moringa and black pepper (GTCMB) aqueous and GTCMB hydroethanolic extracts were extrapolated from the Quercetin standard curve and was estimated as quercetin equivalent (QE); [flavonoid] mg QE/ 100 g.
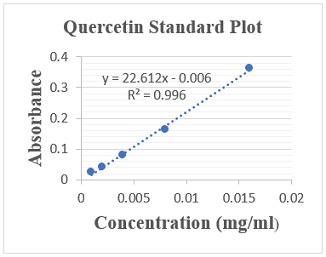 Figure 3: Standard concentration curve of absorbance against concentration of Standard Quercetin. In terms of Quercetin equivalence, the total flavonoid content in the GTCMB aqueous extract was estimated to be 715 ± 0.31 mg QE/ 100 g while the GTCMB hydroethanolic extract was estimated to be 365.31 ± 0.15 mg QE/ 100 g.
- Fourier-Transform Infrared Spectroscopy (FTIR) Analyses
The Fourier Transform Infrared Spectroscopy (FTIR) analysis was done to determine the functional groups of the active components of the aqueous and hydroethanolic extracts of GTCMB based on peak value in the region of infrared radiation. The results of FTIR analysis of both aqueous and hydroethanolic extracts GTCMB are shown in tables 6 and 7 respectively.
|
Peak |
X(cm-1) |
Bond |
Functional Group |
|
1 |
3268.44 |
–C≡C–H: C–H stretch |
Alkynes (terminal) |
|
2 |
2918.30 |
C–H stretch |
Alkanes |
|
3 |
2209.92 |
–C≡C– stretch |
Alkynes |
|
4 |
2151.62 |
C≡C– stretch |
Alkynes |
|
5 |
2099.34 |
Unknown |
Unknown |
|
6 |
1981.16 |
Unknown |
Unknown |
|
7 |
1942.96 |
Unknown |
Unknown |
|
8 |
1884.33 |
Unknown |
Unknown |
|
9 |
1594.04 |
C–C stretch (in–ring) |
Aromatics |
|
10 |
1365.43 |
C–H rock |
Alkanes |
|
11 |
1319.68 |
C–O stretch |
Alcohols, carboxylic acids, esters, ethers |
|
12 |
1263.40 |
C–H wag (–CH2X) |
Alkyl halides |
|
13 |
1148.92 |
C–N stretch |
Aliphatic amines |
|
14 |
1076.45 |
C–N stretch |
Aliphatic amines |
|
15 |
1019.67 |
Unknown |
Unknown |
|
16 |
857.00 |
C–H “oop” |
Aromatics |
|
17 |
759.60 |
C–Cl stretch |
Alkyl halides |
|
18 |
569.86 |
C–Br stretch |
Alkyl halides |
|
19 |
516.37 |
C–Br stretch |
Alkyl halides |
|
20 |
442.55 |
Unknown |
Unknown |
|
21 |
416.07 |
Unknown |
Unknown |
Table 6: FTIR Peak Values of Aqueous GTCMB extract.
|
Peak |
X(cm-1) |
Bond |
Functional Group |
|
1 |
3262.55 |
O–H stretch, H– bonded |
Carboxylic acids |
|
2 |
2933.41 |
C–H stretch |
Alkanes |
|
3 |
2135.65 |
–C≡C– stretch |
Alkynes |
|
4 |
1579.32 |
Unknown |
Unknown |
|
5 |
1389.96 |
Unknown |
Unknown |
|
6 |
1266.18 |
C–H wag (–CH2X) |
Alkyl halides |
|
7 |
1044.90 |
C–N stretch |
Aliphatic amines |
|
8 |
921.98 |
O–H bend |
carboxylic acids |
|
9 |
508.39 |
Unknown |
Unknown |
Table 7: FTIR Peak Values of Hydroethanolic GTCMB extract.
- Effect of Treatment on Relative Organ Weight (ROW)
Treatment with only aqueous and HE did not have any effect on ROW when compared to the normal control as shown in figure 4. Intoxication with Pb (Ac)2 and para caused an increase in ROW. However, ROW was decreased by co-treatment with the aqueous and HE extracts of GTCMB. The Pb (Ac)2 co-treated groups at 100, 250, 500 mg/kg b.wt of the aqueous and HE GTCMB extracts reduced the ROW when compared to the Pb (Ac)2 only. The para co-treated groups at most doses of the aqueous and HE GTCMB extracts caused a reduction in the ROW when compared to the Para only group as shown in figure 4.
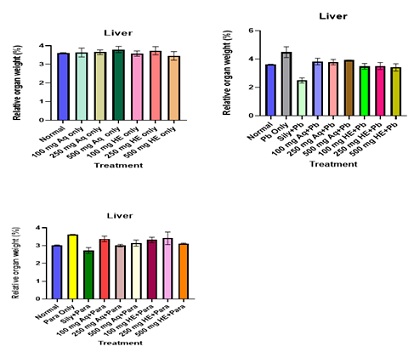 Figure 4: Effect of Extracts Treatment on Relative Organ Weight. Values are expressed mean ± SEM (n=3). No significant differences were observed.
- Effect of Treatment on Haematological indices
The effect of the aqueous and HE extracts of GTCMB on haematological indices in the safety study is shown in table 8. There is no significance difference between the WBC, HGB, MCV, MCH, MCHC of Normal and extract only groups. There is significance difference between the PLT, LYM% of Normal and extracts only group. Effect of treatment on haematological indices of Pb (Ac)2 and Para co-treated groups are shown in tables 9 and 10 respectively. Following Pb (Ac)2 administration, significant differences (p ? 0.05) were observed in the WBC, RBC and HGB). Co-treatment with both aqueous and hydroethanolic extracts caused a reversion in these parameters as shown in table 9. Following Para administration, significant changes (p < 0.05) were observed in haematological indices such as WBC and LYM% when compared to normal. Treatment with extracts (250 mg/kg aq GTCMB) significantly (p < 0.05) decreased the WBC levels. Treatment with 500 mg/kg b.wt HE extract significantly (p < 0.05) decreased LYM% as shown in table 10.
|
Parameter |
Normal |
100 mg Aq only |
250 mg Aq only |
500 mg Aq only |
100 mg HE only |
250 mg HE only |
500 mg HE only |
|
WBC*10^3/µL |
6.70±0.36 |
11.60±0.40 |
9.27±0.28 |
12.23±0.55 |
9.83±0.44 |
10.83±0.32 |
10.47±0.78 |
|
HGB g/dl |
11.63±0.15 |
11.20±0.40 |
12.97±0.44 |
12.60±0.40 |
12.30±0.40 |
13.17±0.19 |
13.17±0.60 |
|
HCT% |
48.50±2.12 |
45.37±1.22 |
49.83±0.46 |
50.67±1.44 |
49.37±0.77 |
50.23±0.93 |
51.17±3.26 |
|
MCV fL |
80.73±3.60 |
74.60±1.57 |
71.30±1.40 |
73.80±1.61 |
71.37±0.76 |
70.53±0.37 |
66.97±0.29 |
|
MCH pg |
19.37±0.20 |
18.40±0.46 |
18.53±0.39 |
18.37±0.23 |
17.43±0.59 |
18.47±0.12 |
17.30±0.32 |
|
MCHC g/dL |
24.07±0.99 |
24.67±0.47 |
26.03±0.98 |
24.87±0.81 |
24.90±0.42 |
26.20±0.15 |
25.77±0.52 |
|
PLT*10^3/µL |
1019.33±10.33 |
1028.00±8.96 |
788.67±49.33a |
733.67±30.33a |
749.67±58.34a |
909.00±56.45 |
816.00±45.71 |
|
LYM% |
70.73±0.38 |
63.33±1.65 |
53.90±0.98a |
56.07±7.08 |
58.87±5.48 |
52.53±5.49a |
51.93±1.56a |
|
MXD% |
8.87±0.45 |
7.70±0.26 |
8.03±0.39 |
10.17±1.44 |
6.40±0.60 |
7.30±0.55 |
6.57±0.24 |
|
NEUT% |
23.27±2.92 |
41.87±9.41 |
34.40±3.44 |
47.93±1.48 |
35.70±4.43 |
36.83±2.02 |
40.53±0.82 |
|
LYM*10^3/µL |
4.70±0.25 |
4.57±0.09 |
5.33±0.43 |
7.17±1.01 |
6.40±0.17 |
6.00±0.85 |
5.47±0.58 |
|
MXD*10^3/µL |
0.67±0.07 |
0.80±0.06a |
0.73±0.03 |
1.33±0.20 |
0.67±0.12 |
0.80±0.06a |
0.77±0.07a |
|
NEUT*10^3/µL |
1.43±0.15 |
3.33±0.15a |
3.20±0.25 |
4.40±0.72a |
2.93±0.09 |
4.53±0.43a |
4.40±0.12a |
|
RDW-SD fL |
76.07±2.58 |
53.73±1.76 |
48.77±1.19a |
52.50±3.79a |
54.77±0.84 |
50.70±0.60a |
47.47±1.76a |
|
RDW-CV % |
29.13±0.77 |
23.43±0.15 |
22.77±0.64a |
21.87±0.12a |
21.97±1.13a |
20.20±0.12a |
20.23±0.77a |
|
PDW fL |
9.83±0.18 |
10.20±0.25 |
9.67±0.09 |
10.17±0.38 |
9.00±0.35 |
9.47±0.20 |
9.60±0.15 |
|
MPV fL |
7.97±0.07 |
8.17±0.09 |
7.80±0.06 |
8.33±0.07 |
7.53±0.27 |
7.73±0.07 |
7.53±0.15 |
|
P-LCR % |
12.27±0.55 |
14.43±0.18 |
11.67±0.23 |
14.57±0.37 |
11.27±0.52a |
11.27±0.12a |
11.80±0.82 |
|
PCT % |
0.79±0.02 |
0.80±0.04 |
0.59±0.01a |
0.60±0.01 |
0.57±0.03a |
0.73±0.01 |
0.63±0.04 |
Table 8: Effect of treatment on the haematological parameters in the acute safety study.
Values are expressed as mean±SEM (n=3). Statistical significance “a” at p < 0.05 compared to Normal.
|
Parameter |
Normal |
Pb only |
Sily+Pb |
100mg Aq+Pb |
250mg Aq+Pb |
500 mg Aq+Pb |
100mg HE+Pb |
250 mg HE+Pb |
500 mg HE+Pb |
|
WBC* 10^3/µL |
6.70±0.36 |
15.80±0.06a |
7.93 ± 0.48b |
15.60±1.08a |
15.37±3.58a |
15.50±0.89a |
12.13±0.79b |
15.67 ±2.74a |
11.63±0.03b |
|
RBC *10^6/µL |
6.01±0.02 |
4.82±0.18a |
7.23 ± 0.36b |
6.82±0.10ab |
5.83±0.02 |
6.72±0.16b |
6.61±0.43b |
6.41±0.74b |
6.83±0.09b |
|
HGB g/dL |
11.63±0.15 |
5.20±0.47 |
10.93 ± 0.64b |
8.60±0.47b |
9.07±0.0b |
11.63±0.22b |
11.13±0.96b |
10.67±1.23b |
11.37±0.38b |
|
HCT % |
48.50±2.12 |
43.40±1.25 |
50.13 ± 2.09 |
43.07±5.51 |
37.10±2.63 |
46.90±2.03 |
47.23±4.10 |
43.80±3.40 |
45.47±1.53 |
|
MCV fL |
80.73±3.60 |
63.63±0.56 |
65.26 ± 0.84 |
73.63±3.24 |
68.90±1.22 |
72.37±2.53 |
71.27±2.08 |
69.07±3.17 |
66.70±1.96 |
|
MCH pg |
19.37±0.20 |
16.70±0.55a |
18.13 ± 0.08 |
17.47±0.23a |
15.47±0.19a |
17.47±0.15a |
17.13±0.17a |
16.57±0.20a |
16.27±0.12a |
|
MCHC g/dL |
24.07±0.99 |
27.23±0.46 |
23±0.50 |
22.83±1.05 |
22.47±0.6ab |
24.67±0.69 |
23.57±0.03 |
24.20±1.17 |
25.00±0.25 |
|
PLT* 10^3/µL |
1012.33 ±111.93 |
1019.00 ±10.33 |
934.67 ± 149.94a |
967 ±131.04 |
876.67 ±6.69ab |
880.00 ±195.62ab |
958.67±144.01ab |
865±175.b |
984.0±14.9b |
|
LYM% |
70.73±0.38 |
42.27±4.65 |
58.13 ± 2.88 |
41.87±11.93 |
20.73±2.47a |
40.37±2.84 |
47.60±5.56 |
42.03±10.58 |
47.40±5.41 |
|
MXD% |
8.87±0.45 |
6.47±0.20 |
1.30+0.2 |
12.30±3.76 |
12.6±0.36ab |
12.97±1.55 |
9.63±3.22 |
6.50±0.72 |
8.27±1.18 |
|
NEUT% |
23.27±2.92 |
47.20±1.13a |
41.80 ± 2.85 |
50.30±12.96 |
56.07±9.43 |
46.97±1.53 |
51.43±16.33 |
37.03±3.76 |
44.33±6.53 |
|
LYM* 10^3/µL |
6.60±0.74 |
4.70±0.25 |
6.20±0.70 |
9.47±2.09 |
5.33±0.92 |
6.70±0.12 |
6.47±0.15 |
15.33±0.98b |
7.47±0.39 |
|
MXD* 10^3/µL |
0.67±0.07 |
1.13±0.09 |
0.07±0.01 |
0.55±0.03 |
2.77±0.92 |
1.90±0.29 |
1.50±0.17 |
1.10±0.12 |
1.20±0.00 |
|
NEUT* 10^3/µL |
1.43±0.15 |
8.53±0.69 |
1.87±0.13 |
11.30±2.84 |
10.77±0.20a |
7.40±0.56 |
4.53±0.96 |
5.40±1.15 |
6.53±0.69 |
|
RDW-SD fL |
76.07±2.58 |
43.00±1.43 |
38.90 ± 1.15a |
61.80±4.00 |
65.67±1.48 |
55.47±1.47 |
55.03±1.59b |
54.30±4.33b |
51.47±1.69b |
|
RDW-CV % |
29.13±0.77 |
18.60±0.65a |
14.63 ± 0.94 |
28.27±3.61 |
23.60±4.21 |
23.03±1.01 |
22.70±0.06 |
23.33±1.93 |
20.77±1.09 |
|
PDW fL |
9.83±0.18 |
9.57±0.41 |
8.60 ± 0.40 |
9.40±0.20 |
9.80±0.64 |
9.10±0.21 |
9.83±0.50 |
9.33±0.64 |
10.17±0.67 |
|
MPV fL |
7.97±0.07 |
7.63±0.41 |
7.30 ± 0.35 |
8.03±0.07 |
7.80±0.55 |
7.70±0.17 |
8.23±0.07 |
7.97±0.33 |
7.93±0.09 |
|
P-LCR % |
12.27±0.55 |
11.20±1.10 |
7.90±2.10 |
11.80±0.40 |
13.64±1.76 |
10.57±1.60 |
12.70±1.27 |
12.80±1.40 |
10.50±0.44 |
|
PCT % |
0.79±0.02 |
0.78±0.10 |
0.69±0.14 |
1.15±0.09 |
0.91±0.15 |
1.02±0.18 |
0.93±0.25 |
1.09±0.19 |
1.25±0.03 |
Table 9: Effects of treatment on the haematological parameters of Pb (Ac)2 treated groups.
Values are expressed as mean± SEM (n=3). Statistical significance “a” at p < 0.05 compared to normal; “b” at p < 0.05 when compared to Pb-treated group only.
|
Parameter |
Normal |
Para only |
Sily +Para |
100 mg Aq + Para |
250 mg Aq +Para |
500 mg Aq+Para |
100 mg HE +Para |
250 mg HE+ Para |
500 mg HE +Para |
|
WBC* 10x3/µL |
6.70±0.36 |
13.10±1.44a |
9.77±0.66ac |
12.23±0.28ac |
10.73±0.91ac |
13.00±0.75a |
8.40±0.56c |
10.83±0.68ac |
9.43±015ac |
|
RBC* 10^6/µL |
7.86±0.2 |
6.01±0.027 |
8.32±0.50ac |
6.62±0.64 |
6.94±0.06 |
6.49±0.13 |
7.19±0.42 |
6.95±0.13a |
7.66±0.08c |
|
HGB g/dL |
13.63±0.23 |
11.63±0.15 |
14.47±0.15c |
12.70±0.31 |
14.00±0.06c |
13.73±0.49c |
13.30±0.23c |
14.13±0.20c |
14.17±0.03c |
|
HCT % |
48.50±2.12 |
50.87±0.03 |
54.57±0.58 |
53.93±1.49 |
54.33±2.13 |
52.47±4.03 |
53.13±2.15 |
54.23±1.24 |
51.17±0.82 |
|
MCV fL |
80.73±3.60 |
63.47±0.87 |
60.60±0.49 |
75.70±0.46 |
81.53±0.07c |
71.13±0.61 |
65.37±1.32 |
69.23±1.05 |
66.50±1.74 |
|
MCH pg |
19.37±0.20 |
17.33±0.35 |
16.50±0.60 |
18.60±0.21 |
19.97±0.07c |
19.43±0.34c |
16.40±0.15 |
19.43±0.71c |
17.47±0.81 |
|
MCHC g/dL |
24.07±0.99 |
27.33±0.22 |
26.60±0.26 |
24.00±0.51 |
25.83±0.98 |
25.67±1.28 |
25.00±0.51 |
26.40±0.75 |
27.60±0.36 |
|
PLT *10^3/µL |
1197.33 ±10.33 |
1119.00 ±102.79a |
838.67 ±6.24c |
815.67 ±8.69a |
745.00 ±8.72c |
1897.00 ±44.43c |
642.33 ±37.88a |
767.67 ±42.45a |
891.00 ±5.69a |
|
LYM% |
70.73±0.38 |
53.83±1.13 |
49.57±2.67 |
52.00±0.31 |
55.47±1.21 |
47.17±0.43a |
49.33±1.65 |
53.87±3.41 |
47.20±1.12a |
|
MXD% |
8.87±0.45 |
6.70±0.15 |
7.47±0.67 |
8.30±0.49 |
6.77±0.09 |
15.30±1.91 |
6.20±0.31 |
7.40±0.25 |
6.37±0.35 |
|
NEUT% |
23.27±2.92 |
40.37±0.38 |
45.03±2.58a |
39.70±0.25 |
37.40±0.47 |
83.00±2.5ac |
44.00±1.81 |
40.70±1.51 |
37.73±0.15 |
|
LYM *10^3/µL |
6.67±0.25 |
4.70±0.39 |
5.30±0.21a |
6.33±0.15a |
5.73±0.33 |
5.67±0.15a |
4.10±0.23 |
6.03±0.18 |
5.33±0.13c |
|
MXD *10^3/µL |
0.67±0.07 |
0.90±0.06 |
0.77±0.09 |
1.00±0.10 |
1.00±0.06 |
0.43±0.24c |
0.60±0.06 |
0.63±0.03 |
0.57±0.03 |
|
NEUT *10^3/µL |
1.43±0.15 |
5.53±0.45 |
3.60±0.40 |
4.63±0.27 |
4.33±0.64 |
2.03±1.17 |
3.50±0.21 |
3.57±0.12 |
3.60±0.06 |
|
RDW-SD fL |
76.07±2.58 |
39.43±0.38a |
41.33±0.78a |
65.73±1.50c |
78.10±2.62c |
54.57±2.45 |
46.37±2.03c |
55.50±1.73a |
41.80±0.21c |
|
RDW-CV % |
29.13±0.77 |
19.73±0.52a |
20.37±0.93a |
26.60±0.29 |
27.10±1.71 |
25.40±2.19 |
23.10±1.65 |
23.47±0.15 |
20.13±0.61a |
|
PDW fL |
9.83±0.18 |
9.37±0.19 |
9.20±0.38 |
9.33±0.55 |
9.67±0.49 |
9.67±0.26 |
9.10±0.70 |
8.60±0.29 |
8.67±0.03 |
|
MPV fL |
7.97±0.07 |
7.73±0.12 |
7.63±0.18 |
7.67±0.22 |
7.80±0.32 |
8.07±0.32 |
7.63±0.50 |
7.40±0.32 |
7.20±0.12 |
|
P-LCR % |
12.27±0.55 |
9.67±0.70 |
10.20±0.61 |
9.63±0.35 |
10.50±1.06 |
12.27±1.62 |
12.43±2.65 |
8.90±1.96 |
7.43±0.20 |
|
PCT % |
0.79±0.02 |
0.65±0.02 |
0.87±0.11 |
0.62±0.01 |
0.69±0.06 |
0.78±0.14 |
0.58±0.06 |
0.64±0.07 |
0.64±0.00 |
Table 10: Effect of treatments on haematological parameters of Para treated groups.
Values are expressed as mean±SEM (n=3). Statistical significance “a” at p < 0.05 compared to Normal; “c” at p < 0.05 when compared to Para-treated group only.
- Effect of Treatment on some Biochemical Indices
Table 11 & figure 5 shows the effect of treatment on some Biochemical Indices in the safety study. Table 12 shows the effect of treatment on Pb (Ac)2 co-treated groups. Treatment with Pb (Ac)2 resulted in a significant increase in biochemical indices such as AST, ALP, ALT, GGT, ALP. Co-treatment with the aqueous and HE GTCMB extracts at most doses caused a significant reduction of these parameters as shown in table 10 and figure 6. Table 13 shows the effect of treatment on Para treated groups. Treatment with Para caused a significant elevation in parameters such as AST, ALP, TP, ALT and GGT as shown in table 13 and figure 7.
|
Parameter |
Normal |
100 mg Aq |
250 mg Aq |
500 mg Aq |
100 mg HE |
250 mg HE |
500 mg HE |
|
DBIL µmol/L |
2.26±0.56 |
1.83±0.30 |
2.59±0.26 |
2.26±0.16 |
1.48±0.25 |
1.86±0.18 |
1.28±0.07 |
|
AST U/L |
75.93±0.91 |
125.90±0.92a |
105.67±5.93a |
104.00±6.34a |
53.90±1.48 |
66.13±6.61 |
134.27±3.07a |
|
ALP U/L |
140.67±3.86 |
94.93±1.37 |
114.73±8.26 |
141.67±8.40 |
145.80±6.32 |
96.10±1.94 |
144.20±12.10 |
|
TP g/L |
52.93±6.33 |
45.90±4.33 |
43.47±6.27 |
42.77±4.59 |
55.37±6.10 |
55.40±2.71 |
39.87±4.25 |
|
ALB g/L |
26.87±0.58 |
22.07±0.09 |
20.53±2.33 |
21.00±1.05 |
24.93±2.11 |
24.43±2.11 |
26.27±3.17 |
|
TC mmol/L |
3.00±0.42 |
2.33±0.33 |
2.56±0.30 |
3.43±0.84 |
3.08±0.47 |
1.97±0.08 |
1.68±0.36 |
|
GLO g/L |
26.07±5.86 |
23.83±4.25 |
22.93±4.07 |
21.77±3.64 |
30.43±3.99 |
30.97±0.62 |
13.60±1.08 |
|
IBIL mmol/L |
7.56±0.19 |
1.74±0.03a |
5.30±0.40 |
2.02±0.29 |
8.54±0.44 |
1.65±0.29a |
1.39±0.17a |
Table 11: Effects of treatment on the Biochemical Parameters in the acute safety study.
Values are expressed as mean±SEM (n=3). Statistical significance “a” at p < 0.05 compared to Normal.
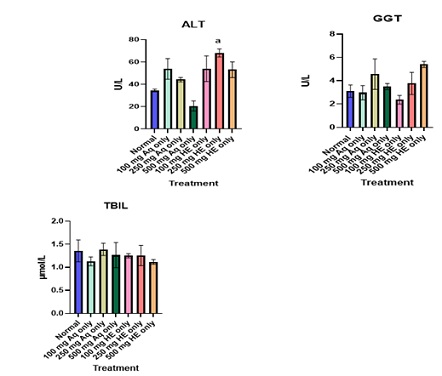
Figure 5: Effect of Extract Treatment on key liver biochemical parameters in the acute safety study. Values are expressed as mean ± SEM (n=3). Statistical significance “a” at p < 0.05 compared to Normal.
|
Parameter |
Normal |
Pb Only |
Sily+Pb |
100 mg Aq+ Pb |
250 mg Aq+ Pb |
500 mg Aq +Pb |
100 mg HE +Pb |
250 mg HE +Pb |
500 mg HE +Pb |
|
DBIL µmol/L |
1.36±0.14 |
2.26±0.56 |
4.05±0.31 |
1.40±0.16 |
1.17±0.08 |
1.37±0.03 |
1.55±0.03 |
1.40±0.14 |
1.31±0.07 |
|
AST U/L |
75.93±0.91 |
341.47 ±7.54a |
100.20 ±3.84b |
223.97 ±13.99ab |
243.17 ±9.70a |
103.43 ±1.37b |
209.00 ±1.48 |
231.90 ±6.29a |
179.57 ±9.75b |
|
ALP U/L |
140.67 ±22.86 |
333.27 ±22.98a |
107.37 ±3.43ab |
175.93 ±40.9ab |
178.70 ±34.92ab |
171.87 ±1.54ab |
191.87 ±18.59ab |
225.43 ±4.64ab |
170.57 ±16.55ab |
|
TP g/L |
52.93±6.33 |
48.63±1.20 |
70.67±2.96 |
55.60±3.89 |
52.80±1.46 |
26.53±1.30b |
49.33±3.76 |
53.50±3.41 |
53.00±2.62 |
|
ALB g/L |
26.87±0.58 |
22.20±0.89 |
59.33±5.21 |
22.70±1.46 |
24.77±1.41 |
13.70±0.55 |
21.57±1.89 |
24.30±0.99 |
22.27±0.55 |
|
TC mmol/L |
1.47±0.06 |
3.00±0.42 |
5.23±0.30 |
1.76±0.06 |
1.66±0.29 |
0.94±0.00 |
1.55±0.22 |
1.61±0.17 |
1.37±0.08 |
|
GLO g/L |
26.07±5.86 |
26.43±0.32 |
11.33±2.33 |
32.90±4.44 |
28.03±0.47 |
12.83±0.93 |
27.77±3.19 |
29.20±3.13 |
30.73±2.97 |
|
IBIL mmol/L |
1.49±0.10 |
7.56±0.19 |
4.33±0.18 |
1.38±0.45 |
1.13±0.09 |
1.25±0.28 |
0.62±0.19 |
1.55±0.33 |
1.44±0.15 |
|
LDH U/L |
37.37 |
566.97 ±12.15a |
188.67 ±8.76b |
417.43 ±20.41 |
268.17 ±16.72 ab |
228.00 ±4.31 ab |
364.67 ±28.29b |
474.17 ±4.63 |
367.60 ±26.77b |
Table 12: Effect of treatment on the Biochemical Parameters of Pb co-treated groups.
Values are expressed as mean ± SEM (n=3). Statistical significance “a” at p < 0.05 compared to Normal; “b” at p < 0.05 when compared to Pb-treated group only.
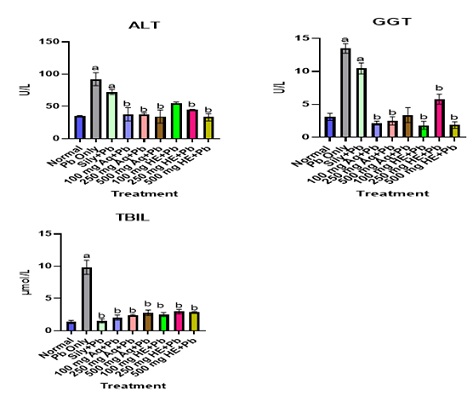 Figure 6: Effect of Extracts Treatment on key liver biochemical parameters. Values are expressed as mean±SEM (n=3). Statistical significance at “a” at p < 0.05 compared to Normal; “b” at p < 0.05 when compared to Pb-treated groups only.
|
Parameter |
Normal |
Para Only |
Sily+ Para |
100 mg Aq + Para |
250 mg Aq + Para |
500 mg Aq+Para |
100 mg HE+Para |
250 mg HE+Para |
500 mg HE+Para |
|
DBIL µmol/L |
2.26±0.56 |
1.70±0.18 |
1.65±0.01 |
1.45±0.24 |
1.27±0.07 |
1.13±0.04 |
1.45±0.07 |
1.44±0.01 |
1.58±0.16 |
|
AST U/L |
75.93 ±0.91 |
367.67 ±10.48a |
267.67 ±14.43ac |
258.17 ±26.51ac |
219.50 ±11.52ac |
251.47 ±10.76ac |
216.67 ±3.15ac |
137.67 ±18.08ac |
62.87±8.95c |
|
ALP U/L |
140.67 ±3.86 |
1472.27± 394.19a |
1168.83 ±71.25 ac |
1433.4 3±212.80a |
1469.70 ±191.77a |
761.33 ±90.54 ac |
1396.97 ±64.56a |
256.17 ±14.54c |
134.77±1.83c |
|
TP g/L |
52.93±6.33 |
71.97±3.86a |
65.53±1.32 |
60.57±2.31 |
57.03±4.89 |
68.33±1.93 |
65.93±1.82 |
41.87±4.75 |
21.47±4.31c |
|
ALB g/L |
26.87±0.58 |
25.67±0.44 |
25.37±1.73 |
30.60±1.08 |
33.30±1.47 |
28.37±3.11 |
26.40±1.76 |
22.30±3.26 |
10.07±1.66 |
|
TC mmol/L |
3.00±0.42 |
1.59±0.26 |
1.61±0.06 |
2.32±0.14 |
2.33±0.11 |
2.03±0.08 |
2.14±0.17 |
1.94±0.14 |
0.85±0.18c |
|
GLO g/L) |
26.07±5.86 |
32.30±3.42 |
40.17±2.26 |
29.97±1.31 |
37.53±3.67 |
39.97±5.04 |
39.53±3.44 |
19.57±2.01 |
11.40±2.76ac |
|
IBIL mmol/L |
7.56±0.19 |
1.37±0.25 |
1.33±0.19 |
1.61±0.22 |
0.58±0.12 |
1.31±0.12 |
0.90±0.10 |
1.29±0.56 |
1.49±0.41 |
Table 13: Effect of treatment on the Biochemical Parameters of Para co-treated groups.
Values are expressed as mean ± SEM (n=3). Statistical significance “a” at p < 0.05 compared to Normal; “c” at p < 0.05 when compared to Para-treated group only.
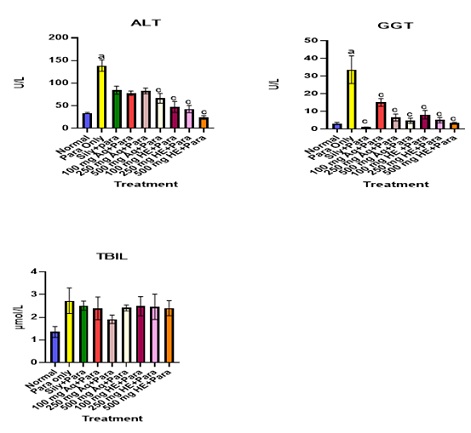 Figure 7: Effect of Extract Treatment on key liver biochemical parameters. Values are expressed as mean ± SEM (n=3). Statistical significance “a” at p < 0.05 compared to Normal; “c” when compared to Para-treated group Only.
- Effect of Treatment on some Inflammatory Indices (NLR and PLR)
Figure 8 shows the effect of treatment of both aqueous and HE GTCMB extracts on NLR and PLR. There are no significance differences between the NLR and PLR of the normal and all the doses of both aqueous and hydroethanolic extracts only groups. Treatment with Pb (Ac)2 caused an elevation in NLR. However, co-treatment with all doses of both aqueous and HE GTCMB reversed the levels of NLR to near normal. The 250 mg/kg also caused a significant decrease in PLR levels as shown in figure 8. Treatment with Para resulted in an elevation in the level of NLR, which were reversed to near normal by co-treatment with all doses of the aqueous and HE extracts. Para treatment and co-treatment with the extracts did not cause any significant effect on PLR as shown in figure 8.
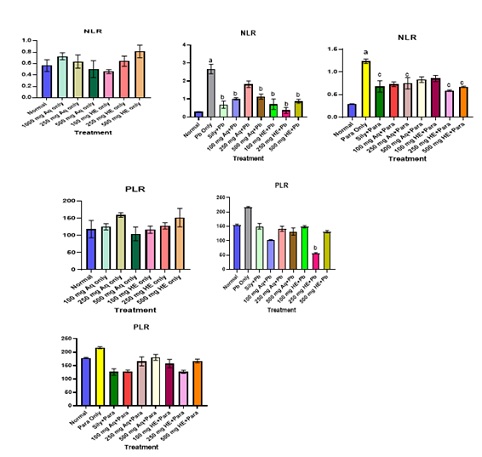 Figure 8: Effect of treatment on some inflammatory indices (NLR and PLR). Values are expressed as mean ± SEM (n=3). Statistical significance “a” at p < 0.05 compared to Normal; “b” at p < 0.05 when compared to Pb-treated groups only, “c” at p < 0.05 compared to para-treated groups only.
- Percentage hepatoprotection
Percentage hepatoprotection was assessed based on principal indicators of liver protection (ALT, AST, GGT, ALP and TBLIL). Figure 9 show the percentage hepatoprotection of Silymarin, Aqueous and Hydroethanolic of GTCMB extracts at all doses against Pb and Para intoxication. GTCMB HE at 500 mg/kg b.wt offered the best hepatoprotection against lead and acetaminophen-induced hepatotoxicity.
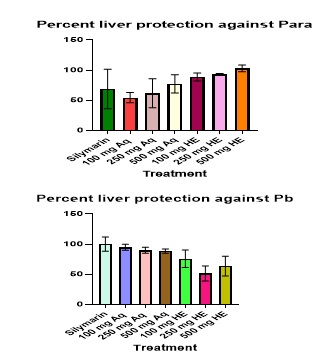 Figure 9: Percentage protection by GTCMB Aq, HE and Silymarin against lead (II) acetate and Para induced liver toxicity.
- Effect of Treatment on liver histology
Figure 10 (A-G) show the micrographs of liver sections of the normal and extract only groups. Figure 10 (H-O) show the micrographs of liver sections of the Pb treated groups. Figure 10 (P-W) show the micrographs of the liver sections of para treated groups. There was massive centrilobular hepatocellular atrophy, necrosis with sinusoidal dilation in the liver sections of the animals treated with Pb only. There was severe portal inflammation and necrosis of limiting plate hepatocytes in the liver sections of rats treated with paracetamol only. There was massive centrilobular hepatocellular atrophy, necrosis with sinusoidal dilation in the silymarin +Pb group and moderate portal inflammation and necrosis of limiting plate hepatocytes in the silymarin + Para group. There was moderate atrophy of hepatic cords, moderate centrilobular necrosis with sinusoidal dilation with mild perivascular inflammation in the hepatocytes of rats treated with extracts and normal hepatocyte with no observable lesions in certain cases.
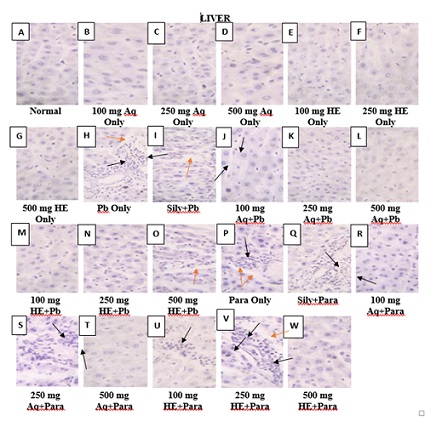 Figure 10: Photomicrograph (A) – (G) shows normal hepatocytes with no observable lesion; (H) and (I) shows massive centrilobular hepatocellular atrophy, necrosis (black arrows) with sinusoidal dilation (red arrows); (J) – (N) shows normal hepatocytes with no observable lesion; (O) shows Kupffer cell hyperplasia with sinusoidal dilation (red arrow); (P) shows severe portal inflammation (red arrow) and necrosis of limiting plate hepatocytes (black arrows); (Q) shows moderate portal inflammation and necrosis of limiting plate hepatocytes (black arrows); (R) there is no observable lesion; (S) shows mild perivascular inflammation (black arrows); (T) shows no observable lesion; (U) shows moderate atrophy of hepatic cords with moderate necrosis (black arrows); (V) shows moderate centrilobular necrosis (black arrows) with sinusoidal dilation (red arrows); (W) there is no observable lesion. (H&E x 400).
Discussion
Natural bioactive compounds from plants play vital roles in enhancing human health by performing specific biological functions [16]. The intake of these compounds, found abundantly in plants, has become a common practice to mitigate the risk of well-known non-communicable diseases in various age groups. Phytochemicals present in plants exhibit robust antioxidant activity against reactive oxygen species, thus contribute to various health benefits [17]. Notably, phenols, flavonoids, terpenoids, alkaloids, tannins and saponins are well-studied phytochemicals which possess potent antioxidant properties. Phytochemical screening of the raw, aqueous and hydroethanolic extracts confirmed their presence.
This study also quantified five heavy metals (Chromium, Copper, Iron, Nickel and Lead) in this formulation. Iron concentration was highest in the raw mixture (6.92±0.11 mg/l), followed by the aqueous extract (4.21±0.06 mg/l) and lowest in the hydroethanolic extract (2.70±0.05 mg/l). Nickel was highest in the hydroethanolic extract (4.65±0.15 mg/l) and lowest in the raw mixture (2.47±0.31 mg/l). All these were below the permissible limits of Iron and Nickel set by [18] in edible plants which are 20 mg/l (20 ppm) and 10 mg/l (10 ppm) respectively. Copper was present in only the hydroethanolic extract (0.23±0.00 mg/l), below the 10 mg/l limit. Chromium and lead were undetected in all samples. Higher Ni and Cu in the hydroethanolic extract might be from the solvent. These results were supported by the acute safety study, suggesting that the extracts pose no harm when consumed.
Oxidative stress, linked to injuries results from prooxidant-antioxidant imbalance [19]. Antioxidants from plants defend against diseases and lower risks for diseases like cancer, heart disease [20]. A rapid and cost-effective method for antioxidant assessment employs DPPH radical. This method evaluates free radical scavenging activity and hydrogen donating capacity [20]. From this study, the aqueous and hydroethanolic extracts recorded percentage DPPH inhibition of 75.35 ± 0.42 and 75.81 ± 0.57 respectively, and the standard (gallic acid) having % DPPH inhibition of 97.60 ± 0.04. These results suggest that GTCMB could help in protecting against diseases.
Medicinal plants are rich in phenolic compounds with strong antioxidant potentials [21]. Phenolic compounds possess antioxidant abilities [22]. They protect against cell damage from reactive oxygen species such as hydrogen peroxide and lipid peroxides [23]. The total phenolic content in the extracts (aqueous: 513.34±0.14 mg GAE/100 g, hydroethanolic extract: 5740.46±0.62 mg GAE/100 g) correlates positively with their antioxidant activity [24]. The hydroethanolic extract exhibited the highest antioxidant potential. The results suggest that these extracts can protect against injuries and diseases through their antioxidant actions. One of the most essential groups of phenolics is flavonoids [25,26]. The ortho-dihydroxyl and conjugation structures in flavonoids are very significant due to their maximum free radical scavenging capacity [27]. Flavonoids are able to suppress the activity of oxidases enzymes [28,29]. Total flavonoid content of the extracts was determined using the Aluminium chloride method and using quercetin as the standard. The total flavonoid of the aqueous and hydroethanolic extract was found to be 715 ± 0.31 mg QE/ 100 g and 365.31 ± 0.15 mg QE/ 100 g respectively. These suggest that the aqueous and hydroethanolic GTCMB extracts could help in disease prevention.
The liver plays crucial roles in the body, aiding other organs and performing vital functions [30]. The liver can be damaged by hepatotoxins. Notable hepatotoxins include lead and acetaminophen [31]. Lead targets the liver and can cause severe damages even at low doses. Acetaminophen can cause side effects even at therapeutic doses. Liver damage from acetaminophen starts at doses as low as 125 to 150 mg/kg [31]. It harms the liver through mechanisms such as generation of a toxic metabolite, disruption of the mitochondria, and alteration of immune response [32].
Haematological parameters are crucial in evaluating health and physiological status, and often serve as indicators of various disease conditions. In this study, Lead and paracetamol caused significant decrease in haemoglobin and RBC when compared to the normal group. These reductions in haemoglobin and RBC counts by lead are in line with previous report by [33,34]. The decrease in haemoglobin and RBCs by paracetamol is also in agreement with previous report by [35]. Lead is known to have a direct effect on the haematopoietic system by hindering the synthesis of haemoglobin through the inhibition of various major enzymes which play crucial roles in the synthesis of haem. Besides, Lead decreases the lifespan of erythrocytes by altering the fragility of their cell membranes. These processes further result in anaemia [36,37]. On the other hand, the decrease in haemoglobin level in paracetamol treated group could be due to the reduction in the oxygen carrying capacity of blood and the quantity of oxygen transported to the kidney. And also, the reduction in RBCs count in the paracetamol treated group could be due to destruction of matured red blood cells and the reduction in the rate of red blood cells synthesis [35].
Administration of lead and paracetamol led to a significant increase in the populations of white blood cells (WBCs). This is in agreement with previous report by [38] and [39] respectively. According to [40], a significant elevation in total WBCs could be an indication of infection, trauma, inflammation and certain diseases. In other words, this could signify that the immune system has been compromised. Also, the administration of lead resulted in substantial decrease in platelets population. However, paracetamol administration did not have a significant effect on platelets population. This significant decrease in platelets population is a condition known as “thrombocytopenia”. According to [41], acute thrombocytopenia could be an indication of severe infection.
Liver enzymes such as Alanine transaminase (ALT), Aspartate transaminase (AST) and Gamma-glutamyl transferase (GGT) are the key indicators used to assess hepatotoxicity. Total bilirubin (TBIL) is also an indicator of liver diseases. In this study, lead and paracetamol administration resulted in a significant increase in key liver biomarkers such as ALT, AST and GGT including TBIL, confirming the successful induction of hepatotoxicity. When the liver becomes damaged, these liver biomarkers are released into the extracellular space [42]. Co-treatment with either aqueous or hydroethanolic extracts at most doses (especially at 500 mgkg-1 b.wt. hydroethanolic) brought about a significant decrease in the levels of these key indicators to near normal, a reflection of hepatoprotective potential. Also, lead and paracetamol administration significantly increased the levels of the enzymes, Alkaline phosphatase (ALP) and Lactate dehydrogenase (LDH). Surprisingly, most doses of the aqueous and hydroethanolic extracts especially, the 500 mgkg-1 b.wt hydroethanolic extract caused a significant decrease in the level of these enzymes,. It was also observed that the administration of paracetamol significantly increased the levels of total protein (TP). However, the administration of the aqueous and hydroethanolic extracts resulted in decrease in the level of total protein. The administration of lead did not have any significant effect on the levels of total protein. The hepatoprotective activity of these extracts could be attributed to the presence of phenolic compounds and other phytochemicals with potent antioxidant activities.
Inflammation is the body’s immune system’s way of responding to injuries or infections. Inflammation is an indication that the body is trying to combat foreign materials. A high Neutrophil to Lymphocytes Ratio (NLR) in the course of inflammation may be due to a drop in lymphocyte population or an elevation in neutrophil population or both [43]. Apart from NLR, Platelet to Lymphocytes (PLR) is also an inflammatory index in certain diseases [44,45]. The administration of lead and paracetamol resulted in a significant increase in NLR, confirming inflammation, thus injury. The administration of lead and paracetamol also caused increase in the level of PLR. However, co-treatment with the aqueous and hydroethanolic GTCMB extracts at most doses resulted in a decrease in the levels of NLR and PLR in both lead and para treated groups.
The results of histopathological examination of sections of liver tissues of normal, hepatotoxicant-induced groups and groups treated with extracts were examined using light microscopy as presented in Figure 10. These are consistent with liver damage observed in the biochemical parameters. Treatment with the aqueous and 50% hydroethanolic GTCMB extracts show reversion of hepatic damage when compared to the toxicants only groups, although the Pb- intoxicated groups treated with aqueous and hydroethanolic extracts showed higher level of regeneration of liver cells as compared to the paracetamol-intoxicated groups. This attests that the damage caused by paracetamol intoxication was higher than that caused by the Pb intoxication. The histopathological examinations confirm the hepatoprotective activities of the aqueous and 50% hydroethanolic GTCMB extracts. The aqueous and hydroethanolic extracts recorded almost equal percentage hepatoprotection against Pb intoxication (Figure 9) while the hydroethanolic extract recorded the highest percent hepatoprotection against paracetamol intoxication (Figure 9).
Conclusion
Based on the findings of this study, it is concluded that the polyherbal formulation of ginger, turmeric, cinnamon, moringa and black pepper extracts is safe and possesses protective effect against lead and acetaminophen-induced hepatotoxicity.
Data Availability
The data used to support the findings of this study are available within the article.
Author’s Contribution
All authors contributed equally to this work.
Ethical Approval
All animals were humanely treated following standard international protocols. The study protocol was reviewed and approved by a veterinarian in the research team.
Conflicts of Interest
The authors declare that there are no conflicts of interest.
Funding
The authors received no financial support for the research, authorship and/ or publication of this article.
References
- Ozougwu JC, Eyo, JE (2014) Hepatoprotective effects of Allium cepa extracts on paracetamol-induced liver damage in rat. African Journal of Biotechnology 13: 2679 -2688.
- World Health Organization (2020) Global Information System on Liver cases in the world. Age-standardized death rates, liver cirrhosis (15+) by country.
- Kaplowitz N (2002) Biochemical and cellular mechanisms of toxic liver injury. Semin Liver Dis 22: 37-44.
- Gulmez SE, Larrey D, Pageaux GP, Berneau J, Bissoli F, et al. (2015) Liver transplant associated with paracetamol overdose: results from the seven-country SALT study. Br J Clin Pharmacol 80: 599-606.
- Roper WL, Hauk VN, Flak H, Binder S (1991) Preventing Lead poisoning in young children; A statement by the Centers for Disease Control. Centers for Disease Control”, Atlanta, United States.
- Obeng-Gyasi E (2019) Sources of lead exposure in various countries. Rev Environ Health 34: 25-34.
- Cohen B, Wright CA (1999) A European perspective on organ procurement: breaking-down the barriers to organ donation. Transplantation 68: 985-990.
- Usman MRM, Chhaya G, Surekha S, Latit S, Rashimi S, et al. (2012) Pharmacognostical evaluations of Some Herbal plant. International Journal of Advanced Research in Pharmaceutical and Biosciences 1: 302-310.
- Srinivasan K (2005) Spices as influencers of body metabolism: an overview of three decades of research. Food Research International 38: 77-86.
- Harborne JB (1998) Phytochemical methods: a guide modern of plant analysis, 3rd edition, Springer Neture.
- Kedare SB, Singh RP (2011) Genesis and development of DPPH method of antioxidant assay. J Food Sci Technol 48: 412-444.
- Siddiqui N, Rauf A, Latif A, Mahmood Z (2017) Spectrophotometric determination of the total phenolic content, spectral and fluorescence study of the herbal Unani drug Gul-e-Zoofa (Nepta bracteate Benth). J Taibah Univ Med Sci 12: 360-363.
- Chandra S, Khan S, Avula B, Lata H, Yang MH, et al. (2014) Assessment of total phenolic content, antioxidant properties, and yield of aeroponically and conventionally grown leafy vegetables and fruit crops: A comparative study. Evid Based Complement Alternat Med 2014: 253875.
- Hseu ZY (2004) Evaluating heavy metal contents in nine composts using four digestion methods. Bioresour Technol 95: 53-59.
- National Research Council (2011) Guide for Care and Use of Laboratory Animals National Academic Press, Washington D.C., USA, 8th edition, 43-45.
- Niaz K, Shah MA, Khan F, Saleem U, Vargas C, et al. (2020) Bioavailability and safety of phytonutrients. In Phytonutrients in Food 220: 117-136.
- Narzary H, Islary A, Basumatary S (2016) Phytochemical and antioxidant properties of eleven wild edible plants from Assam, India. Mediterranean Journal of Nutrition and Metabolism 9: 191-201.
- FAO/WHO, “Contaminants. In Codex Alimentarius (1984) vol. XVII, Edition 1. FAO/WHO Codex Alimentarius Commission, Rome, Italy
- Liu JK, Atamna H, Kuratsune H, Ames BN (2002) Delaying brain mitochondrial decay and aging with mitochondrial antioxidants and metabolites. Ann N Y Acad Sci 959: 1133-1166.
- Shekhar TC, Anju G (2014) Antioxidant activity by DPPH radical scavenging method of Ageratum conyzoides Leaves. American Journal of Ethnomedicine 1: 244-249.
- Kirtikar KR, Basu BD (2006) Indian medicinal plants. International book distributors, Dehradum, Uttarakhand, Indi: 993-994.
- Li H, Hao Z, Wang X, Huang L, Li J (2009) Antioxidant activities of extracts and fractions from Lysimachia foenum-graecum Hance. Bioresour Technol 100: 970-974.
- Tung YT, Wu JH, Kuo YH, Chang ST (2007) Antioxidant activities of natural phenolic compounds from Acacia confuse bark. Bioresour Technol 98: 1120-1123.
- Sroka Z, Cisowski W (2003) Hydrogen peroxide scavenging and anti-radical activity of some phenolic acids. Food Chem Toxicol 41: 753-758.
- Ganesan K, Xu B (2017) Polyphenol- rich dry common beans (Phaseolus vulgaris) and their health benefits. Int J Mol Sci 18: 2332.
- Larbie C, Appiah-Opong R, Acheampong F, Tuffour I, Uto T, et al. (2015) Anti-proliferative effect of Ficus pumila Linn on human leukemic cell lines. International Journal of Basic and Clinical Pharmacology 4: 330-336.
- Manach C, Scalbert A, Morand C, Remsey C, Jimenez L (2004) Polyphenols: food sources and bioavailability. American Journal of Clinical Nutrition 79: 727-747.
- Rice-Evans CA, Miller NJ, Paganga G (1996) Structure-antioxidant activity relationships of flavonoids and phenolic acids. Free Radical Biology and Medicine 20: 933-956.
- Escamilla CO, Cuevas EY, Guevara J (2009) Flavonoides y sus acciones antioxidants. Revista de la Facultad de Medicina 52: 73-75.
- Reinke H, Asher G (2016) Circadian clock control of liver metabolic functions. Gastroenterology 150: 574-80.
- Sturgill MG, Lambert GH (1997) Xenobiotic-induced- hepatotoxicity: Mechanisms of liver injury and method is of monitoring hepatic function. Clinical Chemistry 3: 1512-1526.
- Dargan PI, Jones AL (2002) Acetaminophen poisoning: an update for the intensivist. Journal of Critical Care 6: 108-110.
- Lee WM (1995) Drug-induced hepatoxicity. The New England Journal of Medicine 333: 1118-1127.
- Ibrahim NM, Eweis EA, El-Beltagi HS, Abdel-Mobdy YE (2012) Effect of lead acetate toxicity on experimental male albino rat. Asian Pacific Journal of Tropical Biomedicine 2: 41-46.
- Oyedeji KO, Bolarinwa AF, Ojeniran SS (2013) Effect of paracetamol (acetaminophen) on haematological and reproductive parameters in male Albino rats. Journal of Pharmacy and Biological Sciences 4: 65-70.
- Guidotti TL, McNamara J, Moses MS (2008) The interpretation of trace element analysis in body fluids. Indian Journal of Medical Research 128: 24-532.
- Flora G, Gupta D, Tiwari A (2012) Toxicity of lead: a review with recent updates. Interdisciplinary Toxicology 5: 47-58.
- Offor SJ, Mbagwu HOC, Orisakwe OE (2017) Lead induced hepato-renal damage in male Albino rats and effects of activated charcoal. Frontiers in Pharmacology 5: 1-10.
- Menyiy NE, Al-Waili N, El-Ghouizi A, Al-Waili W, Lyoussi B (2018) Evaluation of antiproteinuric and hepato-renal protective activities of Propolis in paracetamol toxicity in rats. Nutrition Research and Practice 12: 535-540.
- Chmielewski PP, Strzelec B (2017) Elevated leukocyte counts as a harbinger of systemic inflammation, disease progression, and poor prognosis: a review. Folia Morphologica 77: 171-178.
- Parikh F (2016) Infections and thrombocytopenia. The Journal of the Association of Physicians of India 64: 11-12.
- Ozer J, Ratner M, Shaw M, Bailey W, Schomaker S (2008) The current state of serum biomarkers of hepatoxicity. Toxicology 245: 194-205.
- Kim DS, Shin D, Lee MS (2016) Assessments of neutrophil to lymphocyte ratio and platelet to lymphocyte ratio in Korean patients with psoriasis vulgaris and psoriatic arthritis. The Journal of Dermatology 43: 305-10.
- Thomas MR, Storey RF (2015) The role of platelets in inflammation. Journal of Thrombosis and Haemostasis 114: 449-58.
- Hao X, Li D, Wu D (2017) The relationship between haematological indices and autoimmune rheumatic diseases (ARDs), a meta-analysis. Scientific Reports 7:10833.
Citation: Sedeafor R, Larbie C, Emikpe BO, Sarfo-Antwi F, Donkor S, et al. (2024) Safety and Hepatoprotective Assessments of Polyherbal Formulation in Lead and Acetaminophen-induced Hepatotoxicity in Rats. J Altern Complement Integr Med 10: 438.
Copyright: © 2024 Richard Sedeafor, et al. This is an open-access article distributed under the terms of the Creative Commons Attribution License, which permits unrestricted use, distribution, and reproduction in any medium, provided the original author and source are credited.