Scientific Fraud Not Due to Fraudulent Research in Science
*Corresponding Author(s):
Ahmed Nasr M GhanemMOH And Mansoura University, Faculty Of Medicine, Consultant Urologist Surgeon- Retired, Independent Scientist Investigator, Free Lance Author, Dreamer & Revolutionary, Egypt
Tel:+20 1158346048,
Email:anmghanem1@gmail.com
Abstract
Scientific fraud is caused by Fraudulent Research in Science (FRS) or Fraudulent Science (FS) induced by an unintentional error. Although both are totally different, they both have deleterious effect on patient care. The FS is induced by unintentional errors based on false believes and misconceptions due to immaturity of science at the time of the research and publication. It is validated by new discoveries that complete the scientific knowledge and by careful critical analytical review of the literature that is highly motivated in seeking the truth. The FRS is an act of deception or misrepresentation of one's own work which violates ethical standards is not discussed here.
This article reports 6 major errors affecting impactful landmark articles that concern the capillary physiology and ARDS that have serious deleterious effect on patient care. The reported examples of errors in physiology, medicine and science include:
- The wrong Starling’s law.
- Two misconceptions on capillary physiology.
- A significant error in the study that transferred Starling’s hypothesis into a law.
- Error on the article reporting on Precapillary sphincters maintain perfusion in the cerebral cortex.
- A gross erroneous conclusion of the study that advanced the concept and practice of liberal fluid infusion in septic shock and other types of shock that causes ARDS.
Natural Selection on the evolution of man. The regulatory authorities on scientific fraud should take notice of the reported examples of FS and validate the issues doing the needful.
Keywords
Fraudulent research in science; Fraudulent science; Publication ethics; Scientific fraud
Introduction
Scientific fraud is caused by Fraudulent Research in Science (FRS) or Fraudulent Science (FS) induced by an unintentional error. Although both are totally different, they both have deleterious effect on patient care. The FS is induced by unintentional errors based on false believes and misconceptions due to immaturity of science at the time of the research and publication. It is validated by new discoveries that complete the science and by careful critical analytical review of the literature that is vigilantly attentive with high motivation in seeking the truth.
The FRS is an act of deception or misrepresentation of one's own work which violates ethical standards. It can take the form of plagiarism, falsification of data, and irresponsible authorship. It has been attributed to misdirected attempts to attain high levels of personal and professional success. Researchers so prone commit scientific fraud in a search for promotion, status, tenure, and the obtaining of research grants [1]. Fraud is an important issue that affects research of both scientific and clinical fields because of its potential to adversely affect patient care. Fraud can take many forms, each with varying prevalence and implications. Several ethical institutions have been created to investigate and regulate this malpractice [2].
Since a few years, the number of cases of fraud reported in the scientific and medical literature and retraction of articles has increased exponentially. Such fraud is due to fabrication, falsification, theft, embellishment or retention of data, plagiarism, incorrect list of authors or undisclosed conflicts of interest. This tendency has been explained by the need to publish for career advancement (Publish or Perish!) or the future of the department, the search for notoriety, the desire to grow rich and the lack of motivation to seek the truth. This crisis can be controlled by measures at different levels: society, universities, scientific institutions, study promoters, scientific and medical journals. A legal framework at EU level would allow to combat such fraud more efficiently [3]. This part of science fraud has been extensively covered in the literature and is not discussed any further here.
This Article Deals With The New Subject Of FS Giving Examples Of Such Errors And How It Can Be Detected And Corrected
Error 1: The wrong starling’s law
Starling’s law has proved wrong on both of its forces [4-10]. However, it remains to dictate the current faulty rules on fluid therapy in the management of shock. It thus misleads physicians into giving too much fluid during shock resuscitation [11]. More than 21 reasons were reported to show that Starling’s law is wrong [12]. The correct replacement is the hydrodynamic of the porous orifice (G) tube [4] (Figures 1 and 2), that was built on capillary ultra structure anatomy of having precapillary sphincter [13] and a porous wall [14], that allow the passage of plasma proteins-hence nullify the oncotic pressure in Vivo. It follows that the extended Starling Principle is wrong and a misnomer [10] and all the equations are also wrong.
Substantial evidence currently exists to demonstrate that Starling’s law is wrong [4-9], the revised Starling Principle is a misnomer [10] and all the formulae that goes with it are also wrong. Commonly received but erroneous concepts and laws represent fraud in modern science. Starling’s law for the capillary-Interstitial Fluid (ISF) transfer is a famous example. Persistent to defend such erroneous concepts is a futile attempt to defend fraudulent science. 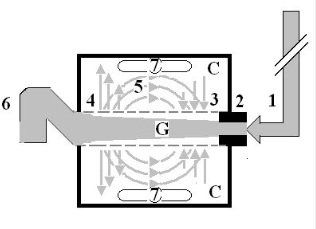
Figure 1: Shows a diagrammatic representation of the hydrodynamic of G tube based on G tubes and surrounding chamber C.
This 37-years old diagrammatic representation of the hydrodynamic of G tube in chamber C is based on several photographs. The G tube is the plastic tube with narrow inlet and pores in its wall built on a scale to capillary ultrastructure of precapillary sphincter and wide inter cellular cleft pores, and the chamber C around it is another bigger plastic tube to form the G-C apparatus. The chamber C represents the ISF space. The diagram represents a capillary-ISF unit that should replace Starling’s law in every future physiology, medical and surgical textbooks, and added to chapters on hydrodynamics in physics textbooks. The numbers should read as follows:
- The inflow pressure pushes fluid through the orifice
- Creating fluid jet in the lumen of the G tube**.
- The fluid jet creates negative side pressure gradient causing suction maximal over the proximal part of the G tube near the inlet that sucks fluid into lumen.
- The side pressure gradient turns positive pushing fluid out of lumen over the distal part maximally near the outlet.
- Thus, the fluid around G tube inside C moves in magnetic field-like circulation (5) taking an opposite direction to lumen flow of G tube.
- The inflow pressure 1 and orifice 2 induce the negative side pressure creating the dynamic G-C circulation phenomenon that is rapid, autonomous, and efficient in moving fluid and particles out from the G tube lumen at 4, irrigating C at 5, then sucking it back again at 3.
- Maintaining net negative energy pressure inside chamber C.
Note: **The shape of the fluid jet inside the G tube (Cone shaped), having a diameter of the inlet on right hand side and the diameter of the exit at left hand side (G tube diameter). I lost the photo on which the fluid jet was drawn, using tea leaves of fine and coarse sizes that runs in the center of G tube leaving the outer zone near the wall of G tube clear. This may explain the finding in real capillary of the protein-free (and erythrocyte-free) sub-endothelial zone in the Glycocalyx paradigm. It was also noted that fine tea leaves exit the distal pores in small amount maintaining a higher concentration in the circulatory system than that in the C chamber- akin to plasma proteins and ISF space.
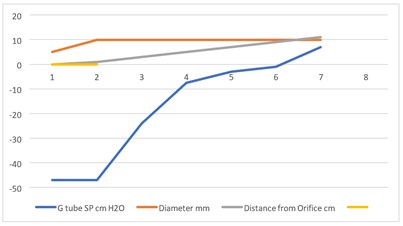 Figure 2: Shows the relationship between SP to Diameter and length of the G tube which demonstrate a negative SP starting at the orifice (Point 1-2) and extends as negative gradient over the proximal part of the G tube (Points 2-6) to cross 0 line and then turn positive of 7 cm water at the tube’s exit (Point 7). This SP gradient from orifice Point 1-2 to G tube lumen (Points 2-6) is negative to become positive of 7 cm H20 at point 7 at the G tube’s exit. The wide section diameter of the G tube is 7 mm at exit and 5 mm at orifice while the Length (L) from orifice to exit is 100 mm. The fluid jet has an increasing diameter gradient (Dj). Neither Poiseuille’s equation nor Bernoulli’s equation can predict the negative SP neither at orifice nor at the proximal part of the G tube. Thus, the Fast RBCs speed or CBS depend on the orifice diameter or precapillary sphincter diameter not the G tube or capillary diameter. In the wide section of the G tube or capillary the fluid jet presented with increasing diameter inside the G tube. Hence the equation in procures wrong result producing too slow and single RBCs speed or CFS for the whole body of the tube. The figure of 4.7 mm/s [2], applies precisely only at the distal part near the exit of the capillary- not along its entire length as a in the G tube.
Starling reported his hypothesis in 3 articles in the Lancet in 1886 [15] and a fourth in J Physiology in 1896 [16]. He proposed that fluid exchange across the capillary wall is dependent upon the balance between two main opposing forces. The hydrostatic pressure pushing fluid out and the oncotic pressure withdrawing fluid into the capillary lumen. The hydrostatic pressure is a function of the arterial pressure and is higher near the capillary inlet that pushes fluid out over the proximal part as based on Poiseuille’s work on a strait, uniform brass tubes. The oncotic pressure of plasma proteins becomes higher near the capillary exit and sucks fluid in over the distal part. In fairness to professor Starling, he nether proposed a law nor equation for his hypothesis. Starling’s hypothesis became a law later with equation after the report by Pappenheimer and Soto-Rivera in [5], as shown below. The discovery of the hydrodynamic of the porous orifice (G) tube has not only proved and validated that Starling’s law is wrong but has also provide the correct alternative mechanism for the capillary-Interstitial fluid transfer (More on this below).
Error 2: A significant error in the study that transferred Starling’s hypothesis into a law
Starling’s hypothesis became a law later with equation after the report by Pappenheimer and Soto-Rivera in [17]. A serious experimental error by these authors is identified and reported here. These authors thought that elevating the capillary pressure may be achieved by elevating the venous pressure or arterial pressure alike, matching mmHg for mmHg, and they reported this to be in support of Starling’s hypothesis. However, this has proved wrong, based on evidence from clinical practice: Elevating venous pressure (Distal Pressure (DP)) augments capillary filtration as known in clinical practice causing oedema formation while elevating Proximal Pressure (PP) akin to arterial pressure does not, it enhances suction or absorption via the negative Side Pressure (SP) maximum near the inlet as demonstrated in the porous orifice (G) tube (Figures 1 and 2), and chamber C around it (Figures 3 and 4).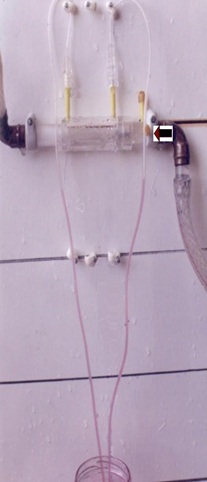 Figure 3: Shows the G tube enclosed in chamber C (The G-C apparatus). The negative side pressure of G tube also creates a negative pressure in C shown here to suck the red water from a jar 300 mm below G tube into the manometers.
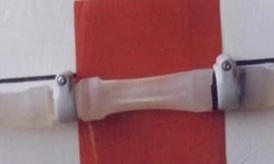 Figure 4: Shows the G tube enclosed in a rubber chamber (C) which is sucked in not ballooned out demonstrating the negative pressure in (C) akin to the negative pressure measured by Guyton and Colman [17], using a subcutaneous implanted chamber- a remarkable fact that cannot be explained by Starling’s forces.
In support of the above fact is: High venous pressure, or obstruction, is the main cause of the most common clinical oedema but arterial hypertension though quite common it never causes oedema. Of course, neither Starling nor any of the authors who transferred his hypothesis into a law were aware of the brilliant discoveries of precapillary sphincter [13] and wide porous wall of intercellular clefts [14], of the capillary that allow the passage of plasma proteins thus nullifies oncotic pressure in vivo that were discovered later in 1967. The G tube discovery demonstrates that PP akin to arterial pressure induces negative SP gradient exerted on the tube’s wall that is maximum near the inlet causing suction or absorption. In addition to this I have reported 21 reasons that prove starling’s law wrong [12]. So, both Starling’s forces are wrong and so is the equations.
The same wrong conception that elevating CVP to levels of 20-22 cm H20 may elevate the arterial pressure in shock management by infusing too much fluid was prevailing in clinical practice till recently. Fortunately, such practice has stopped now since it was realized that it induces Volumetric Overload Shocks (VOS) [9], that cause the interstitial oedema of vital organs and subcutaneously causing ARDS. It is worth mentioning the relation of G tube orifice diameter to SP of the G tube and the surrounding chamber C Pressure (CP) shown in (Figures 1 and 2). This is relevant to the negative ISF pressure measured by Guyton and Coleman subcutaneously to be of -7 cm water [18]. This negative pressure of the ISF space can only be explained by hydrodynamics of the capillary working as G tube. Starling’s forces cannot account for this negative pressure of ISF space and lymph vessels at all.
Error 3: Misconceptions on capillary cross-section areas and blood speed
Current teaching on capillary physiology indicates that the Red Blood Cells (RBCs) speed or the Capillary Blood Speed (CBS) is “very slow” running leisurely through capillaries to allow for the slow “perfusion” to take place as based on Starling’s forces. This is based on another misconception that the sum of cross section areas of all the capillaries is very much greater than the cross-section area of the Aorta. It is hard to trace the scientific foundations of these 2 misconceptions. I have previously reported that Starling’s law is wrong [4-9], the Revised Starling’s Principle (RSP) is a misnomer [10], and the correct replacement is the hydrodynamics of the porous orifice (G) tube [1-9]. This creates a negative side pressure gradient exerted on the wall of the G tube. A unique autonomous rapid dynamic magnetic field-like fluid circulation occurs between fluid in G tube lumen and fluid around it in a surrounding chamber C. This induces a fast fluid transfer between lumen of the G tube and fluid surrounding it in chamber C (Figures 1-4). The same phenomenon of the G tube explains the capillary-Interstitial Fluid (ISF) transfer.
Here I report the new Tree Branching Law (TBL) that demonstrates that the above two well-known and received concepts concerning capillaries cross section area is “greater than the aorta” and RBCs Speed is “very slow” are in fact erroneous misconceptions.
The Tree Branching Law (TBL): Discovery of the TBL rectifies these two misconceptions.
The TBL states that: “The trunk of a branching tree does not, and cannot, give rise to branches that have sum of all its cross-section areas larger than its own”.
In other words: “The sum of all tree branches’ cross-section areas is less than its own trunk.”
This observational theory on green trees as well as the red vascular tree of the aorta and its arterial branches that was mentioned before having now been investigated and reported [19]. The results of scientific, mathematical, and experimental evidence show that TBL is correct and are summarized here. This law rule applies up a green tree to its leaves as a branch becomes a mother trunk for its own sibling branches (Figure 5) and further down the arterial tree to the terminal arterioles and capillaries (Figure 6).
 Figure 5: Shows Monera’s Household Croton Tree. It faithfully applies the TBL down to and including the terminal branches. The leaf stems, however, represent an exception to the law perhaps because it represents terminal function unit rather that the transport conduit that all branches represent.
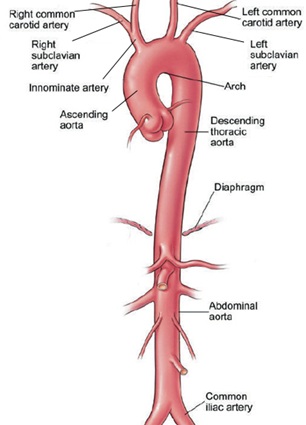 Figure 6: Shows the Aorta (Trunk) and its main first level arteries (Branches). The aorta gives rise to 45 first degree order arteries that vary in diameters but are all measurable, hence the cross-section area is calculated and compared to that of the aorta. When the precise engineering measurement data on terminal arterioles and capillaries become available it should be possible to calculate an approximate correct number of capillaries based on known capillary diameter and its number arising from the terminal arteriole. (This figure is reproduced from an article on the aorta by Cleveland clinic.).
Aorta and its primary arterial branches that applies down to arterioles and precapillary sphincters. The same principle from the green tree applies to the aorta and its primary arteries originating from its trunk. The aorta gives rise to 45 named arteries of various diameters, the sum of all arteries’ cross-section areas is not greater than that of the aorta. In fact. it is less than the aorta (Table 1). The same principle applies further down as arteries divide into into smaller arterial branches and so on down to the smallest arteriole and its own capillaries. The rule still applies to the capillaries despite having a bigger diameter than the precapillary sphincter but not bigger than the preceeding arteriole. Remmember also that not all the capillaries work at the same time, large number are functional but not all. It also continues down the aortic arteries to the level of terminal arterioles and precapillary sphincters where the capillaries originate. So, the sum of cross sections area of all the arterioles as compared to that of the aorta is less than, not more than, its trunk. The sum of cross section areas of all the capillaries are also less than the feeding arterioles and accordingly less than the aorta.
|
Showing or Not |
Aorta D |
Branch Name |
Br No |
D |
A mm^2 |
Total Area |
|
Showing |
11.95 |
Coronary |
2 |
1 |
0.78571429 |
1.57142857 |
|
Showing |
5.975 |
Innominate A |
1 |
3.96 |
12.3212571 |
12.3212571 |
|
Showing |
L Common Carotid A |
1 |
2.56 |
5.14925714 |
5.14925714 |
|
|
Showing |
L Subclavian A |
1 |
2.57 |
5.18956429 |
5.18956429 |
|
|
Showing |
Coeliac A |
1 |
4.18 |
13.7283143 |
13.7283143 |
|
|
Showing |
Super Mesentric A |
1 |
2.4 |
4.52571429 |
4.52571429 |
|
|
Not Showing |
Suprarenal A |
2 |
0.5 |
0.19642857 |
0.39285714 |
|
|
Showing |
Renal A |
2 |
2.9 |
6.60785714 |
13.2157143 |
|
|
Showing |
Gonadal A |
2 |
1 |
0.78571429 |
1.57142857 |
|
|
Showing |
Inferior Mesentric A |
1 |
2 |
3.14285714 |
3.14285714 |
|
|
Showing |
R Common iliac A |
1 |
5 |
19.6428571 |
19.6428571 |
|
|
Showing |
L Common Iliac A |
1 |
4.94 |
19.1742571 |
19.1742571 |
|
|
Not Showing |
Intercostal Arteries |
18 |
0.5 |
0.19642857 |
3.53571429 |
|
|
Not Showing |
Inferior Diaph A |
2 |
0.5 |
0.19642857 |
0.39285714 |
|
|
Not Showing |
Lumbar Arteries |
8 |
0.5 |
0.19642857 |
1.57142857 |
|
|
Showing |
Sacral Artery |
1 |
1.2 |
1.13142857 |
1.13142857 |
|
|
112.202 |
Total |
45 |
92.577 |
105.864 |
Table 1: Shows the data on the aorta and its primary branching arteries. The number in bald red compares the cross-section area of the aorta to the total number of branches’ cross section area.
The measurements of the aorta and arteries diameters in this study are taken on the outside of the aorta and arteries wall from the photograph (Figure 6). A more acurate method is to measure the internal daimeters of the aorta and its arterial branches. The best way to achieve that is to make a rigid cast of the aorta, the 1st order arteries and the 2nd order branches using liquid cement injected into the aorta, leaving it to dry and harden, then remove the outer aorta and arteries walls, leaving the hard cast intact for measurements of diameters. This is a worthwhile project for a young researcher working on his MD dergee in cardiovascular anatomy or physiology [20-24].
The TBL is not just a scientific curousity of trivial importance but very important issue for understanding the capillary physiology. It verifies that the cross-section areas of the sum of all functional capillaries must be less than that that of the aorta. This is the scientific basis for the wrong believe that the cross section areas of the capillaries is “much greater” than the aorta- based on which the predicted CBS or RBCs speed is thought “very slow”, while in reality it is proved fast [1]. The speed gradient of CBS or RBCs speed along the capillary must account for the magnetic field-like fluid circulation around the capillary as it occurs in the G tube (Figure 1).
Error 4: Grubb et al., report [25], on the calculated capillary pressure and red blood cells (RBCs) speed or capillary blood speed (CBS).
I commend and congratulate the authors on their brilliant timely article [25], on the role of precapillary sphincter and its primary importance in regulating blood flow and pressure into the cerebral cortex as well as every other tissue and organ in the body. Their tremendous effort of conducting this awesome research work is most appreciated. However, I fear that some of the authors’ derived physiological values particularly CBS or RBCs Speed and pressure are inaccurate due to a fault that is not their own. They were being misled by many errors and misconceptions transferring Starling’s hypothesis into a law, and by inadequacies of Poiseuille’s law and Bernoulli’s equation as explained here. This has led to some incorrect derived results, graphs and conclusions highlighted by wrongly using the word “perfusion” in the title of their article. This is a common and prevailing physiological misconception that RBCs speed in the capillary is “very slow” to allow for the slow “perfusion” of fluid and particles from the capillary to ISF space and cells found in all current textbooks and physiological teaching on the capillary-Interstitial Fluid (ISF) transfer. The word “perfusion” is based on the currently accepted physiological law of Starling’s forces that are generally believed to regulate the capillary-ISF transfer through “perfusion” balance influenced by its 2 main forces. The 2 main forces of Starling’s law believed to induce this “perfusion” balance state are the hydrostatic pressure of the capillary causing filtration, and the osmotic (oncotic) pressure of plasma protein (albumin) causing absorption. Here I demonstrate that Starling’s law is wrong on both forces and the correct replacement for it is the hydrodynamics of the porous orifice (G) tube. The physics evidence was preliminary reported in 2001 [7], emphasized 2017 [8] and concluded in 2020 [11] and 2021 [1]. The physiological evidence was reported in 2017 [9].
The porous orifice (G) tube was built on a scale to the capillary ultrastructure anatomy of precapillary sphincter [13] and the wide intercellular cleft pores [14], that allow the passage of plasma proteins, hence nullify the oncotic pressure in vivo. Investigating the hydrodynamics of the G tube, and contrasting it to Poiseuille’s tube, demonstrated that the hydrostatic pressure is different from the 2 hydrodynamic pressures of moving fluid: The Flow Pressure (FP) responsible for the flow and works in its direction only, and Side Pressure (SP) exerted on the tube’s wall in a perpendicular circular direction. The hydrodynamics of the G tube are totally different from Poiseuille’s tube. The G tube has a negative SP gradient that is maximum negative near the inlet and turns gradually positive to become maximum near the exit. Thus, in the G tube suction or absorption of fluid occur through side holes near the inlet while filtration occurs through holes near the exit. This creates the unique autonomous rapid dynamic magnetic field like fluid circulation in a surrounding Chamber (C) between fluid around the G tube inside C and fluid inside its lumen. The negative SP of the G tube creates net negative pressure in chamber (C) (Figures 3 and 4).
The flow in chamber C is in the opposite direction to the flow of fluid in the G tube lumen. This magnetic field-like fluid circulation (Figure 1) regulates the fast capillary ISF transfer that can provide for the cell’s viability at rest and exercise, not the slow perfusion. To make the issues clear may I gently remind the authors that the hydrodynamic of the G tube demonstrates that there are 2 dynamic pressure components of a moving fluid in any tube such as Poiseuille’s and the G tube that are different from the hydrostatic pressure. The 2 dynamic pressure components are: Flow Pressure (FP) in the direction of flow that is high positive in both Poiseuille’s and G tubes and is responsible for the flow. Side Pressure (SP) exerted on the tube’s wall that is positive but lower than FP in Poiseuille’s tube. This SP is negative pressure gradient in the G tube maximum negative near the inlet and turns positive maximum near the exit. The negative SP of G tube is demonstrated in diagram shown in (Figure 1) that is based on many reported photographs. This SP creates net negative pressure in a chamber C surrounding the G tube.
The authors used a graph with the modified equation above the graph (Figure 2) for calculating the values of (ΔP) as well as the RBCs speed or CBS: It can be immediately demonstrated that the equation and the graph are wrong as there is a definite negative pressure exerted on the wall of the constriction of the tube exactly at the precapillary sphincter that is well known as the Venturi’s effect. Neither the equation’s (ΔP) nor the graph demonstrates this negative side pressure exerted on the wall of the precapillary sphincter. Similarly, the calculated RBCs velocity assuming it means the same as CBS as based on the above given equation in the precapillary sphincter lumen as well as the bulb and proximal capillary gives a “slow speed” of “a single value” that may be wrong because the RBCs speed is high over the proximal part of the capillary, that includes both the bulb and proximal capillary. It then gradually decelerates or slows down towards the end of the capillary or G tube. The equation does not reflect this CBS gradient that is fast at orifice where the speed of the ejected blood jet from the orifice of the capillary (the precapillary sphincter) is the same as in the bulb area and remains high in the proximal capillary, then gradually decelerates towards the exit end of the capillary.
Error 5: A gross erroneous conclusion of the study that advanced the concept and practice of liberal fluid infusion of Early Goal-Directed Therapy (EGDT) in septic shock and other types of shock that cause ARDS
The prevalence of “liberal” fluid infusion in resuscitation of all types of shocks not only septic shock in clinical practice all over the world is attributed to an impactful article by Rivers et al, reported at The N Engl J Med [20]. Dr Rivers’ investigation reported the Early Goal-Directed Therapy (EGDT) in the treatment of severe sepsis and septic shock. In this single-centre study published more than 20 years ago involving patients presenting to the emergency department with severe sepsis and septic shock, the conclusion was: “mortality was markedly lower among those who were treated according to a 6-hour protocol of EGDT, in which intravenous fluids, vasopressors, inotropes, and blood transfusions were adjusted to reach central hemodynamic targets, than among those receiving usual care” Usual care means conservative fluid regime. In clinical practice EGDT was translated into liberal fluid therapy.
There is something grossly wrong with this conclusion, but is not easy to detect and I cannot tell what is it? Not yet. Let us see what other author investigators have said first. The EGDT of liberal fluid infusion has been termed “aggressive” by some authors. However, it has been adopted all over the world not only for the therapy of septic shock but also whenever fluid therapy is required. In another article by Dr Rivers 11 years later in 2012 [21], he compared the liberal to the conservative approach concluding in his last statement: “In contrast to what is true in politics, in fluid management of acute lung injury, it is OK to be both liberal and conservative.” So, Dr Rivers says it is OK to have it both ways: “one for the ebb and one for the flow”! Sorry, sir, I disagree. It is not OK. It is not politics either. No, you cannot have it both ways. The right way is only one. The issue here is how much fluid should be infused during the ebb phase of shock and does it have a maximum limit? Replace the loss but do not overdo it. Since the CVS’ maximum capacity of an adult is 7 L and the normal blood volume is 5 L, the maximum infused volume of fluid should be limited by the maximum capacitance of the CVS. What do you expect when you try to fit 10-15 L of fluid into a 7 L capacity container? Simple physics and common sense indicate that it must spell over if it is open system or burst if closed! The cardiovascular system is no exception.
Dr Rivers should re-examine his own data and tell us where and why he went so grossly wrong. The traumatized bleeding patient, for example, dies before reaching the hospital if half the blood volume is quickly lost. In sepsis, severe sepsis and septic shock, there is no fluid loss at all. In the “liberal” approach of EGDT there seem to be no limit on how much fluid should be infused. This VO induce hypervolaemic state that internally drowns the swollen patient on ICU. To resolve this most elusive puzzle of ARDS, there is a need to define this maximum volume of infused fluids not only for the liberal but also for the conservative approach. I know there are a few situations when this maximum must be exceeded such as in severely burned and the continuously bleeding patients that cannot be stopped and perhaps heat stroke. In these situations, the advice is: stop the bleeding, replace the loss but do not overdo it.
The EGDT concept has proved wrong by 3 huge prospective multi centre trials. The PRISM Investigators reported its Trial by Rowan et al at NEJM 20177 concluded [22]. “In this meta-analysis of individual patient data, EGDT did not result in better outcomes than usual care and was associated with higher hospitalization costs across a broad range of patient and hospital characteristics.” Thank you, Dr Rowan and colleagues for the excellent research and report. This is good evidence-based medicine, but more is needed, from you, and you have the data to provide it. Based on this conclusion that agrees with other multi-centre trials I wonder is time to say goodbye Dr, Rivers? The aggressive and deleterious liberal approach of EGDT is no longer wanted. It should be abandoned immediately. Even when the nasty liberal approach goes away, hopefully soon, it remains bad enough with the conservative regime as it is now that must be sorted out! I wonder what Dr Rivers has to say about this, particularly as authors of 3 other huge prospective multi-centre trials of The ProCESS/ARISE/ProMISe reported similar conclusion by Huang et al. [23]. What is the gain from doing such long huge expensive trials if its conclusion and recommendation are not implemented, immediately?
What is most interesting, relevant, and important in the reported data in the results section of the article by Rowan et al. [22], on fluid balance in ARDS patients who wrote the following: “Each study day the liberal-strategy group received more fluid than the conservative-strategy group and on days 1 through 4 had a lower urinary output, resulting in a higher cumulative fluid balance. During the study, the seven-day cumulative fluid balance was -136±491 ml in the conservative-strategy group, as compared with 6992±502 ml in the liberal-strategy group (P<0.001). So, >3 L, >5 L (7%) and (>10 L (about 15%) Body Weight (BW) occurs in surviving ARDS cases. About 12-14 L was reported by Ashbaugh et al. [24], is the VO that characterizes the dead patients. Even the 3 L volume of fluid that is the normal daily fluid intake becomes pathological when infused to a normal adult within one hour.
Thank you very much indeed Kathryn for documenting these data. Thanks also to Haung et al. [23] and all authors of the ProCESS/ARISE/ProMISe trials for having similar results. In my knowledge, this is the first time we come across a prospective trial on ARDS that reports VO data with such clarity except the original first report on ARDS by Ashboagh et al. [24]. However, no article has incriminated VO in the patho-aetiology of ARDS except my reports mentioned in all the self-references reported here [26].
The regulatory authorities on scientific fraud and ethical institutions should take notice of the above reported examples of FS and validate the issues doing the needful.
Error 6: Natural selection on the evolution of man: Darwin the great was silent as the error was not his
Every known religion state that God almighty created Adam from mud (Earth and water) and Eve from Adam’s bent rib. Nobody has seen God, but we all believe in his almighty telling us the truth. This is clearly stated in the Qur’an the only holly book of Allah. No God-fearing scientist will believe this nonsense. Adam and Eve in turn gave birth to their children and grand grandchildren, that is all of us humans of all colours white to black, yellow, and brown and the in between. If you prefer to think that you came from monkey origin, suit yourself that is your monkey business. The theory may work on natural selection of the same species when the good and strong outlive and inherit the feeble and sick, and it also works well on artificial selection on manmade machines and inventions. The video and DVD players are examples that have gone into demise while TV, Mobiles and the Internet on computers have evolved into thin powerful touch screen marvellous useful devises. There will always be companies that go out of business during peace and disastrous times and others that emerge strong and profitable. The problem was created by Commentators who tried to simplify the theory on the origin of man and his history making it too simple and stupid one with a fake sequence of falsely constructed photographs to prove it (Figure 7) that is though may be theoretically appealing is visually and logically misleading. Charles Darwin the great said “light will be thrown on the origin of man and his history” [27] and here it is.
 Figure 7: Shows a famous picture of human development from a monkey origin by Natural Selection an example of a famous commonly received Fraudulent Science. The picture is though may be theoretically appealing is visually and logically misleading.
Tattersall wrote [27]: “Along with his younger colleague Alfred Russel Wallace, Charles Darwin provided the initial theoretical underpinnings of human evolutionary science as it is practiced today. Clearly, nobody seeking to understand human origins, any more than any other student of the history of life, can ignore our debt to these two men. As a result, in this bicentennial year when Darwin’s influence in every field of biology is being celebrated, it seems reasonable to look back at his relationship to paleoanthropology, a field that was beginning to take form out of a more generalized antiquarian interest just as Darwin was publishing On the Origin of Species in 1859. Yet there is a problem. Charles Darwin was curiously unforthcoming on the subject of human evolution as viewed through the fossil record, to the point of being virtually silent. He was, of course, most famously reticent on the matter in on the origin of species, noting himself in 1871 that his only mention of human origins had been one single throwaway comment, in his concluding section: “light will be thrown on the origin of man and his history” [27].
This has, of course, to rank among the most epic understatements ever. And of course, it begged the question, “what light?” But in the event, Darwin proved highly resistant to following up on this question. This is true even of his 1871 book The Descent of Man, and Selection in Relation to Sex in which Darwin finally forced himself to confront the implications of his theory for the origin of humankind, and the main title of which is in many ways something of a teaser.”
Charles Darwin was a very sick man then. He was bitten by an insect while on an island during his magnificent ship journey causing him a serious reoccurring illness. This sounds like a mosquito bite infecting him with falciparum malaria which is a severe debilitating disease that an episode attack leaves him exhausted, and probably caused his death later. So, Darwin could not inter into debates defending his theory against such fraudulent nonsense of applying it to human natural selection and history that a man originates from a monkey. He knew better than that, but he was too weak and too ill to argue seeing it sufficient to say that light will be thrown on the issue later. It will cause his theory no harm whatsoever to remove it from association with such fraudulent science proved by a fake series of unrelated photographs fabricated into one figure (Figure 7). May God bless his soul.
Funds Received
None declared by the author.
Conflict of Interest
None declared by the author.
References
- Chop RM, Silva MC (1991) Scientific fraud: Definitions, policies, and implications for nursing research. J Prof Nurs 7: 166-1671.
- Slesser AA, Qureshi YA (2009) The implications of fraud in medical and scientific research. World J Surg 33: 2355-2359.
- Sculier JP (2013) Bad behaviors regarding research and scientific and medical publication. Rev Med Brux 34: 491-499.
- Ghanem AN (2021) Final affirmative proof Starling’s law wrong and G tube correct replacement: New results and critical analytical criticisms of landmark articles. Biomed J Sci & Tech Res 33: 26188-
- Ghanem AN (2020) The correct replacement for the wrong starling’s law is the hydrodynamic of the porous orifice (G) tube: The Complete physics and physiological evidence with clinical relevance and significance. Cardiology 5: 1-9.
- Ghanem AN (2020) Twenty-one reasons affirming Starling’s law on the capillary-Interstitial Fluid (ISF) transfer wrong and the correct replacement is the hydrodynamic of the porous orifice (G) tube. Case Rep Open A Open J 1: 8-11.
- Ghanem AN (2001) Magnetic field-like fluid circulation of a porous orifice tube and its relevance to the capillary-interstitial fluid circulation: Preliminary report. Med Hypotheses 56: 325-334.
- Ghanem KA, Ghanem AN (2017) The proof and reasons that Starling’s law for the capillary-interstitial fluid transfer is wrong, advancing the hydrodynamics of a porous orifice (G) tube as the real mechanism. Blood, Heart and Circ 1: 17.
- Ghanem KA, Ghanem AN (2017) The physiological proof that starling’s law for the capillary-interstitial fluid transfer is wrong: Advancing the porous orifice (G) tube phenomenon as replacement. Open Acc Res Anatomy 1: 000508.
- Ghanem AN, Ghanem KA (2020) Revised Starling’s Principle (RSP): A misnomer as Starling’s law is proved wrong. Med Res Chronicles.
- Ghanem AN (2020) “What is misleading physicians into giving too much fluid during resuscitation of shock and surgery that induces ARDS and/or AKI”? Asp Biomed Clin Case Rep 3: 90-98.
- Ghanem AN (2020) Twenty-one reasons affirming Starling’s law on the capillary-Interstitial Fluid (ISF) transfer wrong and the correct replacement is the hydrodynamic of the porous orifice (G) tube. Case Rep Open A Open J 1: 8-11.
- Rhodin JA (1967) The ultra-structure of mammalian arterioles and pre-capillary sphincters. J Ultrastructure Research 18: 181-223.
- Karnovesky MJ (1967) The ultra-structural basis of capillary permeability studied with peroxidase as a tracer. J Cell Biol 35: 213-236.
- Starling EH (1886) Factors involved in the causation of dropsy. Lancet 2: 1266-1270, 1330-1334, 1406-1410.
- Starling EH (1896) On the absorption of fluids from connective tissue spaces. J Physiol 19: 312-326.
- Pappenheimer JR, Soto-Rivera A (1948) Effective osmotic pressure of the plasma proteins and other quantities associated with the capillary circulation in the hind limbs of cats and dogs. Am J Physiol 152: 471-491.
- Guyton AC, Coleman TG (1968) “Regulation of interstitial fluidvolume and pressure”. Ann N Y Acad Sci 150: 537-547.
- Ghanem AN (2021) The tree branching law: Correcting misconceptions on capillary cross-section areas and blood speed. International Journal of Science and Research (IJSR) 10: 1409-1418.
- Rivers E, Nguyen B, Havstad S, Ressler J, Muzzin A, et al. (2001) Early goal-directed therapy in the treatment of severe sepsis and septic shock. N Engl J Med 345: 1368-1377.
- Rivers EP, Katranji M, Jaehne KA, Brown S, Dagher GA, et al. (2012) Early interventions in severe sepsis and septic shock: A review of the evidence one decade later. Minerva Anestesiol 78: 712-724.
- Rowan KM (2017) PRISM investigators “early, goal-directed therapy for septic shock-a patient-level meta-analysis”. New England Journal of Medicine 376: 2223-2234.
- The ProCESS/ARISE/ProMISe Methodology Writing Committee (2013) “Harmonizing international trials of early goal-directed resuscitation for severe sepsis and septic shock: Methodology of ProCESS, ARISE, and ProMISe”. Intensive Care Medicine 39: 1760-1775.
- Ashbaugh DG (1967) “Acute respiratory distress in adults”. Lancet 2: 319-323.
- Grubb S, Cai C, Hald BO, Khennouf L, Murmu RP, et al. (2020) Precapillary sphincters maintain perfusion in the cerebral cortex. Nat Commun 11: 395.
- Ghanem AN (2020) Volumetric overload shocks cause the acute respiratory distress syndrome: Building the bridge between physics, physiology, biochemistry, and medicine. Biomed J Sci & Tech Res 29: 22197-
- Tattersall I (2009) Charles Darwin and human evolution. Evolution: Education and Outreach 2: 28-34.
Citation: Ghanem ANM (2021) Scientific Fraud Not Due to Fraudulent Research in Science. Archiv Surg S Educ 3: 035.
Copyright: © 2021 Ahmed Nasr M Ghanem, et al. This is an open-access article distributed under the terms of the Creative Commons Attribution License, which permits unrestricted use, distribution, and reproduction in any medium, provided the original author and source are credited.