Sensory Processing/Integration Dysfunction Affects Functional Mobility of Children with Cerebral Palsy
*Corresponding Author(s):
Durga Prasad MishraNational Institute Of Rehabilitation Training And Research, Utkal University, Cuttack, India
Tel:+91 9040636376,
Email:dpmmot@gmail.com
Abstract
Purpose
The purpose of this study was to investigate the relationship between sensory processing abilities and functional mobility and how sensory integration dysfunction affects mobility pattern in children with cerebral palsy.
Materials/Methods
50 children with CP participated in the study. Sensory processing abilities of the subject were measured by Short Sensory Profile (SSP). Functional Mobility were measured using Gross Motor Functional Classification System-Expanded and Revised (GMFCS-ER). Then the data are analyzed to know the relationship between level of SID and functional mobility pattern of Children with CP.
Results
There were significance co-relations between SSP score and GMFCS-ER level (R = 0.74, p ? 0.00). Significant differences were showed in functional mobility level (p = 0.01) among sensory processing level of children. Also result was showed that as GMFCS-ER level were higher, the SSP total Score was higher (indicating less SI dysfunction) all of participant.
Conclusion/Significance
Sensory processing abilities of children with cerebral palsy were related with functional mobility. More SID indicates lesser capabilities on functional mobility.
Keywords
Cerebral palsy; Functional mobility; Gross Motor Functional Classification System-Expanded and Revised (GMFCS-ER); Sensory processing/Integration dysfunction; Short Sensory Profile (SSP)
INTRODUCTION
Cerebral Palsy (CP), a permanent, non-progressive, but not necessarily unchanging neurological disorder of childhood [1], caused by brain injury during the immature period of brain development [2], which affects motor and postural development and causes sensory disorders and learning disabilities [1]. In particular, motor problems caused by CP affect functional mobility. The primary problem in CP is gross motor dysfunction [3]. Gross motor function refers to body alignment and postural control against gravity in a given context. Fine motor manipulation function is an index that assesses the harmony of hand and upper limb function when a child performs functional activities in daily living [4]. Thus most rehabilitation programmers and interventions are focused on motor skills [5,6]. However according to previous studies, children with CP have sensory processing issues as well as motor problems, which lead to severe developmental disability [7,8]. CP sufferers with sensory modulation problems, poor sensory registration and sensory discrimination deficits show delay issues regarding level of arousal, attention, motivation, behavioral organization and action planning, which also affects motor functions [9,10]. About 90 % of children with CP present with sensory dysfunction such as tactile and proprioceptive deficits [11]. The impaired central nervous system in CP produces not only abnormal muscle tone but also sensory disturbances [11].
CP involves a deficit of the central nervous system that causes both sensory processing difficulties and motor problems [12,13]. CP limits the variety of experience that passes through sensory input as it causes asymmetrical posture, abnormal movement and loss of postural control. These restrictions build up an improper proprioceptive sense and further incorrect movement feedback. These outcomes limit the motor planning and learning of children with cerebral palsy [14].
Thus, sensory processing skills and motor skills are relatively important for functional performance in daily tasks and participation [15], which requires functional mobility. Therefore, this study investigated the co-relation between sensory processing abilities and functional mobility capabilities of children with cerebral palsy.
METHODS
Hypothesis
Null Hypothesis (H0): There is no relationship between Sensory integration dysfunction to the functional mobility pattern of children with CP.
Alternative Hypothesis (H1): There exists a relationship between Sensory integration dysfunction to the functional mobility pattern of children with CP.
Aim
To investigate the relationship of co-morbid dysfunction of sensory integration on motor skills & functional mobility of children with cerebral palsy.
Sample size & sampling methods
The study was conducted with 50 children having diagnosis of CP, who were attending the department of occupational therapy at SVNIRTAR. Informed consent was taken from all the participants. Consecutive sampling was used. This was a double blind observational study design. The study was conducted between August 2019 to October 2019.
Selection Criteria
Inclusion criteria:
• Children diagnosed as cerebral palsy.
• Children of age group 4-10 yrs.
Exclusion criteria:
• Child having congenital anomaly
• Child having other associated chronic medical condition
• Child diagnoses with intellectual Disability
• Child with under medication of psychostimulants
• Child having epilepsy
Measurement tools
The Short Sensory Profile (SSP) was used to measure children’s sensory processing ability [16]. The items measured were tactile sensitivity, taste/smell sensitivity, movement sensitivity, under-responsive/seeks sensations, auditory filtering, low energy/weak and visual/auditory sensation [14]. These items include functional behavior in daily activities that are symptoms of sensory processing disorders. Each item is measured on a five-point Likert scale. A total score of 155 to 190 points is normal, 142 to 154 points is a probable difference and 38 to 141 points is a definite difference in sensory processing [16,17]. The normal level corresponds to typical sensory processing abilities, while the probable difference and definite difference levels correspond to atypical sensory processing abilities. Higher scores indicate better sensory processing abilities.
The gross motor skills of children were measured using the Gross Motor Function Classification System-Expanded and Revised (GMFCS-ER). The GMFCS-ER classifies a child's movement ability into five levels: Level I is walks without restrictions; level II is walks without restrictions, but with limitations walking outdoors and in the community; level III is walks with assistive mobility devices, but with limitations walking outdoors and in community; level IV is self-mobility with limitation; and level V is self-mobility that is severely limited, even with the use of assistive technology [18,19]. Higher level indicates better capabilities.
DATA ANALYSIS
To find out the relationship between child’s sensory integration dysfunction (SSP scores) and their functional mobility pattern (GMFCS-ER Level), who has been diagnosed with CP, Spearman’s coefficient was done and a scatter plot was used to display the relationship.
To analyze data on the difference between the GMFCS-ER levels on sensory processing total score, a one-way Analysis of Variance (ANOVA) was used and post-hoc test was applied by Scheffe’s method. The data was analyzed using Statistical Package for Social Sciences (SPSS) version 20 and significant value was set at P < 0.05.
RESULTS
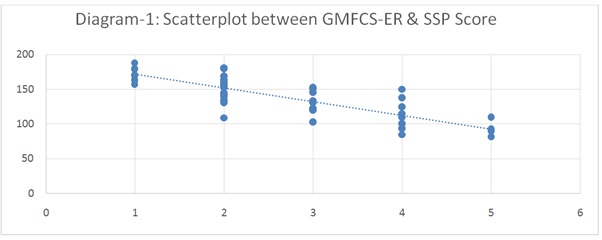
We found a strong correlation between SSP Scores and GMFCS-ER level as r = -0.74 (Spearman’s correlation coefficient) which is significant at P = 0.01. As the ‘r’ value is negative which indicate children having more sensory processing dysfunction have less functional mobility?
Correlations
|
|
SSP |
GMFCS-ER |
||
|
Spearman’s rho |
SSP |
correlation coefficient |
1.000 |
-.742** |
|
Sig. (1-tailed) |
. |
.000 |
||
|
N |
50 |
50 |
||
|
GMFCS-ER |
correlation coefficient |
-.742** |
1.000 |
|
|
Sig. (1-tailed) |
.000 |
. |
||
|
N |
50 |
50 |
||
**Correlation is significant at the 0.01 level (1-tailed).
In scatter plot (Diagram-1), higher SSP scores (Better sensory processing abilities) reflects better functional mobility (Higher GMFCS-ER level). This indicates there is a relationship exists between SSP Score and GMFCS-ER level.
There were significant differences in total sensory processing score according to GMFCS-ER level for all participants (Table 1). Significant difference at p = 0.00. One-way ANOVA was used to identify mean difference.
|
ANOVA SSP |
|||||
|
|
Sum of Squares |
Df |
Mean Square |
F |
Sig. |
|
Between Groups |
28699.143 |
4 |
7174.786 |
26.305 |
.000 |
|
Within Groups |
12273.837 |
45 |
272.752 |
|
|
|
Total |
40972.980 |
49 |
|
|
|
Table 1: One-way ANOVA showing significant difference at p = 0.00.
Descriptive statistics (Table 2) show difference of SSP total score among GMFCS-ER levels. Higher the mean difference in SSP score i.e. less SI dysfunction; higher the GMFCS-ER level i.e. better functional mobility.
|
Descriptives SSP |
||||||||
|
|
N |
Mean |
Std. Deviation |
Std. Error |
95 % Confidence Interval for Mean |
Minimum |
Maximum |
|
|
Lower Bound |
Upper Bound |
|||||||
|
1.00 |
8 |
171.5000 |
10.29563 |
3.64005 |
162.8926 |
180.1074 |
157.00 |
188.00 |
|
2.00 |
19 |
152.5263 |
17.19938 |
3.94581 |
144.2365 |
160.8162 |
109.00 |
181.00 |
|
3.00 |
10 |
130.4000 |
15.86190 |
5.01597 |
119.0531 |
141.7469 |
103.00 |
153.00 |
|
4.00 |
8 |
114.7500 |
22.08911 |
7.80968 |
96.2830 |
133.2170 |
85.00 |
150.00 |
|
5.00 |
5 |
91.4000 |
11.48042 |
5.13420 |
77.1452 |
105.6548 |
82.00 |
110.00 |
|
Total |
50 |
138.9800 |
28.91683 |
4.08946 |
130.7619 |
147.1981 |
82.00 |
188.00 |
Table 2: Difference of SSP total score among GMFCS-ER.
Following post hoc tests, significant mean differences of sensory processing ability among GMFCS-ER level were found as follows: GMFCS level 5~1 > 5~2 > 4 ~1 > 3~1 > 5~4 > 4~2 > 3~2 (Table 3). This indicates that GMFCS-ER level affects SSP total score of all children.
|
Multiple Comparisons |
||||||
|
(I) gmfcs |
(J) gmfcs |
Mean Difference (I-J) |
Std. Error |
Sig. |
95 % Confidence Interval |
|
|
Lower Bound |
Upper Bound |
|||||
|
1.00 |
2.00 |
18.97368 |
6.96056 |
.135 |
-3.3815 |
41.3288 |
|
3.00 |
41.10000* |
7.83385 |
.000 |
15.9401 |
66.2599 |
|
|
4.00 |
56.75000* |
8.25760 |
.000 |
30.2291 |
83.2709 |
|
|
5.00 |
80.10000* |
9.41511 |
.000 |
49.8616 |
110.3384 |
|
|
2.00 |
1.00 |
-18.97368 |
6.96056 |
.135 |
-41.3288 |
3.3815 |
|
3.00 |
22.12632* |
6.45217 |
.030 |
1.4039 |
42.8487 |
|
|
4.00 |
37.77632* |
6.96056 |
.000 |
15.4212 |
60.1315 |
|
|
5.00 |
61.12632* |
8.30095 |
.000 |
34.4662 |
87.7864 |
|
|
3.00 |
1.00 |
-41.10000* |
7.83385 |
.000 |
-66.2599 |
-15.9401 |
|
2.00 |
-22.12632* |
6.45217 |
.030 |
-42.8487 |
-1.4039 |
|
|
4.00 |
15.65000 |
7.83385 |
.419 |
-9.5099 |
40.8099 |
|
|
5.00 |
39.00000* |
9.04575 |
.003 |
9.9479 |
68.0521 |
|
|
4.00 |
1.00 |
-56.75000* |
8.25760 |
.000 |
-83.2709 |
-30.2291 |
|
2.00 |
-37.77632* |
6.96056 |
.000 |
-60.1315 |
-15.4212 |
|
|
3.00 |
-15.65000 |
7.83385 |
.419 |
-40.8099 |
9.5099 |
|
|
5.00 |
23.35000 |
9.41511 |
.207 |
-6.8884 |
53.5884 |
|
|
5.00 |
1.00 |
-80.10000* |
9.41511 |
.000 |
-110.3384 |
-49.8616 |
|
2.00 |
-61.12632* |
8.30095 |
.000 |
-87.7864 |
-34.4662 |
|
|
3.00 |
-39.00000* |
9.04575 |
.003 |
-68.0521 |
-9.9479 |
|
|
4.00 |
-23.35000 |
9.41511 |
.207 |
-53.5884 |
6.8884 |
|
|
* Post hoc test used Scheffe method and the mean difference is significant at the 0.05 level. |
||||||
Table 3: Post-hoc test results of GMFCS-ER at each level of SSP total score.
DISCUSSION
Children with CP have functional difficulties in performance during daily living not only because of abnormal postural tone and poor postural control, but also because of sensory processing problems [20,21]. In particular, sensory processing problems affect the child’s adaptability to daily activities, mood, emotion and motor function [9,22]. Children with CP have primary sensory disorders such as tactile or proprioceptive discrimination [23,24]. This problem mainly affects the fine motor manipulation skill in CP [25]. According to previous studies sensory processing problems in children induce developmental issues such as low or high postural tone, deficits of balance and motor coordination, unstable posture and/or clumsy movement. In CP, symptoms of sensory integration disorders are more prevalent [9,26].
In this study, we found that there was a relationship exists between SSP Score and GMFCS-ER level and there were significant differences between functional performance levels and sensory processing levels in children. The results of post hoc testing showed that GMFCS levels 5 and 1showed the most significantly mean difference in SSP total score. This means that sensory processing abilities are different for children with severe limitations in self-mobility versus those capable of independent walking without restrictions.
LIMITATION AND FUTURE RECOMMENDATION
• Sample size was small, thus it is difficult to generalize the findings. Future study should involve more number of children
• Effects of sensory processing abilities on fine motor skills, cognition, etc. were not taken into consideration in this study & this can be explored in future research
• Types of CP can be considered in future study
• Here short sensory profile is used & in future study long form of sensory profile can be used
CONCLUSION
This study was performed to investigate the impact of sensory processing/integration dysfunction on functional mobility in children with cerebral palsy. The result showed that there exists a significant relationship between sensory processing abilities, functional performance capabilities in children with cerebral palsy. Also, the result showed that higher the sensory processing abilities i.e. less SI dysfunction; higher the GMFCS-ER level i.e. better functional mobility pattern i.e. co-morbid sensory integration dysfunction affects negatively to functional mobility. The result has clinical meaning. Thus if sensory integration dysfunction is managed through proper methods of sensory integration therapy, functional mobility can be enhanced.
ACKNOWLEDGEMENT
We are thankful to the Director of SVNIRTAR for providing the opportunity to complete this study successfully by making the department facilities available at ease.
We express our special thanks to Mr. Rama Kumar Sahu, Senior Occupational Therapist-cum Junior Lecturer at Dept. of Occupational Therapy, SVNIRTAR for their valuable advice on statistical analysis.
We offer our deepest gratitude to the parents of the clients, who willingly enrolled their children for the study and rendered good cooperation in promptly attending the intervention sessions throughout the course of data collection.
We are grateful to all the children who participated in the study.
Lastly, we take immense pleasure in thanking our Parents, Friends, Family members and colleagues for all their support at all stages of this work.
REFERENCES
- Bobath K, Bobath B (1964) The facilitation of normal postural reactions and movements in the treatment of cerebral palsy. Physiotherapy 50: 246-262.
- Campbell SK (1984) Pediatric neurologic physical therapy (5th edn). Churchill Livingstone. USA.
- Rosenbloom L (1983) Early diagnosis and therapy in cerebral palsy: A primer on infant developmental problems. Arch Dis Child 58: 757.
- Hutton JL, Pharoah PO (2006) Life expectancy in severe cerebral palsy. Arch Dis Child 91: 254-258.
- Anttila H, Autti-Rämö I, Suoranta J, Mäkelä M, Malmivaara A. (2008) Effectiveness of physical therapy interventions for children with cerebral palsy: A systematic review. BMC Pediatr 8: 14.
- Carlberg EB, Hadders-Algra M (2005) Postural dysfunction in children with cerebral palsy: Some implications for therapeutic guidance. Neural Plast 12: 221-228.
- Ahn RR, Miller LJ, Milberger S, McIntosh DN (2004) Prevalence of parents’ perceptions of sensory processing disorders among kindergarten children. Am J Occup Ther 58: 287-293.
- Choi YC, Park SJ, Lee MH, Kim JS (2013) The effects of trunk muscle strengthening exercises on balance performance of sitting posture and upper extremity function of children with spastic diplegic cerebral palsy. J Korean Soc Phys Med 8: 117-125.
- Ayres AJ, Tickle LS (1980) Hyper-responsivity to touch and vestibular stimuli as a predictor of positive response to sensory integration procedures by autistic children. Am J Occup Ther 34: 375-381.
- Beckung E, Hagberg (2002) Neuroimpairments, activity limitations, and participation restrictions in children with cerebral palsy. Dev Med Child Neurol 44: 309-316.
- Cooper J, Majnemer A, Rosenblatt B, Birnbaum R (1995) The determination of sensory deficits in children with hemiplegic cerebral palsy. J Child Neurol 10: 300-309.
- Gordon AM, Duff SV (1999) Relation between clinical measures and fine manipulative control in children with hemiplegic cerebral palsy. Dev Med Child Neurol 41: 586-591.
- Hosseini SA, Ghoochani BZ, Talebian S, Pishyare E, Haghgoo HA, et al. (2015) Investigating the effects of vestibular stimulation on balance performance in children with cerebral palsy: A randomized clinical trial study. JRSR 2: 41-46.
- McIntosh D, Miller L, Shyu V (1999) Overview of the Short Sensory Profile (SSP). The sensory profile: Examiner’s manual.
- Polatajko HJ, Law M, Miller J, Schaffer R, Macnab J (1991) The effect of a sensory integration program on academic achievement, motor performance, and self-esteem in children identified as learning disabled: Results of a clinical trial. OTJR 11: 155-176.
- Dunn W (1999) Sensory profile: User's manual. Psychological Corporation, Texas, USA.
- Lesný I, StehliAk A, TomásCek J, Tománková A, Havlícek I (1993) Sensory disorders in cerebral palsy: Two-point discrimination. Dev Med Child Neurol 35: 402-405.
- Gunel MK, Mutlu A, Tarsuslu T, Livanelioglu A (2009) Relationship among the Manual Ability Classification System (MACS), the Gross Motor Function Classification System (GMFCS), and the functional status (WeeFIM) in children with spastic cerebral palsy. Eur J Pediatr 168: 477-485.
- Morris C, Bartlett D (2004) Gross motor function classification system: Impact and utility. Dev Med Child Neurol 46: 60-65.
- Blanche EI, Botticelli TM, Hallway MK (1995) Combining neurodevelopmental treatment and sensory integration principles: An approach to pediatric therapy. Therapy Skill Builders, USA.
- Ko MS, Chung JH, Jeon HS (2010) Correlation between Pediatric Balance Scale(PBS) and Gross Motor Function Measurement(GMFM) scores in children with cerebral palsy. J Korean Soc Phys Med 50: 281-288.
- Papavasiliou AS (2009) Management of motor problems in cerebral palsy: A critical update for the clinician. Eur J Paediatr Neurol 13: 387-396.
- Nashner L, Shumway-Cook A, Marin O (1983) Stance posture control in select groups of children with cerebral palsy: Deficits in sensory organization and muscular coordination. Exp Brain Res 49: 393-409.
- Wingert JR, Burton H, Sinclair RJ, Brunstrom JE, Damiano DL (2008) Tactile sensory abilities in cerebral palsy: Deficits in roughness and object discrimination. Dev Med Child Neurol 50: 832-838.
- Levitt S (2010) Treatment of cerebral palsy and motor delay. John Wiley & Sons, Hoboken, USA.
- Lee EJ, Song JM (2010) Changes in the gross motor function, self-esteem and social ability of children with spastic diplegia from group exercise: Case study. J Korean Soc Phys Med 5: 645-654.
Citation: Mishra DP, Mishra G, Das SP, Senapati A, Mohakud K (2020) Sensory Processing/Integration Dysfunction Affects Functional Mobility of Children with Cerebral Palsy. J Neonatol Clin Pediatr 7: 043.
Copyright: © 2020 Durga Prasad Mishra, et al. This is an open-access article distributed under the terms of the Creative Commons Attribution License, which permits unrestricted use, distribution, and reproduction in any medium, provided the original author and source are credited.