Skin Pigmentation Diversity in Central East Indian Populations and its Correlation with Mitochondrial Haplogroups
*Corresponding Author(s):
Sheikh NizamuddinCentre For Cellular And Molecular Biology, CSIR-Centre For Cellular And Molecular Biology, Hyderabad, India
Tel:+82 515102259,
Email:snizam001@gmail.com
Anshuman Mishra
Centre For Cellular And Molecular Biology, Phenome Research Foundation, Banaras Hindu University, Busan, Republic Of Korea
Tel:+82 515102259,
Abstract
India is well known for its cultural, social, ecological and genetic diversity in South Asia. Uttar Pradesh and Bihar states were one of oldest population habitat in central east region of India. In the present study, we explored pigmentation (melanin index) diversity of 6872.649 km2 and 2736.333 km2 regions of Uttar Pradesh and Bihar states of India respectively. We found high pigmentation diversity and wide presence of major mitochondrial haplogroups in small region of Indian subcontinent, which might be true for all geographical region of South-Asia. Further, we correlated the melanin index with social status (General (GN), Other Backward Classes (OBC) and Scheduled Castes (SC)) and mitochondrial haplogroups. The melanin index is marginally different between OBC and SC (p = 0.0142) while significantly different from GN vs OBC (p = 3.33 × 10⁻¹²) and GN vs SC (p < 2 × 10-16). We did not observe any significant differences between melanin index of one haplogroup against another haplogroup; (a) M vs U, p = 0.0845, (b) M vs R, p = 0.895, (c) M vs L, p = 0.513, (d) U vs R, p = 0.258, (e) U vs L, p = 0.635 and (f) R vs L, p = 0.613. Our study reveals that cast populations of central east India, represent significantly different melanin index and diverse mitochondrial haplogroup. Our study signifies that mitochondrial haplogroups, do not have any genetic influence on melanin index. However, further study on larger cohort, will elucidate, more about diversity and pigmentation relation in India.
Keywords
INTRODUCTION
Indian subcontinent represents 1/6 of total world population. India is well known for its cultural, social and ecological diversity. It is also one of the most genetically diverse geographical regions, which consists of 4,635 anthropologically well-defined groups, who were following endogamy marriage practices from thousands of years [1-3].
Geographical regions of India, Sri Lanka, Myanmar, Bangladesh, Bhutan, Nepal, Tibet (China), Afghanistan and Pakistan constitute together the Indian subcontinent regions. Indian subcontinent also referred as South Asian region and encompasses the highest genetic diversity after Africa. This is because, during the out of Africa migration of Homo sapiens, the Indian subcontinent has acted as an incubator for populations, who then spread and colonized the world [1-3]. Being the central of these countries, India is considered as a major corridor for the dispersal of modern human [1-3]. It has been studied that Indian populations largely constitute the same gene pool [2-5].
In population genetic studies, we study several populations based on their genetic characteristics. Here we study the DNA marker based on mitochondrial Hyper Variable Region (HVR). We study mitochondrial markers to find out genetic diversity and evolutionary process among populations [6]. Indian population is complex in terms of diversity of languages affiliation, ancestry and various other phenotype parameters [1,2]. Human genetics and environment plays together for shaping skin pigmentation variations. Whatever huge pigmentation variation we observed across the world, is largely shaped by different levels of UV radiations [7]. Pigmentation studies were helpful in understanding the evolutionary processes. Study shows that role of melanin is very important in pigmentation variation, where it is performing dual role and make delicate balance between the skin being light enough at low UVR zones (to allow sufficient production of vitamin D) and dark enough at high UVR zones (for protection against sun burn and degradation of folate) [8-10]. Any imbalance between these dual procedures would have wide-range of effects on human health (reproductive fitness, skin cancer, anaemia, fetal abnormalities, spermatogenesis, rickets and vitamin D deficiency) [9].
There were several pigmentation studies revealing association with pigmentation candidate gene in South Asia and they have approved the act of natural selection process of human populations [7-12]. Previous report, observed the significant association with rs1426654, with skin pigmentation in populations living specifically in India [8]. Recent study on same region (middle gangetic regions of central east part of India) had well established the association with pigmentation diversity and the populations [13,14]. The central east region of India is one of the most fertile and densely populated regions (http://www.censusindia.gov.in). This region represents more than hundreds ethnic groups and considered as a one of the oldest continuously inhabited places in the world [15]. The central east populations were living in one of the oldest and continuously habituated regions of India. These populations further explore and spread to various parts of India. Traditionally these populations were divided into various casts depending on old Hindu mythology. Religiously Muslim populations were also present dominantly in same region. Various subjects were categorized based on their specific cast and described as cast populations due to presence of endogamy pattern. Cast populations were also based on traditional Indian system of “work based population groups” or more specifically “Chaturvarna”, which included Brahmins (practices teaching and religious rites), Kshatriyas (warriors or defendants), Vaishyas (traders, artisans) and Shudras (smaller activities). Further these casts were divided among sub casts or region specific population groups and identified by their surnames or gotras (ancestor name). They maintain their unique socio-cultural identity due to strict endogamy, specific rituals and marriage practices, which provide genetic differentiation due to isolation or specific environment due to passage of time. Additionally, regional and social effect also play key role in shaping regional sub cast populations, which makes ultimately cast system more complicated. Currently, various cast populations were further politically divided in to General (GN), Other Backward Classes (OBC), Scheduled Castes (SC) and Scheduled Tribes (ST). This division was according to socioeconomic status of various casts of the society by the Constitution of India. In the present study, we have analyzed the data based on above broad category, which gives general implication of social cast system of India. Since, evolutionary background of many populations is still not clear so, we have discussed in brief about evolutionary background of some important populations based on their phenotype and mtDNA study. It was interesting to observe highly diverse skin pigmentation and wide presence of major Mitochondrial haplogroups (MT-haplogroup) in central east populations. In the present study, we want to, explore the relation of pigmentation and genetic diversity of central-east Indian cast populations.
MATERIALS AND METHODS
Sample details and their phenotype data collection
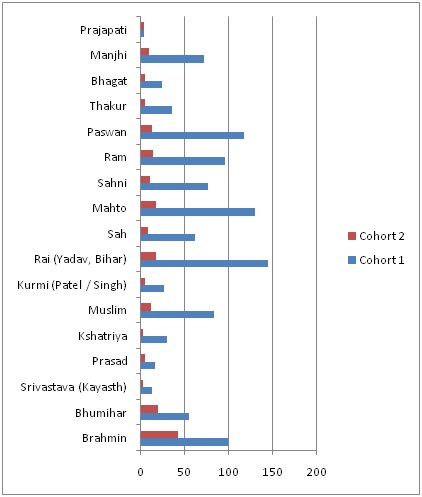
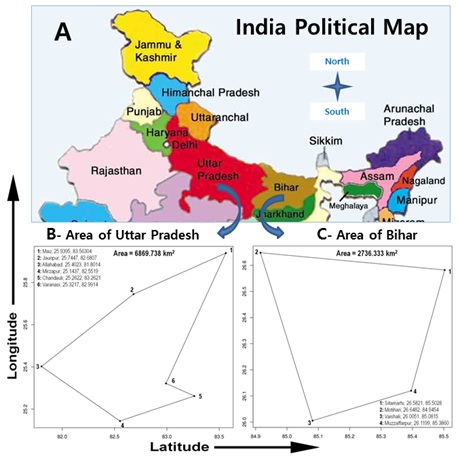
Figure 2: Geographical region of study in Indian region. Total 1078 subject of17 populations were used for study (http://wiienvis.nic.in).
B-Central-east Indian region highlited with area covered in Uttar Pradesh state for Genotype-phenotype study also referred as cohort 2.
| Population | Study database | Subjects | References |
| Cohort 1 | Phenotype | 1078 | [13,14] |
| Cohort 2 | Phenotype-genotype | 184 | This study |
| S. No. | Population | State | Sample size | Average MI | Std dev. | Social category |
| 1 | Brahmin | Uttar Pradesh and Bihar | 99 | 47.997 | (+/-) 7.882 | General |
| 2 | Bhumihar | Uttar Pradesh and Bihar | 54 | 46.45185 | (+/-) 5.104557 | General |
| 3 | Srivastava (Kayasth) | Uttar Pradesh | 13 | 48.23077 | (+/-) 6.678714 | General |
| 4 | Prasad | Bihar | 16 | 57.42188 | (+/-) 9.551771 | Other Backward Class |
| 5 | Kshatriya | Uttar Pradesh and Bihar | 30 | 51.35833 | (+/-) 8.296126 | General |
| 6 | Muslim | Bihar | 83 | 58.38916 | (+/-) 8.3316 | Religion |
| 7 | Kurmi (Patel / Singh) | Uttar Pradesh | 26 | 57.62692 | (+/-) 8.626937 | Other Backward Class |
| 8 | Rai (Yadav, Bihar) | Bihar | 144 | 59.3814 | (+/-) 9.8346 | Other Backward Class |
| 9 | Sah | Bihar | 61 | 61.31148 | (+/-) 9.770941 | Other Backward Class |
| 10 | Mahto | Bihar | 130 | 62.35577 | (+/-) 10.07836 | Other Backward Class |
| 11 | Sahni | Bihar | 76 | 63.14276 | (+/-) 8.407975 | Schedule Caste |
| 12 | Ram | Bihar | 95 | 63.34737 | (+/-) 9.799078 | Schedule Caste |
| 13 | Paswan | Bihar | 117 | 63.7641 | (+/-) 9.777141 | Schedule Caste |
| 14 | Thakur | Bihar | 35 | 64.20455 | (+/-) 8.506986 | Other Backward Class |
| 15 | Bhagat | Bihar | 24 | 66.75417 | (+/-) 10.2636 | Other Backward Class |
| 16 | Manjhi | Bihar | 72 | 70.83403 | (+/-) 8.126759 | Schedule Caste |
| 17 | Prajapati | Uttar Pradesh | 3 | 49 | (+/-) 1.5 | Other Backward Class |
| S. No. | Population | State | Sample size | Social category |
| 1 | Brahmin | Uttar Pradesh and Bihar | 42 | General |
| 2 | Bhumihar | Uttar Pradesh and Bihar | 19 | General |
| 3 | Srivastava (Kayasth) | Uttar Pradesh | 2 | General |
| 4 | Prasad | Bihar | 4 | Other Backward Class |
| 5 | Kshatriya | Uttar Pradesh and Bihar | 2 | General |
| 6 | Muslim | Bihar | 11 | Religion |
| 7 | Kurmi (Patel / Singh) | Uttar Pradesh | 4 | Other Backward Class |
| 8 | Rai (Yadav, Bihar) | Bihar | 17 | Other Backward Class |
| 9 | Sah | Bihar | 8 | Other Backward Class |
| 10 | Mahto | Bihar | 17 | Other Backward Class |
| 11 | Sahni | Bihar | 10 | Schedule Caste |
| 12 | Ram | Bihar | 14 | Schedule Caste |
| 13 | Paswan | Bihar | 13 | Schedule Caste |
| 14 | Thakur | Bihar | 4 | Other Backward Class |
| 15 | Bhagat | Bihar | 5 | Other Backward Class |
| 16 | Manjhi | Bihar | 9 | Schedule Caste |
| 17 | Prajapati | Uttar Pradesh | 3 | Other Backward Class |
| Primer Name | Forward Primer | Reverse Primer |
| Mito 23rd | TCATTGGACAAGTAGCATCC | GAGTGGTTAATAGGGTGATAG |
| Mito 22nd | TGAAACTTCGGCTCACTCCT | AGCTTTGGGTGCTAATGGTG |
| Mito 18th | TATCACTCTCCTACTTACAG | AGAAGGATATAATTCCTACG |
| Mito 15th | TCTCCATCTATTGATGAGGGTCT | AATTAGGCTGTGGGTGGTTG |
Table 2: Details of the primer utilized for non-coding mitochondrial region amplification in the present study.
| Steps | Denaturation | 35 Cycles | Final | Hold | ||
| Final | Annealing | Extension | Extension | |||
| Denaturation | ||||||
| Temperature (?C) | 95 | 95 | 58 | 72 | 72 | 4 |
| Time (minutes) | 5:00 | 1:00 | 0:30 | 2:00 | 7:00 | 10:00 |
| Steps | Denaturation | 35 Cycles | Final | Hold | ||
| Final | Annealing | Extension | Extension | |||
| Denaturation | ||||||
| Temperature (?C) | 95 | 95 | 58 | 72 | 72 | 4 |
| Time (minutes) | 5:00 | 1:00 | 0:30 | 2:00 | 7:00 | 10:00 |
Table 3: Details of the PCR conditions used for mitochondrial study.
RESULTS AND DISCUSSION
Diversity of skin pigmentation
We also observed significant differences of MeI in social status of subjects (Figure 3). We observed GN caste is having more light skin in comparison to OBC and SC. The MeI is marginally different to OBC and SC (p = 0.0142) while significantly different to GN vs OBC (p = 3.33×10⁻¹²) and GN vs SC (p -16).
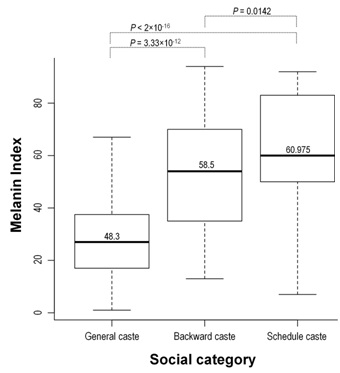
Figure 3: Box plot to represent the distribution of melanin index in different social categories of Central East Indian cast populations in cohort 1. Total 1078 subjects of 17 populations were used for study.
The social structure of the Indian population is governed by the hierarchical caste system. Indian population structure belongs to Hindu religious fold and is arranged in the form of main caste classes viz. Brahmins, Kshatriya, Vyasa and Shudra. Indian society is known to have affected by the multiple waves of migration which was reflected on amalgamation of migrant populations with the local population groups [2-5,16-18]. Presence of M haplogroup (66%) in majority of central east populations highlighted the interrelation of various genetically distinct populations from east Africa to East Asia, through Indian corridor.
The Indo-European speakers constitute the third potential source of Indian gene pool [3,5]. However the European specific haplogroups (T and U) were only ~16% in our populations.
In Indian population we hypothesize that there will be gradual decrease in % of European specific haplogroups from north to south, further research on Indian population may clear the real facts. More recently, a high profile genetic study analyzed 560,123 SNPs among 132 individuals derived from a diverse 25 ethnic Indian populations using the similar approach and identified two major ancestral populations i.e., ASI (Ancestral South Indian) and ANI (Ancestral North Indian) [1]. The ancestry of both of the components in other Indian populations varies between 39-71% [1]. Various research findings and importance based on mitochondrial DNA analysis was given in Box. Our earlier study reveals that social categories in India have significantly different Melanin Index which variate from population to population, although these populations were living together in same geographical regions, but show phenotype similarity with dark skin like African to fair skin like European [13,14]. Additional studies, in another region of India have also found pigmentation variation [19]. There may be several known or unknown regions for this phenotype diversity, but one possible region might be the endogamy practices in same population which contributing effectively for maintaining the above pigmentation diversity from long back. Our mitochondrial study shows, complex nature of each cast, due to presence of diverse MT-haplogroup in the region (Tables 4, 5 and Figure 4). Various cast shared the same haplogroup, which indicate that cast system is not on the basis of populations, but it is due to many other regions too. Additionally, mitochondrial study had not found the major influence on melanin index, which again highlighted the complex nature of the Indian cast system, which signify earlier facts, that caste system was not decided by phenotype or geneology, but it is on the basis of traditional reasons. Our study, break the link between maternal geneology and phenotype correlation through mitochondrial research. It should be noted that, instead of presence of endogamy in same populations, phenotype selections for current marriage practice also responsible to affects the modern population’s phenotype variations, further this can be seen in melanin index variation and their standard deviations data of the cohort 1 (up to 10 unit of MeI in various cast; Table 1B). Recent cast study on Indian population established that caste system is approximately ~ 2000-3000 old traditional methodologies [2].
| S. No. | Population | Sample Size | State | Social category | Haplogroups assigned | |||||||||
| 1 | Brahmin | 42 | Uttar Pradesh and Bihar | GN | M37 | M5a | L1c1a1 | L1c2a1a | L1c4 | M | M1 | A2a5 | L2b1a4 | T2e |
| M1a1b | M2a1 | M35b | M37 | M37e | M38d | M40a1 | M6a1a | M15 | M27a | |||||
| R30b1 | M7b1a1i | M7c1a1 | R31a | R6b | T | U | U5b2a2 | |||||||
| 2 | Bhumihar | 19 | Uttar Pradesh and Bihar | GN | G2a1c1 | L1c1a1 | M | M1 | M12b1a | M2a1 | M3 | M30 | ||
| M34a1 | M7b1a1i | M7c2 | T1a13 | M31a2 | ||||||||||
| 3 | Srivastava | 2 | Uttar Pradesh | GN | M1 | |||||||||
| 4 | Prasad | 4 | Bihar | OBC | L4a | M7c1a1 | ||||||||
| 5 | Kshatriya | 2 | Uttar Pradesh | GN | U5a2b2 | |||||||||
| 6 | Muslim | 11 | Bihar | RELIGION | H14 | L1c1b | L2 | M1 | M13b2 | M33d | M43 | M43b | M6a1a | M7b1a1i |
| 7 | Kurmi | 4 | Uttar Pradesh | OBC | M13 | U2a | ||||||||
| 8 | Yadav | 17 | Uttar Pradesh and Bihar | OBC | M2a1 | M5a | M30d | U2a | M35a | M3d1 | M77 | M7b1a1i | U7 | U6b1 |
| JT | M30c1 | |||||||||||||
| 9 | Sah | 8 | Bihar | OBC | L1c4a | M1 | M27a | M39a2 | M8a | |||||
| 10 | Mahto | 17 | Bihar | OBC | M1 | M1a1b | M21b2 | M28 | M3 | M3 | M38d | M5a | ||
| M5a | M5b2 | M7b1a1i | ||||||||||||
| 11 | Sahni | 10 | Bihar | SC | M1 | M23 | M33a1a | M6a1b | M7b1a1i | M8a2'3 | T1a | U | U2b | |
| 12 | Ram | 14 | Bihar | SC | G2a1e | M1 | M30c1 | M4 | M40 | U5a1 | M5a | T2 | U2b | R30a |
| 13 | Paswan | 13 | Bihar | SC | L2c2a | M1 | M35b | M36c | M7b1a1i | M7c1a1 | R30b1 | R30b1a | U2a1 | U2b |
| U5a1i | ||||||||||||||
| 14 | Thakur | 4 | Bihar | OBC | M3d1 | M7b1a1i | U2a | |||||||
| 15 | Bhagat | 5 | Bihar | OBC | M30c1a | M30d | U2a | |||||||
| 16 | Manjhi | 9 | Bihar | SC | L1c1a2 | L1c1d | M30c | R6 | U2a | U2b2 | U3a | |||
| 17 | Prajapati | 3 | Uttar Pradesh | OBC | L1c1d | R5a2 | ||||||||
Table 4: Genotype-phenotype database of central-east Indian cast populations also referred as cohort 2. Cast populations were defined in terms of average Melanin Index (MeI), social categories and geographical states of India. Total 184 subjects of 17 populations were used for study. (GN- General; OBC-Other Backward Class; SC-Schedule Cast).
| Major Haplo Group | Sample Size | Geographical Specific or Dominance | Central East Cast Populations |
| L | 14 | Africa (central and south) | Majhi, Paswan, Bhumihaar, Brahmin, Muslim, Sah, Prasad and Prajapati |
| M | 123 | Asia (east and south); Africa (east) | Ram, Paswan, Muslim, Sahni, Mahto, Prasad and Srivastava-Kayasth |
| Majhi, Bhumihaar, Brahmin, Yadav, Thakur and Sah | |||
| R | 11 | Asia (south) | Majhi, Brahmin, Ram, Prajapati and Paswan |
| T | 5 | Europe; Asia (central); Africa (north) | Majhi, Bhumihaar, Brahmin, Ram and Sahni, |
| U | 26 | Europe; Asia (north and central); Africa (north) | Majhi, Paswan, Ram, Thakur, Khatriya, Kurmi, Bhagat and Sahni |
Phenotype diversity, unlimited human migrations, existence of various endemic regions, foci of various infectious disease and diversified population makes the importance of this type of study in India [9,20]. The modern human habitations in central east regions were during Paleolithic times. Therefore, further explore to find out the ancient foot prints as well as the effect of local population selection of any disease or movement will be a great effort. Our study probably shed small light and indicates the primary signature of complex nature of Indian cast system by mitochondria-phenotype correlation study. The wide presence of various mitochondrial haplogroups commonly present in many cast populations indicates their early relations or admixture events. Caste system is considered as ~2000-3000 old phenomenons’s and still continues in terms of evolutionary events (endogamy and isolations) and social status [2]. Further, more sample size and big geographical area, required to conclude our finding more appropriately and revels more complex relations of various castes in India. More specifically, larger cohort will elucidate more about diversity and pigmentation in India.
CONCLUSION
In conclusion, we found high pigmentation and mitochondrial haplogroup diversity in central East Indian populations. Although, pigmentation is significantly different among social categories, we did not find any significant influence on major MT-haplogroup.
ACKNOWLEDGEMENT
Sheikh Nizamuddin was supported by ICMR-Senior Research fellowship program. Anshuman Mishra acknowledges the financial support of “DBT-RA program P90806” of Department of Biotechnology, India; UGC-SRF fellowship and contingency grant of BHU, India and “2016 Post-Doc. Development Program” of Pusan National University, South Korea. Study group acknowledges Rakesh Narayan Dubey (Prasad Intermediate College, Varanasi), Dhruva Narayan Dubey (Bhartiya Vidya Adhyan Kendra, Varanasi), Ashutosh Narayan Mishra (Bhopal) for all kind of help and arrangements. Special Thanks to Genome Foundation, Hyderabad for sequencing facility and Professor Martha Mizoran Lahr (University of Cambridge) for derma spectrophotometer instruments.
CONFLICT OF INTEREST
Authors declare no conflict of interest.
|
BOX: Key Facts about Mitochondrial Research The human, genome comprises nuclear genome and mitochondrial genome. During zygote formation, nuclear genome is contributed by a sperm cell and mitochondrial genome by the unfertilized egg cell (Figure 5). The mitochondrial genome is maternally inherited (circular double stranded molecule of ~16569 bases). Everyone carries more or less exact copy of the mtDNA. These mtDNA they get from their mother and their mother’s mother and so on, thus representing countless generations (maternal inheritance). We can trace any random mutation over the mtDNA, as these mutations are passed on intact to next generation; they were considered as “tracers of the subjects or family or populations”. Further details of mitochondrial research (genome structure, transcription, translation and replication) were well described by Jan-Willem Taanman [21]. In the past few years, the characterization and comparison of molecular signatures based on mtDNA have provided a substantial contribution to the understanding of human origins, their genetic relatedness and diffusion patterns [3,6,8,22,23]. Mitochondrial DNA surveys in worldwide populations have shown a continent-specific distribution of mtDNA lineages [6,22-26]. All Eurasian mtDNA lineages trace their ancestry to three maternal founder lineages M, N (R), suggesting their dispersal along the southern route in single wave after the exodus of modern humans from Africa [3,17,22-24,27]. The coalescence times of mtDNA haplogroups M, N and R are remarkably similar and ancient, ~65,000 years [17,18]. |
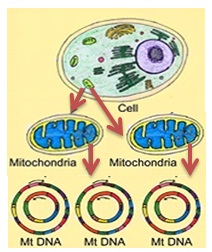
Figure 5: Schematic presentation of Mitochondria inheritance pattern in biological cell (source: dr.mishra@zmail.com).
REFERENCES
- Reich D, Thangaraj K, Patterson N, Price AL, Singh L (2009) Reconstructing Indian population history. Nature 461: 489-494.
- Moorjani P, Thangaraj K, Patterson N, Lipson M, Loh PR, et al. (2013) Genetic evidence for recent population mixture in India. Am J Hum Genet 93: 422-438.
- Metspalu M, Kivisild T, Metspalu E, Parik J, Hudjashov G, et al. (2004) Most of the extant mtDNA boundaries in south and southwest Asia were likely shaped during the initial settlement of Eurasia by anatomically modern humans. BMC Genet 5: 26.
- Cordaux R, Aunger R, Bentley G, Nasidze I, Sirajuddin SM, et al. (2004) Independent origins of Indian caste and tribal paternal lineages. Curr Biol 14: 231-235.
- Bamshad M, Kivisild T, Watkins WS, Dixon ME, Ricker CE, et al. (2001) Genetic evidence on the origins of Indian caste populations. Genome Res 11: 994-1004.
- Ingman M, Kaessmann H, Pääbo S, Gyllensten U (2000) Mitochondrial genome variation and the origin of modern humans. Nature 408: 708-713.
- Chaplin G (2004) Geographic distribution of environmental factors influencing human skin coloration. Am J Phys Anthropol 125: 292-302.
- Mallick CB, Iliescu FM, Möls M, Hill S, Tamang R, et al. (2013) The light skin allele of SLC24A5 in South Asians and Europeans shares identity by descent. PLoS Genet 9: 1003912.
- Jablonski NG, Chaplin G (2012) Human skin pigmentation, migration and disease susceptibility. Philos Trans R Soc Lond B Biol Sci 367: 785-792.
- Chaplin G, Jablonski NG (2009) Vitamin D and the evolution of human depigmentation. Am J Phys Anthropol 139: 451-461.
- Anno S, Ohshima K, Abe T (2010) Approaches to understanding adaptations of skin color variation by detecting gene-environment interactions. Expert Rev Mol Diagn 10: 987-991.
- Stokowski RP, Pant PV, Dadd T, Fereday A, Hinds DA, et al. (2007) A genomewide association study of skin pigmentation in a South Asian population. Am J Hum Genet 81: 1119-1132.
- Mishra A (2009) Caste and skin color variation in Indian Visceral leishmaniasis: 6th Annual Convention of The Biotech Research Society, Banaras Hindu University, (BRSI), Varanasi, India.
- Mishra A, Nizammuddin S, Mallick CB, Singh S, Prakash S, et al, Genotype-phenotype study of Middle Gangetic Plain in India reveals association of rs2470102 with skin pigmentation. J Invest Dermatol 32648-32653.
- https://en.wikipedia.org/wiki/List_of_oldest_continuously_inhabited_cities
- Misra VN (2001) Prehistoric human colonization of India. J Biosci 26: 491-531.
- Macaulay V, Hill C, Achilli A, Rengo C, Clarke D, et al. (2005) Single, rapid coastal settlement of Asia revealed by analysis of complete mitochondrial genomes. Science 308: 1034-1036.
- Thangaraj K, Chaubey G, Kivisild T, Reddy AG, Singh VK, et al. (2005) Reconstructing the origin of Andaman Islanders. Science 308: 996.
- Palanichamy MG, Sun C, Agrawal S, Bandelt HJ, Kong QP, et al. (2004) Phylogeny of mitochondrial DNA macrohaplogroup N in India, based on complete sequencing: implications for the peopling of South Asia. Am J Hum Genet 75: 966-978.
- Mishra A, Nizamuddin S, Arekatla G, Prakash S, Dewangan H, et al. (2015) IL10 Variant g.5311A Is Associated with Visceral Leishmaniasis in Indian Population. PLoS One 10: 0124559.
- Palanichamy MG, Sun C, Agrawal S, Bandelt HJ, Kong QP, et al. (2004) Phylogeny of mitochondrial DNA macrohaplogroup N in India, based on complete sequencing: implications for the peopling of South Asia. Am J Hum Genet 75: 966-978.
- Maca-Meyer N, González AM, Larruga JM, Flores C, Cabrera VM (2001) Major genomic mitochondrial lineages delineate early human expansions. BMC Genet 2: 13.
- Mishmar D, Ruiz-Pesini E, Golik P, Macaulay V, Clark AG, et al. (2003) Natural selection shaped regional mtDNA variation in humans. Proc Natl Acad Sci USA 100: 171-176.
- Kivisild T (2015) Maternal ancestry and population history from whole mitochondrial genomes. Investigative Genet. 6: 3.
- Jaswal IJ (1983) Pigmentary variation in Indian populations. Acta Anthropogenet 7: 75-83.
- Taanman JW (1999) The mitochondrial genome: structure, transcription, translation and replication. Biochim Biophys Acta 1410: 103-123.
- Kivisild T, Rootsi S, Metspalu M, Mastana S, Kaldma K, et al. (2003) The genetic heritage of the earliest settlers persists both in Indian tribal and caste populations. Am J Hum Genet 72: 313-332.
Citation: Nizamuddin S, Gupta G, Mishra A, Yashvardhini N, Pandey S, et al. (2016) Skin Pigmentation Diversity in Central-East Indian Populations and its Correlation with Mitochondrial Haplogroups. J Genet Genomic Sci 1: 005.
Copyright: © 2016 Sheikh Nizamuddin, et al. This is an open-access article distributed under the terms of the Creative Commons Attribution License, which permits unrestricted use, distribution, and reproduction in any medium, provided the original author and source are credited.