Study of Arterial Function and Remodelling by Using Radiofrequency and a New Multidirectional Doppler Technology
*Corresponding Author(s):
Pedro J ForcadaLaboratorio Vascular No Invasivo, DIM Prevención Cardiovascular Institute, Belgrano 139 Ramos Mejía, Provincia De Buenos Aires (1704), Argentina, Laboratorio Vascular No Invasivo, Cardio Arenales, Arenales 3048 PB “A”. Ciudad Autónoma De Buenos Aires (1425), Argentina
Tel:+54 11 (15)44907315,
Email:pforcada@gmail.com; pforcada@clinicadim.com.ar
Abstract
Introduction: Atherosclerosis is the underlying cause of a cardiovascular disease epidemic worldwide. The understanding of normal artery structure and function and the initial disarrangements conducting to atherosclerosis is of key relevance to develop preventive interventions based on a rational study of arterial structural and functional parameters, their pathologic behaviour and response to therapeutic interventions. New US approaches enable a precise evaluation of the forces and stimuli acting on the arterial wall and measure its responses precisely in different clinical stages of the arterial atherosclerotic disease and a better assessment of the efficacy or not of different therapeutic interventions. The ability to analyse WSS hemodynamically and to measure it accurately is an essential basis for the assessment of the atherosclerotic risk in the general population. A new angle-independent technique, measuring and visualizing blood flow velocities in all directions, called Vector Flow Imaging (VFI), has been proposed. Systems are equipped with VFI based on a multi-angle transmission plane waves method, which allows a very high frame rate and a detailed visualization of complex flow.
Methods: This study enrolled 110 consecutive patients derived to perform a non-invasive vascular evaluation to refine the assessment of their cardiovascular risk. The mean age was 55.9 + 13 yo., fifty-seven were men (52%) and there were no significative differences of age between sexes (men 55 + 12.5 and women 57 + 12). Eleven of them were on secondary prevention (7 men, 4 women, 8 revascularized Coronary Artery Disease and 3 chronic stroke),8 had no CV risk factors, 35 did not receive CV medications (antihypertensives and hypolipemiants). Fifty-one (46%) were hypertensives, 46 (90,2%) under treatment with different degrees of blood pressure control (22 controlled, 28 not controlled and 5 without treatment at the moment of the evaluation). We measured Intima Media Thickness (IMT)using automatic edge detectors and if any plaque were detected we obtained images in the two main axes and then we measured the surface of the plaque and sum up the total surface as “plaque atherosclerotic burden”. Finally, we performed the carotid femoral Pulse Wave Velocity (c-f PWV) and the endothelial function test in the left arm, considered “regional” parameters. We added to the original vascular study of our laboratory “local” determinations of IMT using radiofrequency, multidirectional doppler flow (VFI) measurements and radiofrequency analysis of the distensibility of carotid arteries.
Results: We found, as expected, significative differences between hypertensives and normotensives with higher c-f PWV and lower endothelial function in the first group. There was no relation between the local and the regional methods arising from typical and wide differences in the arteries involved. (Aorta, Carotid and brachial arteries). In the case of PWV carotid y c-f PWV they were affected by Systolic Blood Pressure (SBP) when local parameters were considered but age exerted a strong effect on c-f PWV far beyond SBP when systemic confounders were analysed.
Discussion: In a group of middle-aged patients, distributed a half hypertensive and a half normotensive, we evaluated new US doppler technology like VFI and radiofrequency to evaluate local arterial parameters like carotid IMT, remodelling, Wall Shear Stress, local Pulse Wave Velocity and arterial compliance. There was no relation between the local and the regional methods arising from typical and wide differences in the arteries involved.
Keywords
Subclinical atherosclerosis; Vascular ultrasound, Vectorial doppler, Wall shear stress
INTRODUCTION
Atherosclerosis is the underlying cause of a cardiovascular disease epidemic worldwide. The understanding of normal artery structure and function and the initial disarrangements conducting to atherosclerosis is of key relevance to develop preventive interventions based on a rational study of arterial structural and functional parameters, their pathologic behaviour and response to therapeutic interventions [1].
Blood flow alteration and inflammation, in addition to systemic risk factors, are considered possible causes for the development of atherosclerotic lesions.
Haemodynamics play an important role in the pathogenesis of atherosclerosis. Thus, vessel walls that are exposed to a steady blood flow and with a higher level of Wall Shear Stress (WSS) remain essentially disease free. In contrast, areas of blood vessels that are affected by disturbed or turbulent flow, which in turn results in a low level of shear stress, become prone to atherosclerosis. Disturbed flow usually occurs in vessel dilatation, branching regions or in case of adverse pressure gradient and significant flow decelerations [2].
Ultrasound is a non-contaminating technology, ease to use, cheap and continuously innovative, either the method itself or the computational advances for images processing, especially in the vascular field of diagnostics and therapeutics. External or intravascular applications, allow a better understanding of the initial steps of the atherosclerotic disease and a close follow up of the disease evolution or the therapeutic interventions.
New US approaches enable a precise evaluation of the forces and stimuli acting on the arterial wall and measure its responses precisely in different clinical stages of the arterial atherosclerotic disease and a better assessment of the efficacy or not of different therapeutic interventions.
The ability to analyse WSS hemodynamically and to measure it accurately is an essential basis for the assessment of the atherosclerotic risk in the general population. Colour Doppler imaging (CD) and Spectral Doppler or Pulsed Wave analysis (PW) can provide a real-time direct imaging visualization of flow and the measurement of blood velocities, respectively. The methods have been used to characterise patterns of flow velocity and correlate them with variations in WSS [3].
Some studies, performed to analyse the flow in the carotid arteries, showed that the development of arterial plaques is more frequent in the presence of a vortex flow. Colour Doppler (CD), for evaluation of flow patterns, and spectral Doppler analysis (PW), for measurement of blood velocities, have been used to detect flow disturbances in the carotid bifurcation. Although these studies showed that complex flow patterns are detectable, CD and PW are angle-dependent and only estimate the axial component of blood flow velocity; consequently, the quantification of complex flow is not achievable with conventional ultrasound (US) systems. Moreover, CD is also affected by a limited frame rate, allowing low temporal resolution; PW displays the complete spectrum of velocities through the cardiac cycle, but related to a small sample volume and along a single line only. These limitations explain why, in the last decades, the flow complexity analysis was not used for clinical diagnosis or for long-term prognosis and the Doppler evaluation of abnormal flow velocity has been restricted only to the grading of vessel stenosis (Figure 1) [4].
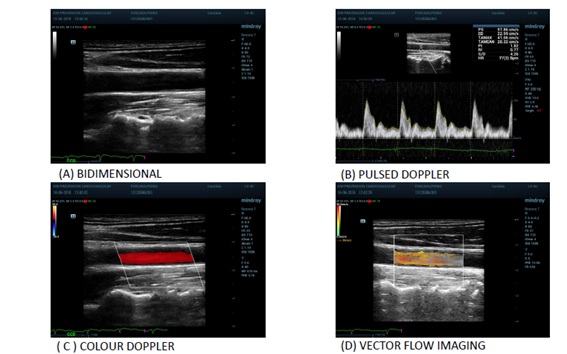 Figure 1: Different ultrasound approaches to study arteries structure and function.
In recent years, new different techniques have been proposed aimed to better describe the flow complexity in the carotid artery and other vessels. A new angle-independent technique, measuring and visualizing blood flow velocities in all directions, called Vector Flow Imaging (VFI), has been proposed [5]. VFI is an operator independent technique that can provide more intuitive and quantitative imaging of vortex formation, which is not clearly distinguishable in the CD images. Various VFI methods of estimation principles can be used [6]. Among the various methods of estimation suggested, the one based on phase shift estimation with Transverse Oscillations (TO) and the other based on Plane-Wave Imaging (PWI) were implemented on commercial systems, thus ready for clinical application [7].
The PWI methods estimate the 2D vector velocity of the flow at higher frame rate than the TO method, allowing better depiction of complex flow patterns. Systems are equipped with VFI based on a multi-angle transmission plane waves method, which allows a very high frame rate of about 500 Hz. Such a high frame rate offers a detailed visualization of complex flow by showing even transient events, otherwise undetectable.
We evaluated, in a real-life study the feasibility of some clinical applications of this new technology for the evaluation of carotid flow patterns in comparison to the conventional US techniques [8].
MATERIALS AND METHODS
Study Patients
This study enrolled 110 consecutive patients derived to perform a non-invasive vascular evaluation to refine the assessment of their cardiovascular risk. The mean age was 55.9 + 13 y.o., fifty-seven were men (52%) and there were no significative differences of age between sexes (men 55 + 12.5 and women 57 + 12). Eleven of them were on secondary prevention (7 men, 4 women, 8 Coronary Artery Disease revascularized and 3 chronic stroke), 8 had no CV risk factors, 35 did not receive CV medications (antihypertensives and hypolipemiants). Fifty-one(46%) were hypertensives, 46 of them (90,2%) under treatment with classic antihypertensives (beta blockers, RAS inhibitors, calcium antagonists and diuretics) with different degrees of blood pressure control (22 controlled, 28 not controlled and 5 without treatment at the moment of the evaluation).The distribution of the remaining risk factors is described in table 1.
Protocol
This is a single measurement, observational and descriptive study. We received the patients in the early morning, fasting and resting at least 15 minutes prior access to the vascular laboratory and the study was performed supine in a calm room climatized at 23o C. We explained the protocol, approved by the local ethics committee and the patient then signed the informed consent. We measured height, weight and waist diameter then the blood pressure in the right arm standing and sitting according to Argentinean 2018 Guidelines for Hypertension Diagnosis and Treatment. The echographic study was performed in supine position following, in the analysis of vessels of the neck and femoral groins, a clock wise order. We measured carotid IMT (Intima Media Thickness) using automatic edge detectors at end diastole using ECG. If any plaque were detected we obtained images in the two main axes and then we measured the surface of the plaque and sum up the total surface as plaque atherosclerotic burden.
Then, we measured the carotid femoral distance to calculate the Pulse Wave Velocity (PWV) using the transit time calculated substracting the time from ECG to the foot of the doppler signal in the femoral artery, the time from ECG to the foot of the carotid artery doppler wave. The PWV was calculated dividing the carotid femoral distance in meters over the transit time in seconds [9].
Finally, we performed the endothelial function test in the left arm according to the technique described in 1992 by Celermajer, et al. [10] and clearly described in 2002 American Guidelines for Evaluation of Endothelial Function [11]. We added to the original vascular study of our laboratory determinations of IMT using radiofrequency, multidirectional doppler flow measurements and radiofrequency analysis of the distensibility of carotid arteries and left brachial artery during the endothelial test. As the analysis of results of these techniques was a post process procedure it didn´t increase significantly the duration of the study.
Equipment
We used the Resona 7 a colour Doppler ultrasound device (MINDRAY, Shenzhen, China) with a high-sensitive 4-13 MHz multi-frequency linear arrayprobe transducer. The patient was in the supine position with his or her head 20° deviated to the opposite side. The device has built-in digital system processing software. A series of carotid artery parameters such as Vector Flow Imaging (VFI), Wall Shear Stress (WSS), RF Quality Intima-Media Thickness (RFQIMT), RF Quality Arterial Stiffness (RFQAS), to determine local PWV and the hardness coefficient were measured automatically.
High-frame rate VFI
The high-frame rate VFI is based on PWI. Acquisition of flow vector information at high frame rates was obtained by performing multi-directional transmissions of plane waves; after a single plane wave transmission, multiple images receiving lines were obtained. It allowed calculation of the true velocity vectors at any location in a vessel. The dynamic flow was obtained by continuously updating the target’s position according to the calculated velocity. The interleaved transmission sensure both a highly sensitive vector flow image and a high-resolution B-mode images. The flow was analysed by the system for 1.5 s at a Pulse Repetition Frequency (PRF) of 10-15 kHz and at a very high frame rate of 400-600 Hz, depending on the used PRF, allowing to study atleast one cardiac cycle. The data were reprocessed automatically by the US system in a 35-36-s clip, generating a sequence of about 600-900images that could be displayed at aframe rate of 20-30Hz.The acquired data could be further evaluated in the saved video. Such a high frame rate allowed a detailed analysis of haemodynamics.
V Flow detects the speed and direction of all blood cells flowing through every point of the Region of Interest (ROI). There are low-speed cells, high-speed blood cells, and reversecells flowing through a point in a short moment. It means that the speed measured and displayed by V Flow in a point is the average speed of all blood cells in a precise short moment. Spatiotemporal characteristics of flow was evaluated visually and quantitatively to asses the specific flow patterns. VFI shows velocity vectors, streamline distribution and vorticity distribution. (Figure 2).
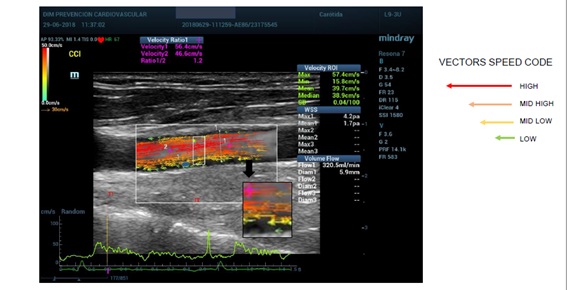 Figure 2: Vector flow imaging.
The streamline distribution uses arrows to indicate the flow direction. The colour and length of the arrows showed the flow velocity, magnitude and direction (green means low velocities, yellow and orange medium velocities and red higher velocities; the longer the arrows the faster the flow). For quantitative evaluation, velocity curves were available: the maximum velocity vector point curve, automatically detected by the system, and the user-defined vector point curve. Both were displayed at the bottom of the image and showed the fluctuating velocities of the flow varying in subsequent cardiac cycles (Figure 3) [12].
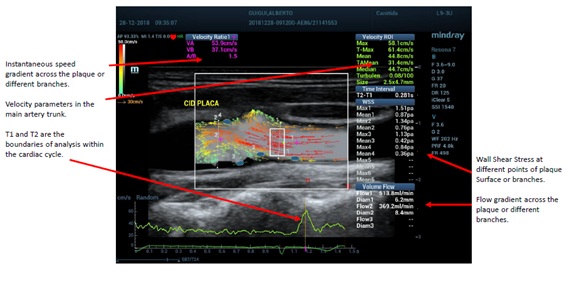 Figure 3: Different parameters obtained with vector flow imaging.
Wall Shear Stress
Both estimates of viscosity and Wall Shear Rate (WSR) are needed to quantify WSS. Because viscosity can be challenging to measure noninvasively, many ultrasonic techniques to date have instead focused on measuring the WSR. One proposed approach is to measure the peak flow velocity at a single depth within the artery using conventional spectral Doppler (typically near the centre of the lumen) and then estimate the WSR from the velocity data using a flow model. Alternatively, WSR can be estimated by measuring the flow velocity at several depths in the artery and then computing the spatial derivative of the measured velocity profile near the wall as we did as these approaches need multi-gated spectral Doppler or VFI to characterize the flow velocity profile within the artery.
Radiofrequency parameters
A series of carotid artery parameters (named in this study “local” parameters) such as RF Quality Intima-Media Thickness (RFQIMT), RF Quality Arterial Stiffness (RFQAS), real-time carotid IMT and elasticity can be measured automatically. The bilateral long axes of the carotid arteries were explored, then the probe was adjusted so that the ultrasound beam was perpendicular to the anterior and posterior wall of the carotid artery and to get a clear image of the front and rear walls of the blood vessels. Then RFQIMT was initiated, the carotid artery IMT was measured at 1.0-1.5 cm at the posterior wall of the carotid artery enlargement proximal end, quantitative real-time detection of six cardiac cycles of carotid artery IMT was performed, then their mean values were calculated.
The system can automatically calculate RAVQRS and then the local PWV, hardness coefficient (β coefficient) an index of arterial compliance (CC).
Parameter definitions:
β= ln(Ps/Pd)/[(Ds - Dd)/Dd] (1)
CC = π(Ds . Ds - Dd . Dd)/[4 (Ps - Pd)] (2)
PWV = √(βPd/2ρ). (3)
Among them, Ds is the largest internal diameter of the carotid artery, Dd is the minimum inside diameter of the carotid artery, and ρ is the density of blood.
RESULTS
Population
The general population characteristics and those of hypertensives and normotensive patients are described in table 1. We considered to split the sample according to the presence of hypertension as 90 % of these patients received cardiovascular drugs with hemodynamic effect and impact on the vascular parameters to be measured. Hypertensive patients were younger, presented higher values of blood pressure and cardiovascular drugs use. No significant differences in the proportion of dislypemia, diabetes, overweight or sedentarism was found. (Level of significance p< .05).
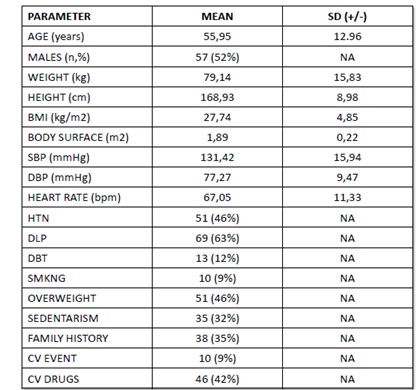 Table 1: Baseline Characteristics of the study population (n=110).
Local arterial parameters
We measured in the left common carotid artery three different parameters and compared the values of the whole population against hypertensives and normotensives: remodelling (IMT / carotid diameter ratio), wall shear stress in the mid common carotid trunk and the regional pulse wave velocity and hardness coefficient.
We tried to define the reference boundaries for these parameters, and then if there were differences between hypertensives and normotensives (Figure 4). The comparison between hypertensives and normotensives did not show significative differences for remodelling but showed significative differences for carotid PWV and mean WSS (Figure 5).
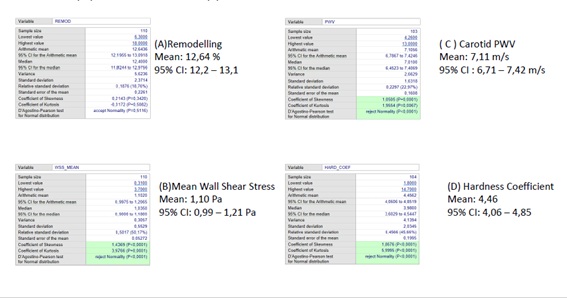 Figure 4: Boundaries and confidence limits of the regional arterial parameters: Remodelling(A), wall shear stress (B), carotid PWV (C) and hardness coefficient (D).
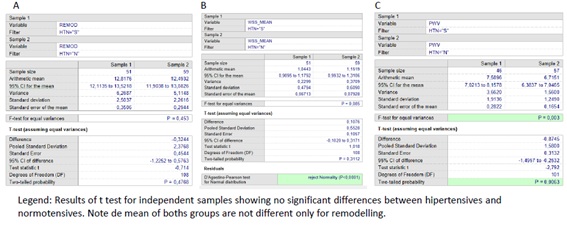 Figure 5: Comparison of Remodelling (A), mean wall shear stress (B) and in Hypertensive’s (H) and Normotensives (N).
Finally, we thought that it could be due to the level of control of blood pressure but an ANOVA test only showed significative differences in carotid PWV between normotensives and non-controlled hypertensives. It is noticeably the trend with increased remodelling, lower WSS and higher PWV in non-controlled and untreated hypertensives (Figure 5 bis).
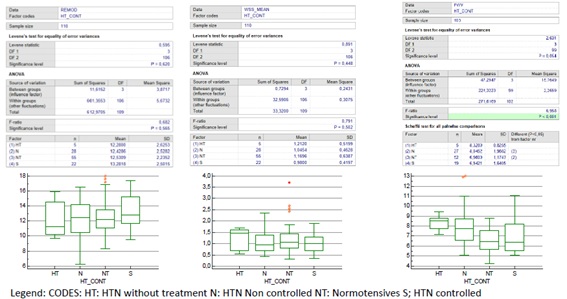 Figure 5 (bis): Comparison of Remodelling (A), wall shear stress (B), and carotid PWV (C) in controls and hypertensive’s according to BP control. (ANOVA test).
Regional parameters
We analysed two well-known parameters measured in peripheral arteries widely renown and supported by solid scientific evidence; Carotid femoral Pulse Wave Velocity and Post ischemic dilatation of the brachial artery as index of endothelial function. Carotid femoral PWV was measured as described in guidelines and Endothelial function according guidelines and the results corrected according to age and brachial artery diameter. We found as expected significative differences between hypertensives and normotensives with higher c-f PWV and lower endothelial function in the first group (Figure 6) [13]. The Atherosclerotic plaques burden is also included in this group, as includes carotid and femoral plaques. The burden increased with age but showed no differences according to sex or the presence of hypertension.
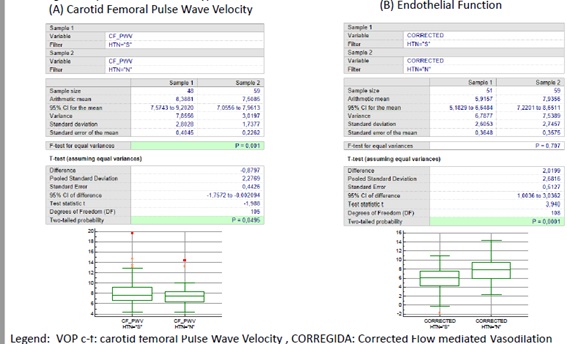 Figure 6: Comparison of regional parameters (A) carotid - femoral pulse wave velocity (c-f PWV) and (B) Endothelial Function according to the presence or not of hypertension.
Comparison of methods
Finally, we evaluated if there was a relation between the regional and the systemic parameters, namely carotid PWV with c- PWV and the Wall Shear Stress (WSS) with the peripheral endothelial function test (Figures 7 and 8).
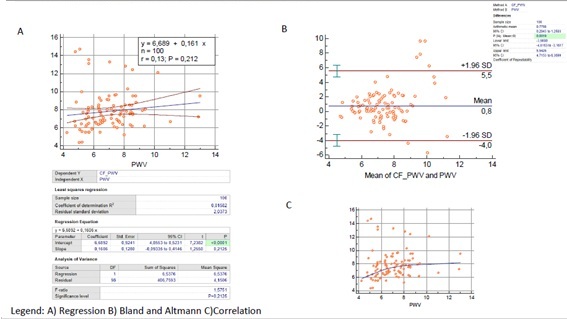 Figure 7: Comparison of regional c-f pulse wave velocity and Carotid PWV.
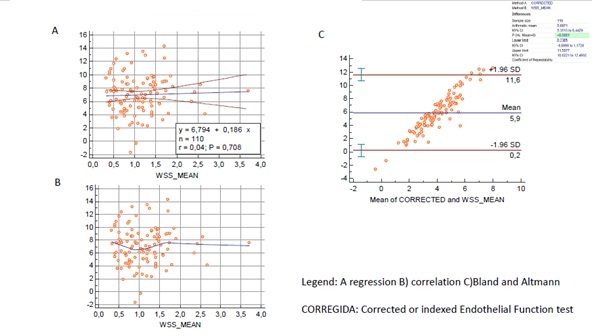
Figure 8: Comparison of regional Endothelial function and Wall Shear Stress.
As described in classical literature there was no relation between the regional and the systemic methods arising from typical and wide differences in the arteries involved. (Aorta, Carotid and brachial arteries) In spite of this, they were concordant according to Bland and Altman test and differences seem to be related to the extreme values and otuliers.
Multiple regression analysis showed that a regional parameter like endothelial function can be related with regional and systemic parameters, but a local parameter like mean WSS, considered linked to endothelial function, was not (Figures 9 &10).
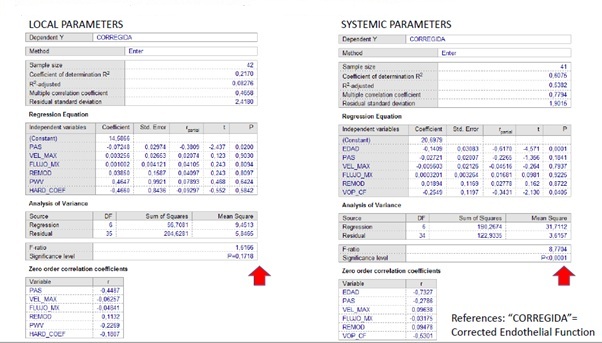 Figure 9: Comparison of regional Endothelial function interaction: Systemic vs. Local.
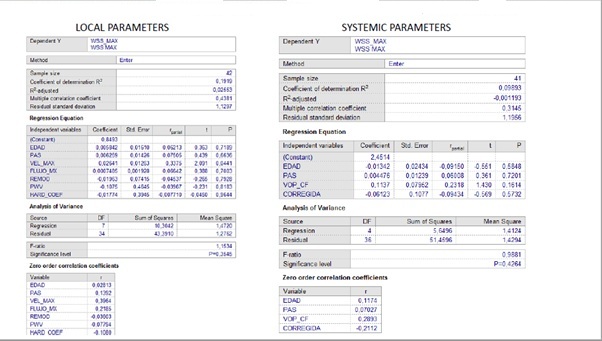 Figure 10: Local Endothelial function by means of WSS: Regional vs. local parameters.
In the case of PWV carotid y c-f they were affected by Systolic Blood Pressure (SBP) when local parameters were considered but age exerted a strong effect on c-f PWV far beyond SBP when systemic confounders were analysed (Figures 11 and 12).
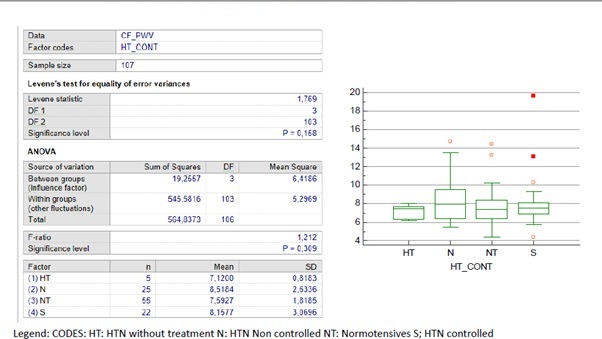 Figure 11: Regional Parameters: c-f PWV according to BP control.
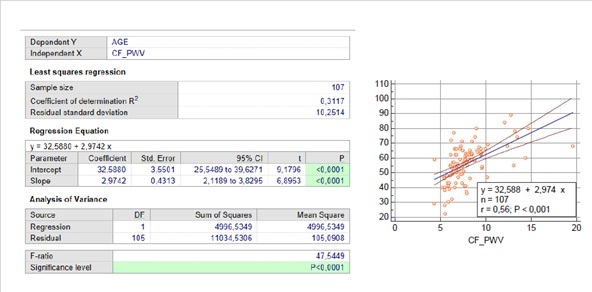 Figure 12: Regional Parameters: c-f PWV strong relation with age.
DISCUSSION
In a group of middle-aged patients, distributed a half hypertensive and a half normotensive, we evaluated new US doppler technology like VFI and radiofrequency to evaluate local arterial parameters like carotid IMT, remodelling, Wall Shear Stress, local Pulse Wave Velocity and arterial compliance.
In order to evaluate if these parameters reflect the effect of systemic conditions like hypertension, we measured also regional parameters like c-f Pulse Wave Velocity and Endothelial function by flow mediated vasodilation in the forearm. As described in classic literature there was no relation between regional and local parameters, but this time they were measured no invasively and by means of a single, reproducible method using US.
The limitations of this study are the non-controlled and a “real life” design in a group of consecutive patients, derived for evaluation of Cardiovascular risk.
Other limitation is the sample size in special to determine boundaries to consider the parameters found as normal or not and in particular, if the differences found were or not representative of what happens in greater samples.
The availability of this type of technology will allow a closer evaluation of the initial steps in the development of atherosclerosis and future studies should be designed with adequate samples to address questions about the initial abnormalities conducting to arteriosclerosis, (ie., Arterial stiffening) or Atherosclerosis (ie. Atherosclerotic plaques) in order to direct preventive and therapeutic decisions.
CONFLICTS OF INTEREST
This investigation was conducted with an unrestricted grant of MINDRAY.
ACKNOWLEDGMENTS
I would like to thank the scientific support, technical skills and friendship of Kendy Che Cheung NG,BSc, RVT, RDCS, MBA, former representative of Mindray Medical International Ltd., Shenzhen. China.
REFERENCES
- Vlachopoulos C, Xaplanteris P, Aboyans V et al (2015) The role of vascular biomarkers for primary and secondary prevention. A position paper from the European Society of Cardiology Working Group on peripheral circulation Endorsed by the Association for Research into Arterial Structure and Physiology (ARTERY) Society. Atherosclerosis 241: 507-532.
- Nichols WW, O’Rourke MF, Vlachopoulos C (2011) Mc Donald’s Blood Flow in Arteries. Theoretical and Clinical Principles. 6th ed. Ed Hodder Arnold, London, UK.
- Nicolaides A, Beach K, Kyriakou E, Pattichis CS (2012) Ultrasound and Carotid Bifurcation Atherosclerosis. Ed. Springer Verlag, London, UK.
- Sengupta PP, Pedrizzetti G, Kilner PJ, Kheradvar A, Ebbers T, et al. (2012) Emerging trends in CV flow visualization. JACC Cardiovasc Imaging 5: 305-316.
- Jensen JA, Munk P (1998) A new method for estimation of velocity vectors. IEEE Trans Ultrasound Ferroelectr Freq Control 45: 837-851.
- Yiu BY, Lai SS, Yu AC (2014) Vector projectile imaging: time resolved dynamic visualization of complex flow patterns. Ultrasound Med Biol 40: 2295-2309.
- Udesen J, Gran F, Hansen KL, Jensen JA, Thomsen C, et al (2008) High frame-rate blood vector velocity imaging using plane waves: simulations and preliminary experiments. IEEE Trans Ultrason Ferroelectr Freq Control 55: 1729-1743.
- Younis HF, Kaazempur-Mofrad MR, Chan RC, Isasi AG, Hinton DP, et al: (2004) Hemodynamics and Wall Mechanics in Human Carotid Bifurcation and Its Consequences for Atherogenesis: Investigation of inter-individual variation. Biomech Model Mechanobiol 3: 17-32.
- Van Bortel LM, Laurent S, Boutouyrie P, Chowienczyk P, Cruickshank JK, et al. (2012) European Society of Hypertension Working Group on Vascular Structure and Function and the European Network of Non Invasive Investigation of Large Arteries: Expert Consensus on the Measurement of Aortic Stiffness in Daily Practice Using Carotid Femoral Pulse Wave Velocity. J Hypertens 30: 445-448.
- Celermajer DS, Sorensen KE, Gooch VM, Spiegelhalter DJ, Miller OI, et al. (1992) Non Invasive Detection of Endothelial Dysfunction in Children and Adults at Risk of Atherosclerosis. Lancet 340: 1111-1115.
- Corretti MC, Anderson TJ, Benjamin E, Celermajer D, Charbonneau F, et al (2002) Guidelines for the Ultrasound Assessment of Endothelial-Dependent Flow-Mediated Vasodilation of the Brachial Artery. A Report of the International Brachial Artery Reactivity Task Force. J Am Coll Cardiol 39: 257- 265.
- Goddi A (2017) Advanced Vector Flow Imaging in Vascular Evaluation. Diagnostic Imaging Europe.
- Vlachopoulos C, Xaplanteris P, Aboyans V, Brodmann M, Cífková R et al: (2015) The role of vascular biomarkers for primary and secondary prevention. A position paper from the European Society of Cardiology Working Group on peripheral circulation: Endorsed by the Association for Research into Arterial Structure and Physiology (ARTERY) Society. Atherosclerosis 241: 507-532.
Citation: Forcada PJ (2021) Study of Arterial Function and Remodelling by Using Radiofrequency and a New Multidirectional Doppler Technology. J Angiol Vasc Surg 6: 056.
Copyright: © 2021 Pedro J Forcada, et al. This is an open-access article distributed under the terms of the Creative Commons Attribution License, which permits unrestricted use, distribution, and reproduction in any medium, provided the original author and source are credited.