Synthesis and Characterization of Modified Sepiolite for the Adsorptive Removal of Rhodamine B from Wastewater
*Corresponding Author(s):
Shaomin LiuKey Laboratory Of Safe And Effective Coal Mining, Anhui University Of Science And Technology, Huainan, China
Tel:+86 554 6668742,
Email:shmliu1@163.com
Abstract
INTRODUCTION
Sepiolite is a kind of two-layer silicon-oxygen tetrahedron, the middle layer of magnesium oxide octahedral structure. And a layered structure of a chain. Each of the six top silicon-oxygen tetrahedron vertexes opposite, forming a layered structure on the key elements 2:1 parallel channels arranged in the lower phase [4-6]. Mg2+ and Si-OH groups are the main active centers for adsorption [7]. This particular structure determines its excellent adsorption performance, better stability also determines Sodium Dodecyl Sulfate (SDS) supported on sepiolite better stability [8-9]. However, due to natural sepiolite impurities, contaminants and partially blocked pores smaller channels which limits the role of sepiolite [10]. Therefore, sepiolite it has been studied using the modified method by scholars. Marjanovi? V [4], Letaief S [11], Miura A [12], Franco F [13], et al., studied the adsorption capacity of sepiolite acid-modified. Miura A [12], Duan E [14], et al., studied the adsorption capacity of sepiolite heated-modified. Franco F [13] researched on the Microwave assisted acid treatment of sepiolite. Zhang G [15], Lazarevi? S [16], Pina-Zapardiel R [17], et al., studied the adsorption and catalysis capacity of sepiolite loaded metal or metallic oxide. Adsorption capacity of sepiolite loaded anionic surfactants has been studied by few people.
SDS as an anionic surfactant was used to modify sepiolite in this article. Adsorption capacity to RhB with SDS/sepiolite was compared with sepiolite, acid sepiolite and Polyvinylpyrrolidone (PVP)/sepiolite in the present study. Then the obtained SDS/sepiolite was characterized using Brunauer-Emmett-Teller (BET), Scanning Electron Microscopy (SEM), and Fourier Transform Infrared spectroscopy (FT-IR). To evaluate the potential of SDS/sepiolite, studies of the kinetics, adsorption mechanisms and isotherms were conducted. Adsorption mechanisms were tested under the optimum conditions obtained by analyzing the influence factors. Finally, Re-adsorption experiments executed was detected to show whether there is recycling of SDS/sepiolite. All results indicated that SDS/Sepiolite is a good adsorbent using in the environmental field.
EXPERIMENTAL SECTION
Activation of sepiolite
Synthesis of SDS/sepiolite and PVP/sepiolite composites
Synthesis of PVP/sepiolite accord to the way of synthesis of SDS/sepiolite. And then adsorption capacity to RhB with SDS/sepiolite was compared with sepiolite, acid sepiolite and Polyvinylpyrrolidone (PVP)/sepiolite.
Characterization of adsorbents
Analysis of factors affecting the adsorbent
|
Influencing Factors |
Specific values |
|
|||||||||||
|
msds/sep(g) |
cRhB(mg/L) |
pH |
|
||||||||||
|
msds/sep |
0.02 |
0.03 |
0.04 |
0.05 |
25 |
Initial pH |
|
||||||
|
cRhB |
0.03 |
10 |
20 |
25 |
35 |
Initial pH |
|||||||
|
The pH of solution |
0.03 |
25 |
3 |
5 |
7 |
9 |
|
||||||
Adsorption kinetics and isotherm of adsorption

Isotherms of adsorption: Isotherms of RhB adsorption on the SDS/sepiolite were determined in batch experiments. 0.02g of SDS/sepiolite with twelve different RhB concentrations (10, 13, 15, 18, 20, 23, 25, 28, 30, 33, 35 and 38 mg/L) was added into 25ml Serum bottles. Adsorption reactions were conducted at 10, 25 and 35 degrees Celsius in the constant temperature water bath. Sampling 10h after adsorption reactions and adsorbance of samples were detected at 554nm using a visible spectrophotometer. The equilibrium adsorption data were analyzed using the Freundlich (Equation 5) and Langmuir (Equation 6) equilibrium isotherms.

Re-adsorption experiments
RESULTS AND DISCUSSION
Adsorption performance comparison
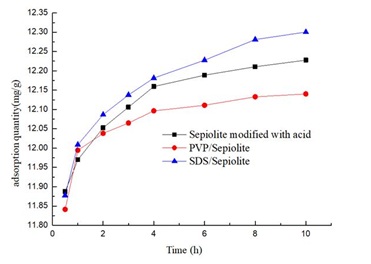
The modified PVP and SDS surface made plug some of the surface micro pores, however, the surface modified adsorption rate slope of PVP and SDS was the biggest, In the adsorption of 1 hours, the adsorption value is higher than that of acid modified sepiolite, PVP/sepiolite adsorption slope is more than SDS/ sepiolite adsorption slope, may PVP of high surface activity and more load on the surface of sepiolite, In the adsorption of PVP in the time zone contact with the Rhodamine B large area, with more quantities. In 3 hours, the several sepiolites adsorption slope is close, subsequently adsorbed slope of PVP/Sepiolite is minimum, acid modified sepiolite is second, SDS/sepiolite is maximum, because PVP and Rhodamine B in the sepiolite surface reaction together, to some extent hindered the sepiolite adsorption of Rhodamine B, which is the reason, the absorbance of PVP/Sepiolite adsorption of Rhodamine B than acid change high absorbance of sepiolite adsorption of Rhodamine B at 10 hours.
Structural characterization
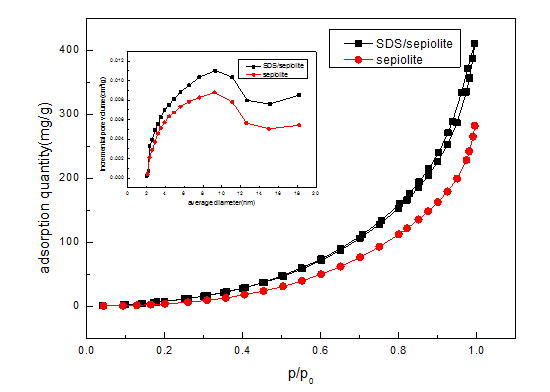
|
Catalysts |
BET Surface Area |
Pore Volume |
Pore Size |
|
Sepiolite |
31.48 |
0.0901 |
12.39 |
|
SDS/sepiolite |
44.82 |
0.1178 |
12.77 |
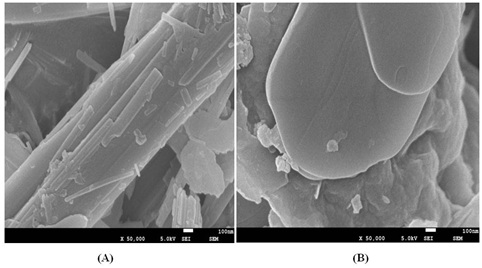
The morphology and microstructure of the acid sepiolite and SDS/sepiolite composites were characterized by SEM. Figure 3(A) shows that the obtained acid sepiolite exhibited tube-like structure with diameters of approximately 2um. Structure is relatively smooth and the other substances clogging the adsorption of pollutants contained in the tubular structure [17-19]. SDS loaded in the surface and inner of sepiolite which lead to the tight junctions and uneven shape in figure 3(B). Entire surface of SDS/sepiolite was irregular and the total surface area becomes large. The change of original crystal structure into tabular crystals can be seen in the figure 3(B).
Chemical structure, chemical bonding substance and functional groups of acid sepiolite and SDS/sepiolite were characterized by FT-IR. Peaks were found at 478-489, 624-677, 1025-1089, and 1384-1425, 2350-2411, 3430-3429 for both acid sepiolite and SDS/sepiolite. Significant shift of absorption peaks to SDS/sepiolite were seen figure 4. Some shifts of their position were confirmed due to the structural changes of sepiolite by heating [20]. Solo peaks were found at 2927 and 2839 for SDS/sepiolite. It indicated that SDS successfully supported on sepiolite. Acid sepiolite and SDS/sepiolite exhibit various bands at 624-677 (bending vibration of Mg-OH), at 753-795 (bending vibration of Mg-Fe-OH) [21], which shows the basic structure of sepliote has not changed because magnesium ions as a supporting role has not changed in sepliote [12]. SDS/sepiolite exhibits the band at 2839-2927(asymmetric stretching vibrations of C-H groups) [21].
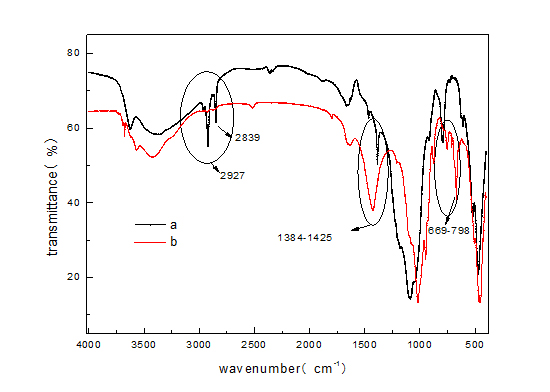 Figure 4: FTIR spectra of a(SDS/sepiolite) and b(acid sepiolite).
Analysis of factors affecting
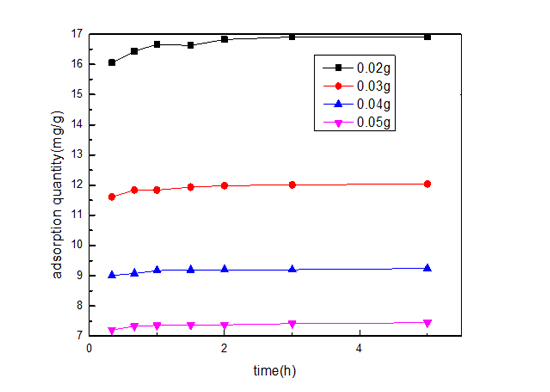
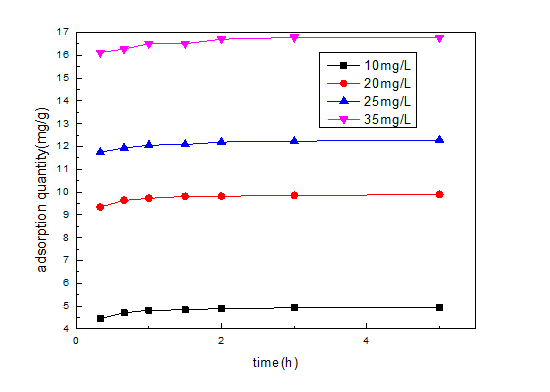 Figure 6: Effect of the adsorption capacity on different RhB concentration.
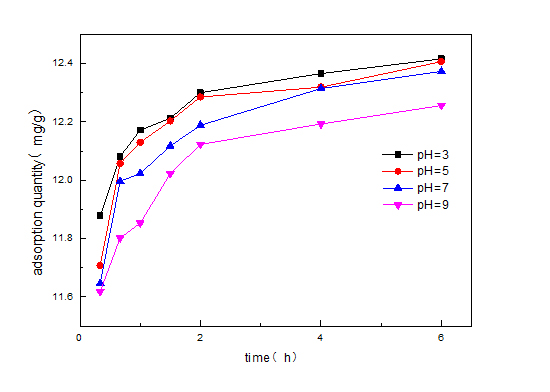
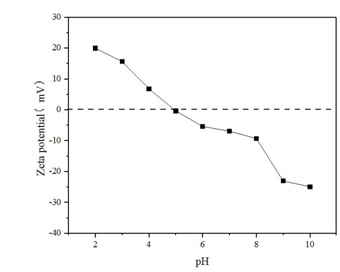
Moreover, the surface charge of SDS/sepiolite becomes dependent on the pH of the solution due to protonation and deprotonation. Figure 8 is Zeta potential distribution of SDS/sepiolite at varied pH. From figure 8, we can know that the pH at zero point charge of SDS/sepiolite is around 5, indicating that the surface charge is positive when pH ? 5 and negative at pH > 5. The results indicate that SDS/sepiolite has a better adsorption effect on RhB under acidic conditions.
In conclusion, the optimum condition was mSDS/sep=0.02g, cRhB=35mg/L, pH=3. The result is the same as the date of orthogonal analysis in tables 3 and 4.
|
Level |
A |
B |
C |
|
SDS/sepiolite(g) |
RhB concentration(mg/L) |
Solution pH |
|
|
1 |
0.02 |
20 |
3 |
|
2 |
0.03 |
25 |
5 |
|
3 |
0.04 |
35 |
7 |
|
Number |
A |
B |
C |
Adsorption quantity?mg/g? |
|
SDS/sepiolite(g) |
RhB concentration(mg/L) |
Solution pH |
||
|
1 |
1 |
1 |
3 |
14.18967379 |
|
2 |
1 |
2 |
2 |
21.44181221 |
|
3 |
1 |
3 |
1 |
24.91114541 |
|
4 |
2 |
1 |
2 |
9.746524363 |
|
5 |
2 |
2 |
1 |
14.85101503 |
|
6 |
2 |
3 |
3 |
16.74594116 |
|
7 |
3 |
1 |
1 |
7.435646577 |
|
8 |
3 |
2 |
3 |
11.14919634 |
|
9 |
3 |
3 |
2 |
12.86199281 |
|
K1 |
20.18087714 |
10.45728158 |
15.73260234 |
|
|
K2 |
13.78116019 |
15.81400786 |
14.68344313 |
|
|
K3 |
10.48227858 |
18.17302646 |
14.59920259 |
|
|
Range |
9.698 |
7.716 |
1.133 |
|
|
Pri and Sec |
|
A>B>C |
||
|
Opt levels |
A1B3C1 |
|||
Adsorption kinetics
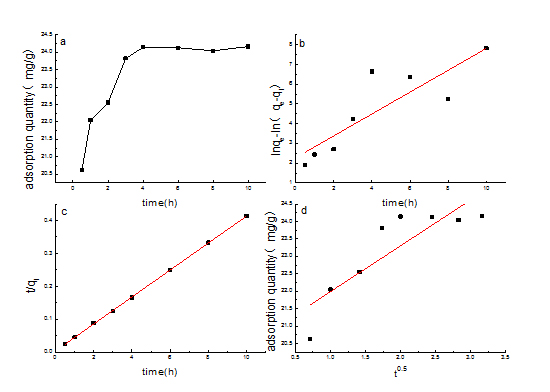 Figure 9: Adsorption kinetics of SDS/sepiolite (a): the relation of adorption and time, b): pseudo first-order kinetics fitting, c): pseudo first-order kinetics fitting, d): Morries-Wede fitting.).
|
Fitting Type |
pseudo-first order |
pseudo-second order |
Morries-Wede |
|||||
|
K1 |
R2 |
K2 |
1/qe |
R2 |
kp |
c |
R2 |
|
|
Coefficients |
0.5545 |
0.705 |
2.5 |
0.041 |
0.999 |
1.315 |
20.674 |
0.707 |
Isotherm of adsorption
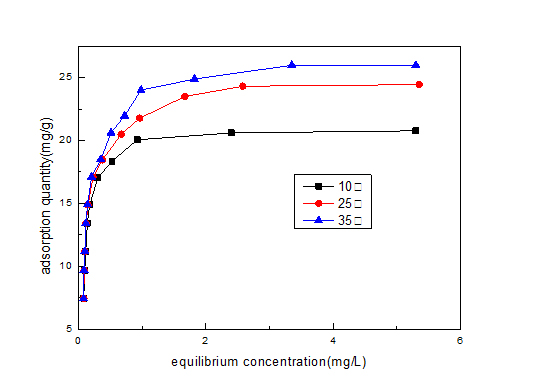 Figure 10: Adsorption isotherm under different temperature.
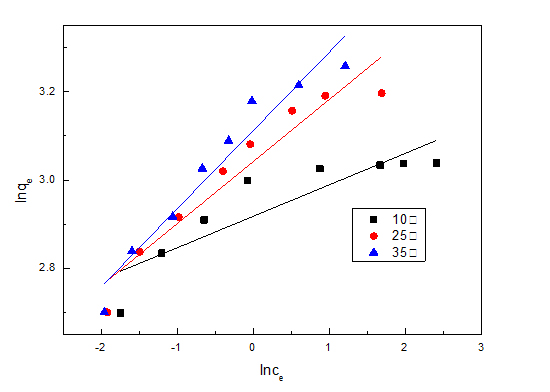 Figure 11: Freundlich linear fitting adsorption isotherm.
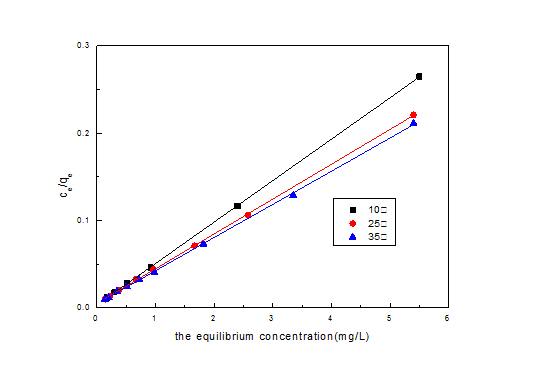 Figure 12: Langmuir linear fitting adsorption isotherm.
|
Temperature (°C) |
Regression equation |
R12 |
k |
n |
|
10 |
y=0.071x+2.938 |
0.753 |
18.878 |
14.085 |
|
25 |
y=0.141x+3.042 |
0.911 |
20.947 |
7.092 |
|
35 |
y=0.178x+3.112 |
0.930 |
22.466 |
5.618 |
|
Temperature (°C) |
Regression equation |
R22 |
qm(mg/L) |
b(L/mg) |
|
10 |
y=0.0476x+0.00295 |
0.996 |
21.008 |
16.136 |
|
25 |
y=0.0399x+0.0047 |
0.997 |
25.062 |
8.490 |
|
35 |
y=0.037x+0.0052 |
0.995 |
27.027 |
7.115 |
Re-adsorption analysis
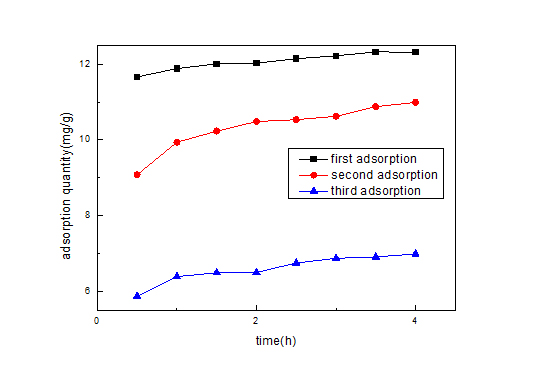 Figure 13: comparison of the amount of re-adsorption.
CONCLUSION
REFERENCES
- Gao Y, Wang Y, Zhang H (2015) Removal of Rhodamine B with Fe-supported bentonite as heterogeneous photo-Fenton catalyst under visible irradiation. Applied Catalysis B: Environmental 178: 29-36.
- Chen X, Dai J, Shi G, Li L, Wang G, et al. (2016) Sonocatalytic degradation of Rhodamine B catalyzed by β-Bi2O3 particles under ultrasonic irradiation. Ultrason Sonochem 29: 172-177.
- Shen J, Wu Y-n, Zhang B, Li F (2015) Adsorption of Rhodamine B dye by biomimetic mesoporous SiO2 Clean Technologies and Environmental Policy 17: 2289-2298.
- Marjanovi? V, Lazarevi? S, Jankovi?-?astvan I, Joki? B, Jana?kovi? D, et al. (2013) Adsorption of chromium(VI) from aqueous solutions onto amine-functionalized natural and acid-activated sepiolites. Applied Clay Science 80: 202-210.
- Tekin N, Kaya AU, Esmer K, Kara A (2012) Adsorption and dielectric properties of poly(1-vinylimidazole) on sepiolite. Applied Clay Science 57: 32-38.
- Sevim AM, Hojiyev R, Gül A, Çelik MS (2011) An investigation of the kinetics and thermodynamics of the adsorption of a cationic cobalt porphyrazine onto sepiolite. Dyes and Pigments 88: 25-38.
- Eren E, Gumus H (2011) Characterization of the structural properties and Pb(II) adsorption behavior of iron oxide coated sepiolite. Desalination 273: 276-284.
- Corma A, Garcia H, Leyva A, Primo A (2004) Alkali-exchanged sepiolites containing palladium as bifunctional (basic sites and noble metal) catalysts for the Heck and Suzuki reactions. Appl Catal A Gen 257: 77-83.
- Vico LI (2003) Acid-base behaviour and Cu2+ and Zn2+ complexation properties of the sepiolite/water interface. Chem Geol 198: 213-222.
- Brindley GW (1959) X-ray and electron diffraction data for sepiolite. American Mineralogist 44: 495-500.
- Letaief S, Grant S, Detellier C (2011) Phenol acetylation under mild conditions catalyzed by gold nanoparticles supported on functional pre-acidified sepiolite. Applied Clay Science 53: 236-243.
- Miura A, Nakazawa K, Takei T, Kumada N, Kinomura N, et al. (2012) Acid-, base-, and heat-induced degradation behavior of Chinese sepiolite. Ceramics International 38: 4677-4684.
- Franco F, Pozo M, Cecilia JA, Benítez-Guerrero M, Pozo E, et al. (2014) Microwave assisted acid treatment of sepiolite: The role of composition and “crystallinity”. Applied Clay Science 102: 15-27.
- Duan E, Han J, Song Y, Guan Y, Zhao W, et al. (2013) Adsorption of styrene on the hydrothermal-modified sepiolite. Materials Letters 111: 150-153.
- Zhang G, Xiong Q, Xu W, Guo S (2014) Synthesis of bicrystalline TiO2 supported sepiolite fibers and their photocatalytic activity for degradation of gaseous formaldehyde. Applied Clay Science 102: 231-237.
- Lazarevi? S, Jankovi?-?astvan I, Potkonjak B, Jana?kovi? D, Petrovi? R (2012) Removal of Co2+ ions from aqueous solutions using iron-functionalized sepiolite. Chemical Engineering and Processing: Process Intensification 55: 40-47.
- Pina-Zapardiel R, Esteban-Cubillo A, Bartolomé JF, Pecharromán C, Moya JS (2013) High wear resistance white ceramic glaze containing needle like zircon single crystals by the addition of sepiolite n-ZrO2. Journal of the European Ceramic Society 33: 3379-3385.
- Liu S, Zhu J, Yang Q, Xu P, Ge J, et al. (2016) Facile fabrication and enhanced photocatalytic performance of Ag@AgCl-activated sepiolite heterostructure photocatalyst. J Mater Sci 51: 2565-2572.
- Alan N, ??çi S (2014) Surface modification of sepiolite particles with polyurethane and polyvinyl alcohol. Progress in Organic Coatings 77: 444-448.
- Eren E, Gumus H, Sarihan A (2012) An investigation of the catalytic decomposition of formic acid on raw and manganese oxide coated sepiolite surfaces. Applied Clay Science 62: 1-7.
- Tunç S, Duman O, Kanc? B (2012) Rheological measurements of Na-bentonite and sepiolite particles in the presence of tetradecyltrimethylammonium bromide, sodium tetradecyl sulfonate and Brij 30 surfactants. Colloids and Surfaces A: Physicochemical and Engineering Aspects 398: 37-47.
- Shi Z, Di Toro DM, Allen HE, Sparks DL (2013) A general model for kinetics of heavy metal adsorption and desorption on soils. Environ Sci Technol 47: 3761-3767.
- Shang J, Liu C, Wang Z, Zachara JM (2011) Effect of grain size on uranium(VI) surface complexation kinetics and adsorption additivity. Environ Sci Technol 45: 6025-6031.
- Soukup J, Jandera P (2014) Adsorption of water from aqueous acetonitrile on silica-based stationary phases in aqueous normal-phase liquid chromatography. J Chromatogr A 1374: 102-111.
- Mishra P, Uppara HP, Mandal B, Gumma S (2014) Adsorption and Separation of Carbon Dioxide Using MIL-53(Al) Metal-Organic Framework. Ind Eng Chem Res 53: 19747-19753.
- Wu Y, Luo H, Wang H, Zhang L, Liu P, et al. (2014) Fast adsorption of nickel ions by porous graphene oxide/sawdust composite and reuse for phenol degradation from aqueous solutions. Journal of Colloid and Interface Science 436: 90-98.
- Wu C, Zandavi SH, Ward CA (2014) Prediction of the wetting condition from the Zeta adsorption isotherm. Phys Chem Chem Phys 16: 25564-25572.
Citation: Jianshu Z, Liu S, Dinglong Z, Xiaoiao W (2019) Synthesis and Characterization of Modified Sepiolite for the Adsorptive Removal of Rhodamine B from Wastewater. J Nanotechnol Nanomed Nanobiotechnol 6: 023.
Copyright: © 2019 Zhang Jianshu, et al. This is an open-access article distributed under the terms of the Creative Commons Attribution License, which permits unrestricted use, distribution, and reproduction in any medium, provided the original author and source are credited.