System of Thermopuncture Diagnostics and Monitoring of Patients with Type 1 Diabetes
*Corresponding Author(s):
Valery MuzhikovMed Byte Ltd, 195220, St. Petersburg, Gzhatskaya Str. 5/3-139, Russian Federation
Tel:+7 9627228981,
Abstract
In this regard, it would be interesting to pay attention to the possibility of diagnosing and treating this disease from reverse the viewpoint of Traditional Chinese Medicine (TCM).
Methods/Design: In order to assess patterns of heat sensitivity thresholds of Acupuncture Channels (AC) in patients with T1D, the Akabane test was carried out on with 250 men and 309 women. For comparison, a group of healthy subjects made up of 116 men and 277 women was also used.
Results: Simple effects of paired comparisons between healthy subjects and T1D in groups of men and women, showed significant differences between heat sensitivity in healthy subjects and with patients T1D. The most significant differences are seen in the AC connected with the digestive system. In this case, the greatest diagnostic value is the level of asymmetry between the right and left branches of these AC, which varies in proportion to the level of glycemia. Changes in the AC are stable and precede the manifestation of the functional and organic disorders inherent in this disease. This dependence allows for early T1D diagnostics. Based on the regression analysis, a general model for the regulation of carbohydrate metabolism in these patients was developed. The presence of such a model allowed correcting the level of glycemia in patients with partially preserved B-cell function by targeted stimulation of the pancreas by heating two points SP4 and SP2 on the right side of the pancreas channel. This technique has been successfully tested in patients with T1D.
Conclusion: The combination of the Akabane test with the use of mathematical analysis in patients with T1D makes it possible to trace the entire chain of carbohydrate metabolism at an individual level and to identify the compensatory mechanisms for more effective therapeutic effects by the method of thermopuncture stimulation of certain AC.
Keywords
INTRODUCTION
In order to quantitatively evaluate a channel’s activity level in TCM, the so-called “sacrificial stick” test was used in ancient times in China. This test involved a burning sandal stick which was brought in proximity to points at the tips of every finger and toe until the first sensation of pain.
At each point, the pulse rate before pain was first felt was measured. If the number of pulse beats was lower than the average one for all the channels, it proved the hyperactivity of an acupuncture channel and its corresponding organ. On the other hand, when the rate was higher, it represented the inactivity of a channel and its corresponding organ. This test was described by the Japanese doctor K. Akabane in 1952 and since then, the test has carried his name.
In addition, we found that the effect of heating of 2 points (SP2 and SP4) on the right side gives effect on the reduction of glycemia due to targeted stimulation of the pancreas with in cases their partial preservation [9]. This effect on reducing the level of glycemia in patients was discovered by us back in 1998 [10]. During this time, we successfully treated patients with T1D using this method with the purpose of lowering the level of glycemia [11].
MATERIALS AND METHODS
The diagnosis of diabetes mellitus was confirmed on the basis of standard examination methods in a specialized endocrinology hospital clinic environment. Patients with polyneuropathy were excluded from the study. An analysis of capillary blood from the finger was carried out on all patients using an individual glucometer for sugar levels. The study included patients with a sugar level of 4 to 22 mmol/l. Total daily insulin doses was from 5 to 100 units per day.
For Akabane tests we used a special certified device “Merid” [12,13]. This test measures the pain thresholds in temperature sensitivity when heat is applied to the “entrance-exit” points of each channel (LU11, LII1, PC9, TE1, HT9, SI1, SP1, LR1, ST45, GB44, KI1 and BL67) by applying an impulse LED non-coherent IR-light onto the skin (f=1Hz, λ=920nM), with control the total energy expenditure in Joules. Each impulse radiates 0.07 Joule thermal energy.
Each channel consists of the left (l) and the right (r) branch between which symmetrical activity balance is maintained normal.
Temperature Sensitivity (TS) is our bodies’ basic reactive system; it is as significant as such important indicators as body temperature as it gives a very clear representation of functional and psycho-physiological profiles.
All data are presented as mean ± SEM. One-way MANOVAs followed by Bonferroni post hoc tests and testing simple effects were used to analyze the effect of gender (Males/Females) and of pathology factors (healthy people -Norm and patients with T1D) on the profiles of TS, with an evaluation of simple effects related to gender and pathology. In addition, the profiles of TS were compared using Mann-Whitney test. Statistical decisions were made at a significance level of 5% (?≤0.05). Data analysis was provided using software package SPSS Inc., V 15.
RESULTS
The reason for the beginning of research in this field was the observation of a patient with T1D. During testing in certain periods against a background of high hyperglycemia, it was noted that the right branches of the AC of the pancreas several times exceeded the value of the left one (Table 1).
| Sugar | ?? | LU | LI | PC | TE | HT | SI | SP | LR | ST | GB | KI | BL |
| 16.0mmol / l. | Right | 9 | 8 | 6 | 6 | 6 | 4 | 56 | 8 | 11 | 14 | 8 | 10 |
| Left | 5 | 7 | 6 | 5 | 5 | 4 | 14 | 25 | 8 | 7 | 10 | 9 | |
| 5.6mmol / l. | Right | 5 | 5 | 4 | 3 | 3 | 3 | 4 | 4 | 4 | 4 | 4 | 7 |
| Left | 6 | 2 | 3 | 2 | 3 | 3 | 5 | 3 | 6 | 6 | 6 | 9 |
Table 1: The Results of the Akabane test for high and low blood sugar in patients with T1D.
So, this test showed a marked imbalance in the points SP1 (SPr > SPl), LR (LRl > LRr), and blood sugar according to the control measurement was 16.0 mmol/l.
Below a test is shown for the same patient with T1D at the time of relative well-being after an insulin injection with normal blood sugar levels (5.6 mmol/l). In this case, the test scores for all diagnostic points are approximately equal and symmetrical. Thus, the results of this observation carried out back in 1997 allowed to believe that with the help of a thermopuncture test it is possible to effectively monitor the functional state of patients with diabetes [9,11].
Figure 1 shows the averaged test profiles at the level of 12 AC in patients and in healthy subjects. To do this, we summarized the indicators of the left and right branches for each channel. Based on the results of the comparison of the profiles of the patients with IDDM and of healthy subjects, some pronounced differences were found in both males and females. In this case, the most pronounced differences are cut off according to the parameters of the AC of the pancreas, liver and stomach.
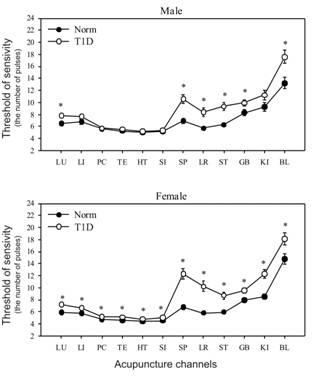
Table 2 shows the results obtained when the healthy subjects and those with T1D ?t the level of 12 AC were compared using Post hoc tests in MANOVA and the Mann-Whitney test.
| ?? | Male | Female | ||
| Post hoc tests | M-W test | Post hoc tests | M-W test | |
| LU | *** <0.001 | ** <0.003 | *** <0.001 | *** <0.001 |
| LI | 0.088 | * <0.014 | *** 0.001 | *** <0.001 |
| PC | 0.822 | 0.453 | ** <0.006 | 0.092 |
| TE | 0.26 | 0.348 | *** <0.001 | *** 0.001 |
| HT | 0.652 | 0.611 | ** <0.002 | * <0.021 |
| SI | 0.402 | 0.814 | *** <0.001 | **<0.002 |
| SP | *** <0.001 | * <0.018 | *** <0.001 | *** <0.001 |
| LR | *** <0.001 | 0.135 | *** <0.001 | *** 0.001 |
| ST | *** <0.0.001 | 0.53 | *** <0.001 | ** <0.006 |
| GB | *<0.023 | 0.582 | ** <0.003 | * <0.044 |
| KI | 0.07 | 0.435 | *** <0.001 | *** <0.001 |
| BL | ** <0.003 | 0.089 | * <0.011 | * <0.019 |
Main effects in 2X2 MANOVA are significant for both Gender, F (12.937) = 3.04, p<0.001, η2 = 0.04 and Diagnosis, F (12.937) = 5.78, p<0.001, η2 = 0.07. Interaction of factors diagnosis and gender did not show significance.
The most significant differences are noted for AC, associated with the gastrointestinal tract. In general, females showed greater differences than males.
The study at the level of 24 branches of 12 AC allowed revealing another important difference of T1D from the norm (Figure 2). It lies not only in the output of the TS channel series beyond the weighted average state, which is noted in the norm, but especially in the symmetry breaking between the left and right sides of some AC. The presence of high indices for the Akabane test means the hypofunction of the channel and the organ associated with it. Therefore, the more pronounced the asymmetry of the indicators of AC, the higher the degree of functional or organic disorders in a particular physiological system with which it is associated [9,14].
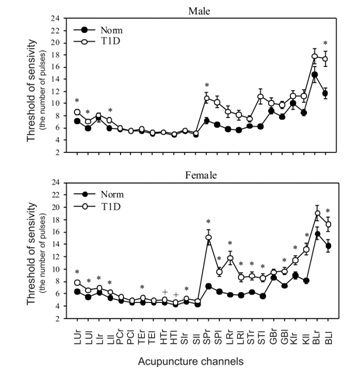
In addition to the presence of changes in the profile itself, in case of T1D attention should be paid to the presence of deviation (spread) of the indicators over various channels. The presence of such deviation indicates a significant role of the channel itself in leveling the manifestations of diabetes. The level of blood sugar changes - the indicators of AC change. Therefore, high values of deviation should be considered as a factor of compensation in the resistance of the organism to the unfavorable internal conditions. If there is no deviation through the channel, then this system does not participate in regulatory processes and has little prospect for corrective interventions.
| ?? | Male | Female | ||
| Post hoc tests | M-W test | Post hoc tests | M-W test | |
| LU r | **<0.006 | * <0.020 | *** <0.001 | *** 0.001 |
| LU l | *** 0.001 | ** <0.006 | *** <0.001 | *** <0.001 |
| LI r | 0.493 | 0.104 | ** <0.016 | *** 0.001 |
| LI l | * <0.010 | ** <0.005 | *** 0.001 | *** 0.001 |
| PC r | 0.761 | 0.292 | ** <0.006 | 0.137 |
| PC l | 0.933 | 0.755 | * <0.027 | 0.172 |
| TE r | 0.203 | 0.184 | *** <0.001 | *** 0.001 |
| TE l | 0.455 | 0.89 | * <0.028 | * <0.047 |
| HT r | 0.944 | 0.693 | ** <0.003 | * <0.030 |
| HT l | 0.38 | 0.639 | * <0.014 | 0.059 |
| SI r | 0.662 | 0.985 | ** <0.002 | * <0.012 |
| SI l | 0.25 | 0.608 | *** 0.001 | ** <0.006 |
| SP r | *** <0.001 | ** <0.007 | *** <0.001 | *** <0.001 |
| SP l | *** <0.001 | 0.368 | *** <0.001 | *** 0.001 |
| LR r | ** <0.002 | 0.149 | *** <0.001 | ** <0.006 |
| LR l | ** <0.003 | 0.422 | *** 0.001 | * <0.027 |
| ST r | * <0.046 | 0.758 | *** 0.001 | 0.189 |
| ST l | *** <0.001 | 0.908 | *** <0.001 | * <0.017 |
| GB r | 0.185 | 0.264 | 0.172 | 0.314 |
| GB l | * <0.010 | 0.25 | *** <0.001 | * <0.039 |
| KI r | 0.415 | 0.633 | * <0.012 | *** 0.001 |
| KI l | * <0.014 | 0.603 | *** <0.001 | *** 0.001 |
| BL r | 0.106 | 0.402 | * <0.034 | 0.192 |
| BL l | *** 0.001 | * <0.013 | * <0.019 | * <0.004 |
Note. * - p<0.05, ** - p<0.01, *** - p<0.001.
Main effects in 2X2 MANOVA are significant for both Gender, F (24.925) = 2.26, p=0.001, η2 = 0.06 and diagnosis, F (24.925) = 3.72, p<0.001, η2 = 0.09. Interaction of factors diagnosis and gender did not show significance.
Figure 3 shows TS profiles in T1D patients compared to males and females. For the eight branches of the AC, these differences are of great significance. In general, the asymmetry in females is more pronounced than in females not only in the AC of the digestive system, but also in the AC related to the cardiovascular system. The presence of high asymmetry TS between the branches of the AC with T1D at the root distinguishes their profile from the norm where the indices of all the right branches of the AC exceed the left ones by only 1-2% [9].
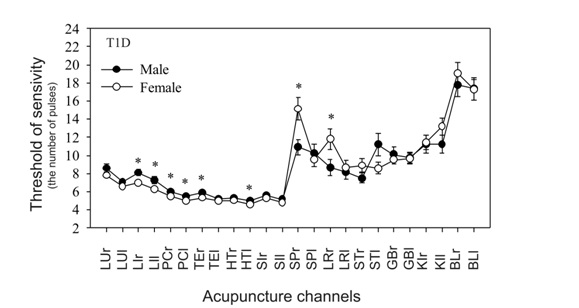
These differences in the predominantly right-sided hypofunction of the AC are also confirmed in more in-depth statistical analysis at the level of 24 branches of the AC (Table 4).
| AC | LU | LI | PC | TE | HT | SI | SP | LR | ST | GB | KI | BL | |
| Male | n=250 | > | > | > | > | > | > | > * | - | - | = | = | = |
| Female | n=309 | - | > | > | > | > | > | >(0.4) | > | = | = | - | >* |
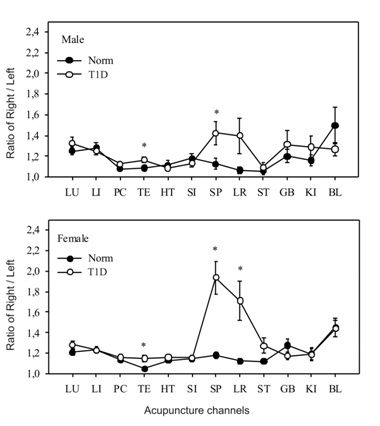
As a result of these observations, the most capacious information on the state of metabolic disturbances in the body can be obtained from the graph of the ratio of the right and left branches of the AC, which is presented in figure 4. This presentation of the information for each patient is important for his treatment, because in each case, the target channels for correction by stimulation method are visible.
| ?? | b | SE | t | p |
| constant | -0.545 | 0.268 | -2.033 | 0.053 |
| LUr | 0.254 | 0.123 | 2.054 | *0.050 |
| PCl | -0.387 | 0.170 | -2.272 | *0.032 |
| SPr | 0.553 | 0.151 | 3.645 | *** 0.001 |
*p < 0.05, **p < 0.01, ***p < 0.001, + – indicates the tendency to significance. The subscripts R and L indicate the right and the left branches of the AC, respectively. AC = acupuncture channel; b = regression coefficient; r- right branch AC; l- left branch AC.
LU- Lungs; PC-Pericardium; SP- Pancreas.
The level of concentration of endogenous insulin in the blood can be determined by the level of the C-peptide. The relationship of a number of AC with the level of the C-peptide of blood was analyzed (Table 6) in 35 patients with T1D.
| ?? | b | SE | t | p |
| constant | 0.226 | 0.503 | 0.450 | 0.658 |
| LUr | -0.385 | 0.946 | -0.407 | 0.689 |
| LIr | 3.065 | 0.830 | 3.690 | **0.002 |
| LIl | -3.357 | 1.175 | -2.854 | **0.011 |
| TEl | -2.893 | 1.403 | -2.061 | * 0.055 |
| THl | 0.443 | 1.562 | 0.283 | 0.780 |
| SIr | 2.360 | 1.119 | 2.108 | *0.051 |
*p < 0.05, **p < 0.01, ***p < 0.001. AC = Acupuncture Channel; b = regression coefficient; r- right branch AC; l- left branch AC.
LU- Llungs; LI- Large Intestine; TE- Triple Heater; TH- Heart; SI- Small Intestine.
According to the model, only the AC of the large intestine has the most reliable component linking it with the level of the C-peptide. It turns out that the growth of TS LIl reflects a decrease in the concentration of insulin, and the growth of TS LIr, on the contrary, reflects an increase in the level of insulin in the blood. Thus, it becomes clear why the growth of LIl promotes the growth of blood glucose level, because at the same time the concentration of endogenous insulin produced by B-cells is reduced.
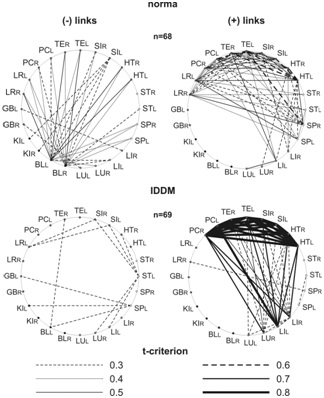
To assess the links of interchannel connections at the level of 24 branches, it is necessary to analyze the matrix with 24 x 24 parameters, which is quite difficult. For this analysis, we use a graphical construction system in the form of a specific profile for the link strength where the AC are located taking into account their inclusion in “5 primary elements”, according to TCM, and the thickness of the lines varies depending on the values of the t-criteria of the interchannel connections.
Figure 5 shows the structure of the interchannel connections at men in the norm and with T1D. Normally, all negative Yin (-) correlation connections originate from the AC KI and BL, and all positive (+) connections Yan occur mainly between the AC associated with the circulatory system. Normally, as a result of this construction, a dipole structure (+/-) with a proportion of the “golden section” (1.62) between the classical poles Yin and Yan is obtained [9,15]. Such a combination normally forms harmony in the body at the level of its bioenergetics, which according to ??? forms the “healthy body and healthy spirit”. With T1D, the negative pole of the dipole is weakly expressed and it moves to the SP level. At the same time, unusual expressing positive correlation signs between the AC of the cardiovascular system with the large intestine and the lung are noteworthy. Which confirms their important role in the formation of this pathology? Billions of bacteria that are sensitive to environmental factors live in LI. Their total biofield forms this energy of this. At T1D the expressed ligaments with the AC of the lungs reflect the presence of severe tissue hypoxia. The stronger these ties, the more pronounced oxygen hypoxia in the body. With each pathology, we see a certain pattern of such a matrix, according to which, as with a fingerprint, it is possible to diagnose various diseases and to see the individual features of the organism.
DISCUSSION
For patients with confirmed T1D and partially preserved pancreatic function in the regulation of carbohydrate metabolism, the most significant (R-SQ = 0.66) for practice regression model of relation with blood glucose levels was obtained, which is practically identical for men and women (Table 7).
| ?? | b | SE | t | p |
| constant | 0.226 | 0.503 | 0.450 | 0.658 |
| LUr | -0.385 | 0.946 | -0.407 | 0.689 |
| LIr | 3.065 | 0.830 | 3.690 | **0.002 |
| LIl | -3.357 | 1.175 | -2.854 | **0.011 |
| TEl | -2.893 | 1.403 | -2.061 | * 0.055 |
| THl | 0.443 | 1.562 | 0.283 | 0.780 |
| SIr | 2.360 | 1.119 | 2.108 | *0.051 |
*p < 0.05, **p < 0.01,***p < 0.001. AC = Acupuncture Channel; b = regression coefficient; r- right branch AC; l- left branch AC.
SP- pancreas; LR-Liver; ST-Stomach.
In this model, the right branch of the liver and pancreatic channel has the greatest positive influence vector on glycemic levels, the growth of which reflects the growth of glycemia.
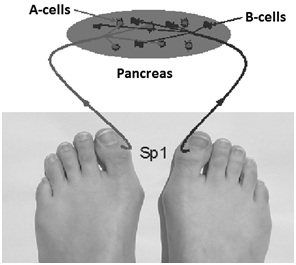
In contrast, the left branch of the pancreatic channel and the right branch of the gastric channel have a negative influence vector. Thus, there is a kind of carbohydrate balance, on one side of which with the positive communication vector, which significantly reflects the increase in the level of glucose in the blood, there are LR1r and SP1r diagnostic points, and in the other bowl there are SP1l and ST45r, whose growth also reliably reflects a decrease in glycemia. Which of the bowls will weigh - in that direction the nearest change in glycemia will be? At the same time, changes in TS occur faster than changes in blood sugar itself due to the inertness of this process due to the buffer properties of the blood itself. Based on these observations, it is logical to assume the following scheme of reflex connections to the pancreas (Figure 6), where the right diagnostic point of the SP channel reflects activity B-cells, and the left A-cells. At the same time, the asymmetric growth of SP parameters of the right branch of AC corresponds to the proportional hypofunction of B- cells, which leads to an increase in hyperglycemia.
In the event that in the course of several tests in the dynamics of observation the same monotonous indices are observed despite changes in blood sugar level - this indicates a complete loss of activity of B- cells of the pancreas to the production of endogenous insulin. In this case, we pay attention to other AC, which have a role in the formation of carbohydrate metabolism (liver, stomach, small intestine). Due to these systems, some compensatory mechanisms are included, and according to the test data in dynamics, they have the greatest spread of indicators (Figures 1-4). However, in such cases, the greatest practical importance is again the construction of the individual regression models, where by the maximal coefficient and the sign of influence the channels capable to minimize the level of glycemia are chosen for the subsequent regulatory impact. To confirm the hypothesis about the connection of diagnostic points SP1 with A and B pancreatic cells, of course additional studies are needed, but this hypothesis is confirmed in practice of treatment associated with a decrease in glycemia in patients with T1D.
Treatment
Future directions
In general, the future development of this technology is associated with the creation of individual devices based on the Akabane test, which have a connection to the server where the data is processed [13].
CONCLUSION
• The construction of individual regression models, ?valuation of correlation relationships and the test profiles in the dynamics of observations make it possible to identify the individual characteristics of each patient for his subsequent adequate therapy
• Based on the evaluation of the test profiles in the dynamics observation at patients with T1D in subgroup of patients with hypo function AC pancreas can be distinguished for its stimulatory reflex influence for decrease the level of glycemia
• In the formation of T1D an important role is played by AC Large intestine
DISCLOSURE STATEMENT
REFERENCES
- Lien AS, Jiang YD, Mou CH, Sun MF, Gau BS, et al. (2016) Integrative traditional Chinese medicine therapy reduces the risk of diabetic ketoacidosis in patients with type 1 diabetes mellitus. J Ethnopharmacol 191: 324-330.
- Cao F, Li T, Ha LJ, Shan CX, Zhi MJ, et al. (2016) Analysis of Compatibility Laws for Acupoint Selection of Acupuncture in Treating Diabetic Gastroparasis. Zhongguo Zhong Xi Yi Jie He Za Zhi 36: 549-552.
- Jiang ZC, Li H, Zhu B (2017) A potential mechanism underlying the effects of acupuncture on insulin resistance. Acupunct Med 35: 77.
- Wang YD, Liu ZC, Xu B (2014) [Efficacy observation of acupuncture and tapping therapy in the treatment of type 2 diabetes of yin deficiency pattern combined with stasis in the patients]. Zhongguo Zhen Jiu 34: 731-735.
- Hu H (1995) A review of treatment of diabetes by acupuncture during the past forty years. J Tradit Chin Med 15: 145-154.
- Martinez B, Peplow PV (2016) Treatment of insulin resistance by acupuncture: a review of human and animal studies. Acupunct Med 34: 310-319.
- Peplow PV (2015) Electroacupuncture treatment of insulin resistance in diabetes mellitus. Acupunct Med 33: 347-349.
- Akabane K (1956) Method of Hiraishin. Tokyo.
- Muzhikov V (2003) Introduction in energoskopia of m?n. Gopher Publishers, Amsterdam, Netherlands.
- Muzhikov VG (2001) Method for determining blood indexes and a device for embodying thereof. WO 2001045560 A1.
- Muzhikov VG, Lesogor V M, Reukov AS (200) System of Monitoring and Correction in the Rehabilitation of Patients Suffering from Diabetes Mellitus: Methodical recommendations for doctors by the Medico-Social Expert Bureau of the Ministry of Labour and Social Development of the Russian Federation. CBNTI, Russia.
- Muzhikov VG, Nozdrachev A D, Bogdanov NN (2005) Discrete Thermopuncture Test: Report 1. Reflexology 4: 23-28.
- Muzhikov VG (2010) Device for Reflex Correction of Functional Infringements of the Organism - Au2010100512. Australia.
- Muzhikov V, Vershinina E, Belenky V, Muzhikov R (2016) Significant heat sensitivity increase detected in various types of diabetes mellitus patients by Akabane test for use of management of diabetic patients. Acupunct Electrother Res 41: 1-19.
- Muzhikov VG The Way of estimation organism condition and increase vital activity. Russian Patent N 2198600.
- Boden G, Chen X, Urbain JL (1996) Evidence for a Circadian Rhythm of Insulin Sensitivity in Patients With NIDDM Caused by Cyclic Changes in Hepatic Glucose Production. Diabetes 45: 1044-1050.
- Cugini P, Di Palma L (2008) Cosint analysis: A procedure for estimating biological rhythms as integral functions by measuring the area under their best?fitting waveform profile. Biological Rhythm Research 25: 15-36.
- Muzhikov VG (2001) Theorie en praktijk von de invloed op de BAP-punten met gemoduleerde infraroodstraling. “Huang Ti” Nederlandse vereniging voor acupunctuur 1: 22-25.
Citation: Muzhikov V, Vershinina E, Muzhikov R (2017) System of Thermopuncture Diagnostics and Monitoring of Patients with Type 1 Diabetes. J Altern Complement Integr Med 3: 036.
Copyright: © 2017 Valery Muzhikov, et al. This is an open-access article distributed under the terms of the Creative Commons Attribution License, which permits unrestricted use, distribution, and reproduction in any medium, provided the original author and source are credited.