
The Effects of Age, Vowel, and Emotion for the Cortical Auditory Evoked Potentials
*Corresponding Author(s):
Jinsook KimDivision Of Speech Pathology And Audiology, Research Institute Of Audiology And Speech Pathology, College Of Natural Sciences, Hallym University, Chuncheon, Republic Of Korea
Tel:+82 332482213,
Email:jskim@hallym.ac.kr
Abstract
Background: The Cortical Auditory Evoked Potentials (CAEPs) were the obligatory components such as the P1, N1, P2, and N2. These components were sensitive to the acoustic features of speech stimuli and paralinguistic information such as the emotion that was loaded in voice. The purpose of this study was to analyze the effect of the parameters affected by the listeners’ cognitive status and attention such as emotion and age of meaningful vowel by evaluating the latencies and amplitudes of CAEP components.
Methods: 20 younger (mean: 22.1±1.72, range: 21-27) and 20 older (mean: 68.2±2.21, range: 65-74) adults with normal hearing participated. Pure tone audiometry was conducted to determine the normal hearing. All the participants were right-handed and had no history of neurological disorders. The responses of younger and older adults according to the vowels, /u/, /a/, and /i/ representing low, middle, and high frequencies with emotional saliences, neutral (N), anger (A), happiness (H), and sadness (S) were observed.
Results: The three main effects of age, vowel, and emotion showed significant differences. The emotions revealed a statistical difference in latencies of all CAEP components, P1 (p=0.024), N1 (p=0.000), P2 (p=0.000), and N2 (p=0.000). For A and H emotions, the shorter latencies for all the components and the larger amplitudes for P1 and N2 were noted. The N1 latency was significantly different depending on vowels showing the shortest latency in /u/ as 102.27ms. The older adults showed longer P2 latency (p=0.045) and the reduced N2 amplitude (p=0.000) significantly as compared to younger adults.
Conclusions: In the present study, vowel, emotion, and age showed effects influencing the values of the latencies and amplitudes of P1, N1, P2, and N2. The emotional salience yielded the statistical significance for all the latencies of CAEPs. The N1 latency was changed significantly by the vowel. Aging which evoked the cognitive changes affected P2 and N2 components significantly. Therefore, we could cautiously conclude that the endogenous factor was observed at all the CAEP components except P1 although it was a little hard to determine whether the nature of CAEP is endogenous, exogenous, or composite.
Keywords
Cortical auditory evoked potential; Emotion; Vowel; Age (3~10 yrs)
ABBREVIATIONS
A: Anger
CAEP: Cortical auditory evoked potential
H: Happiness
MMSE: Mini-Mental State Examination
N: Neutral
S: Sadness
VOT: Voice onset time
BACKGROUND
The Cortical Auditory Evoked Potential (CAEP) representing the electrical activity of the central auditory system, is composed of the major components of late latency responses such as the P1, N1, P2, and N2. They reflect the central auditory system and cognitive development through the synchronous firing among the neuronal ensemble, as well as the central auditory plasticity [1]. The CAEPs were classified as either cognitive or obligatory responses. The cognitive responses represented mostly endogenous aspects of the CAEPs which were further defined as the mismatch negativity and P300 elicited with an ‘odd-ball’ paradigm. For these responses, the listener’s ability was required for discriminating the different relevant stimulus features. In contrast, the obligatory CAEP, P1, N1, P2, and N2, dependent on the external stimuli and the integrity of the central auditory nervous system could be interpreted as the exogenous aspect. Although the CAEP was considered to be obligatory, it was not a unitary phenomenon, rather a series of temporally overlapping waveforms representing activity from various cortical sources. Their latency and amplitude were known to be affected by the listeners’ cognitive status and attention with a lesser extent than the endogenous component [2,3].
The CAEPs could be elicited by tone bursts, clicks and speech sounds. The larger and reliable amplitude of the P1, N1, and P2 components were reported exhibiting neural synchronous activity by the inherent of time-varying complexity of speech stimuli when using speech sounds such as Consonant-Vowel (CV) forms of monosyllables and simple words [4,5]. The monosyllabic and nonsense words were also investigated modulating sensory information such as Voice Onset Time (VOT) and frequencies of acoustic information, while meaningful words were used to elucidate the semantic information [6,7].
The CAEP components were sensitive to the acoustic features of speech stimuli. The larger amplitudes and longer latencies were noted with the lower frequency speech sound [8,9] and the larger amplitudes and shorter latencies were noted with the stronger intensity speech sound. Also, they were highly dependent on the context of the utilized stimuli, attention, and cognition of the various participants. For example, implying the endogenous nature of the components, the abnormal morphology, latency, and amplitude were reported with the natures of auditory processing disorder, learning disorder, language impairment, and autism [10-13]. However, the categorization of the CAEP components was not clearly defined between exogenous and endogenous characteristics thus far.
Further, paralinguistic information such as emotion was found to be an element factor influencing the components of CAEP other than just exogenous characteristics of the stimuli. The emotional salience was reported to play an important role in extracting the talker’s feelings as well as understanding the true sense of communication. For example, the P2 amplitude was observed to be larger in ‘happy’ compared to ‘sad’ emotions, explaining the higher spectral complexity and higher amount of energy of a ‘happy’ voice contributed to the larger amplitude of the P2 in one study [14]. The positive emotional valence during speech processing seemed to produce the larger P2 amplitude [15]. This phenomenon was further explained by several investigations of the CAEPs [16,17]. However, the difficulties for understanding the emotional facial expression in the autism spectrum disorder adolescents indicated non-sensitive responses of CAEP [18].
There were studies reviewing the association of impaired cognitive processing by aging with the affected neural synchrony in older adults, who may have had difficulty with understanding complex speech signals [19,20]. It was noted that the latencies were delayed with specific tonal stimuli and speech sounds as the age increased [21-23]. In studies using speech stimuli (/ba/ and /pa/), investigators reported that the P2 latency was delayed in older adults depending on the VOT as noticed from the voiced /b/ and voiceless /p/ [24,25]. Rufener et al., [26] also reported that the latencies of the N1 and P2 were delayed and the amplitude of P2 was reduced in older adults when an oddball paradigm was applied with German words and pseudo-words. The investigators reported that the CAEPs reflected the changes in the neural activity of the central auditory pathway by a person’s aging. However, the age-related differences of the CAEPs were known to be difficult to explore due to limited cognitive function in older people. To distinguish a normal range of the cognitive function of the aging, Mini-Mental State Examination (MMSE) which was developed by Bayne in 1998 as a brief objective measure [27] should be used as a screening tool for evaluating the cognitive status in both research and clinical practice.
The purpose of this study was to investigate the latencies and amplitudes of the CAEP components in younger and older adults according to the vowels, /u/, /a/, and/i/ representing low, middle, and high frequency, with the basic emotional saliences such as neutral (N), anger (A), happiness (H), and sadness (S). These were imported to determine the emotional effects of the vowel stimuli that could be defined as pure acoustic features otherwise. With these parameters, we tried to try to define the two categorizations of CAEP characteristics, exogenous and endogenous aspects, more specifically.
METHODS
20 younger (mean: 22.1±1.72, range: 21-27) and 20 older (mean: 68.2±2.21, range: 65-74) adults with normal hearing participated. The determination of younger and older adult groups followed the United Nations’ definition [28]. All the participants were determined the normality of health by questionnaire. Pure tone audiometry was conducted to determine the normal hearing thresholds from 500, 1000, and 2000 Hz with a GSI 61(Grason-Stadler, Eden Prairie) for both younger and older adult groups. All the participants were right-handed and had no history of neurological disorders. In addition, to rule out any possible major age-related cognitive impairment, the Korean version of MMSE was conducted to the preliminary participants for the older adult group. The participants who showed a score above 25 of MMSE were only included. As the MMSE targeted only to the older adults, the normality of the cognition for the younger adults was determined by the questionnaire.
The stimuli were the naturally produced /u/, /a/, and /i/ vowels which were recorded by native Korean with normal vocalization. The female voice was utilized in the experiment as it was considered to be the middle frequency between the child and male voices as identified and reviewed in the literature [29]. When the voice was recorded, a sentence including the target vowel was produced for consistent analysis of the vowel sound part. For example, the “I speak /i/” sentence was produced and recorded for the target vowel /i/ with production sustained for 2 seconds with the sampling rate of 48000Hz. The only well-recorded portion was extracted for the duration of 500ms out of 2 seconds to control the quality of the stimuli for the experiment. The normal vocalization was monitored by the Multi-Dimensional Voice Program (MDVP) (KeyPENTAXTM, Lincoln Park, NJ, USA) to identify the normal range of hoarseness and vibration of the production. Applying the four basic emotions, N, A, H, and S, to each vowel production, a total of 12 stimuli were composed and utilized for the experiment. To import emotions for vowel productions, the talker watched related emotional screens for 4 to 5 minutes prior to producing vowels, for allowing them to draw their empathy for the corresponding emotions except for the neutral emotion. 10 females (mean age: 21.9±2.11, range: 19-24) produced the three vowels with four emotional statuses for the selection of appropriate stimuli. Out of 10 female voices, the productions were carefully calculated for finding the mean frequency and intensity, and the closest mean frequency and intensity were selected as the stimuli (Table 1). To record and analyze the acoustic features, the main program of Computerized Speech Lab (CSL) (KayPENTAX™, Lincoln Park, NJ, USA) was utilized.
|
Vowel |
Emotions |
dB |
Acoustic features |
|||
|
F0 |
F1 |
F2 |
F2-F1 |
|||
|
/u/ |
Neutral |
57.03 |
214.54 |
481.45 |
4158.43 |
3676.98 |
|
Anger |
64.79 |
182.3 |
539.05 |
2869.2 |
2330.15 |
|
|
Happiness |
64.28 |
176.98 |
893.33 |
4047.75 |
3154.42 |
|
|
Sadness |
55.22 |
197.72 |
329.98 |
4416.64 |
4086.66 |
|
|
/a/ |
Neutral |
54.7 |
199.16 |
1284.56 |
3634.67 |
2350.11 |
|
Anger |
67.03 |
171.91 |
998.48 |
1607.09 |
608.61 |
|
|
Happiness |
65.12 |
174.56 |
910.49 |
1697.51 |
787.02 |
|
|
Sadness |
55.28 |
192.2 |
1519.93 |
3171.07 |
1651.14 |
|
|
/i/ |
Neutral |
51.3 |
225.98 |
364.09 |
2658.2 |
2294.11 |
|
Anger |
59.71 |
166.47 |
362.24 |
2612.48 |
2250.24 |
|
|
Happiness |
61.9 |
174.48 |
422.38 |
3307.85 |
2885.47 |
|
|
Sadness |
50.53 |
195.85 |
589.87 |
2803.62 |
2213.75 |
|
Table 1: Acoustic features of produced vowel stimuli according to emotions.
The confusion matrix was evaluated to examine how the produced vowels effectively discriminated according to the corresponding emotions. For this evaluation, 10 young adults, 5 males, and 5 females (mean age: 23.8±1.7) participated in confusion matrix analysis. The participants were asked to identify the emotions that they thought they had heard. Then their selections were matched for the correct emotions provided (Table 2). The matrices indicated that the produced vowels were relevant to distinguish the corresponding emotion revealing 68-100% correction probability.
|
Vowel |
Emotion |
Neutral |
Anger |
Happiness |
Sadness |
Other |
|
/u/ |
Neutral |
46(92%) |
- |
- |
4(8%) |
- |
|
Anger |
7(14%) |
34(68%) |
1(2%) |
8(16%) |
- |
|
|
Happiness |
1(2%) |
1(2%) |
4(90%) |
2(4%) |
1(2%) |
|
|
Sadness |
- |
- |
- |
50(100%) |
- |
|
|
/a/ |
Neutral |
48(96%) |
- |
- |
2(4%) |
- |
|
Anger |
5(10%) |
40(80%) |
3(6%) |
2(4%) |
- |
|
|
Happiness |
3(6%) |
- |
45(90%) |
2(4%) |
- |
|
|
Sadness |
3(6%) |
- |
1(2%) |
44(88%) |
2(4%) |
|
|
/i/ |
Neutral |
49(98%) |
- |
- |
1(2%) |
- |
|
Anger |
- |
37(74%) |
13(26%) |
- |
- |
|
|
Happiness |
- |
1(2%) |
49(98%) |
- |
- |
|
|
Sadness |
6(12%) |
- |
3(6%) |
41(82%) |
- |
Table 2: Confusion matrix for discriminant analysis of the emotional salience.
The Bio-logic Navigator Pro System (Natus, Mundelin, IL, USA, serial number:13L07110T) was utilized as an experimental instrument. The vowel sounds recorded and saved as ‘WAV’ file in the laptop (Microsoft Windows, Version 6.1.7601) and this laptop was connected to the Bio-logic Navigator Pro System for loading sound files. The stimuli were monaurally presented by Etymotic Research (ER3A) insert earphones which were plugged in the Bio-logic Navigator Pro System at the intensity level of 70dBnHL into the right ear. The electrode array was conformed to a standardized international 10-20 system [30]. To analyze CAEPs, the bipolar channel was used with channel A for measuring evoked responses and channel B for monitoring eye movement and blinking. For the channel A, the reference electrode was placed at the right mastoid, the active electrode was placed at the vertex, and the common ground electrode was placed at the forehead. For the channel B, the reference electrode was placed at the infraorbital and the active electrode was placed at the supraorbital. The impedances were kept below 5kΩ for all the electrodes. The test parameters were set up at a sweep at 200, a rate of 1.1, an insert delay at 0.8, a sampling rate at 640Hz, a gain at 50K and 10K of channels A and B, a polarity at alternative, and a bandpass filter from 1 to 30 Hz. For the experiment, each participant was comfortably seated in a bed for the recording of the CAEP in a quiet environment. All the processes were conducted in the audiological experimental laboratory of Hallym University where the well-equipped audiological evaluation devices could be provided. The independent variables were the three vowels, /u/, /a/, and /i/, four emotions, N, A, H, and S, and two age groups. The dependent variables were the latencies and amplitudes of the CAEPs. The three-way ANOVA was utilized for the statistical analysis at the significant level of 0.05.
RESULTS
The grand average waveforms elicited by /u/, /a/, and /i/ vowels with emotional statuses for both age groups were displayed (Figure 1). The significant main effects of the study were prominently observed with the emotional variable and were sporadically observed with the age and vowel variables depending on the CAEP components (Table 3).
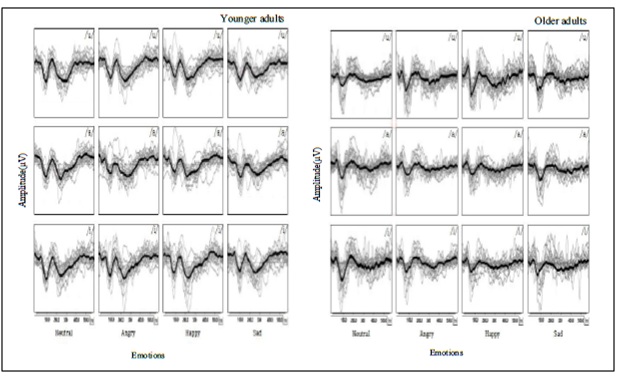 Figure 1: The total and grand mean waveforms were depicted in grey and black elicited by vowels, /u/, /a/, and /i/, with 4 emotional statuses according to the age groups. The left indicates the younger adults’ and the right indicates the older adults’ waveforms.
|
|
Emotion (3, 108) |
|
Vowel (2, 72) |
|
Age (1, 36) |
||||
|
F |
p |
F |
p |
F |
p |
||||
|
P1 |
Latency |
3.278 |
.024* |
2.845 |
0.065 |
3.732 |
0.062 |
||
|
Amplitude |
3.611 |
.016* |
0.294 |
0.705 |
3.021 |
0.091 |
|||
|
N1 |
Latency |
9.269 |
.000* |
3.659 |
.031* |
0.293 |
0.592 |
||
|
Amplitude |
0.546 |
0.606 |
0.138 |
0.774 |
0.398 |
0.588 |
|||
|
P2 |
Latency |
11.136 |
.000* |
2.13 |
0.126 |
4.303 |
.045* |
||
|
Amplitude |
0.199
|
0.864
|
2.342 |
0.121 |
0.024
|
0.877 |
|||
|
N2 |
Latency |
6.681 |
.000* |
0.479 |
0.621 |
1.881 |
0.179 |
||
|
2.165 |
0.112 |
||||||||
|
Amplitude |
8.111 |
.000* |
93.933 |
.000* |
|||||
Table 3: The main effects of vowel, emotion, and age variables depending on the latency and amplitude of CAEP components. The parentheses include the degree of freedom and error-freedom of the main effects.
The emotions revealed a statistical difference in latencies of all the CAEP components and amplitudes of P1 and N2. The mean values of P1 latency according to emotions were 53.98, 53.85, 54.60, and 58.37ms for N, A, H, and S which showed a statistical significance [F(3,108) = 3.278, p < .05]. The Bonferroni corrected post hoc analysis of P1 latency revealed that there was a significant difference between A and S. The mean values of N1 latency according to emotions were 105.87, 101.39, 99.73, and 108.90ms for N, A, H, and S which showed a statistical significance [F(3, 108) = 9.269, p < .05]. The Bonferroni corrected post hoc analysis of N1 latency revealed that there were significant differences between N and H, S and A, and S and H. The mean values of P2 latency according to emotions were 166.86, 158.89, 157.98 and 170.44ms for N, A, H, and S which showed a statistical significance [F(3, 108) = 11.136, p < .05]. The Bonferroni corrected post hoc analysis of P2 latency revealed that there were significant differences between N and A, N and H, S and A, and S and H. The mean values of N2 latency according to emotions were 243.89, 239.51, 227.54, and 242.30ms for N, A, H, and S which showed a significant significance [F(3, 108) = 6.681, p < .05]. The Bonferroni corrected post hoc analysis of N2 latency revealed that there were significant differences between H and the rest of the emotions (Figure 2).
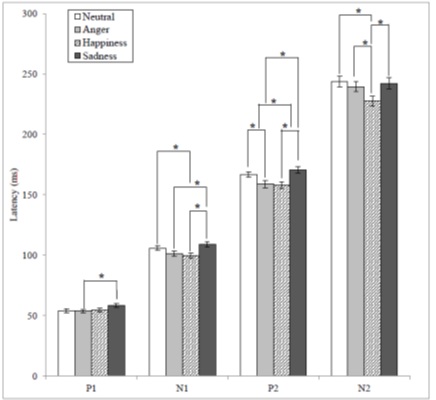 Figure 2: The mean latency values for CAEP components according to emotional statuses and significant differences depending on the Bonferroni corrected post hoc analyses (* = p < .05).
The mean values of P1 amplitude according to emotions were 1.18, 1.27, 1.36, and 1.13µV for N, A, H, and S which showed a statistical significance [F(3, 108) = 3.611, p < .05], but the Bonferroni corrected post hoc analysis of P1 amplitude did not reveal any significant difference. The mean values of N2 amplitude according to emotions were - 1.53, - 1.67, -1.68, and - 1.35µV for N, A, H, and S which showed a statistical significance [F(3, 108) = 8.111, p < .05]. The Bonferroni corrected post hoc analysis of N2 amplitude revealed that there were significant differences between S and A and S and H (Figure 3).
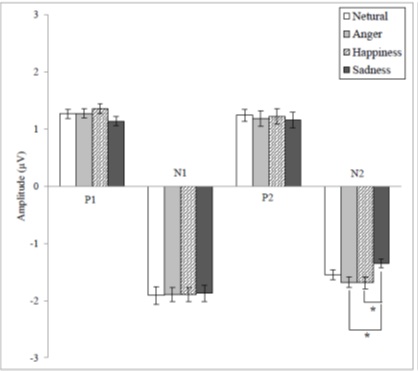 Figure 3: The mean amplitude values for CAEP components according to emotional statuses and significant differences depending on the Bonferroni corrected post hoc analyses (* = p < .05).
Out of the latencies and amplitudes of all the CAEP components, only the N1 latency showed a statistical significance with the mean values of 102.27, 106.13, and 103.51ms for /u/, /a/, and /i/ [F(2, 72) = 3.659, p < .05]. The Bonferroni corrected post hoc analysis of N1 latency revealed that there was a significant difference between/u/ and /a/ (Figure 4).
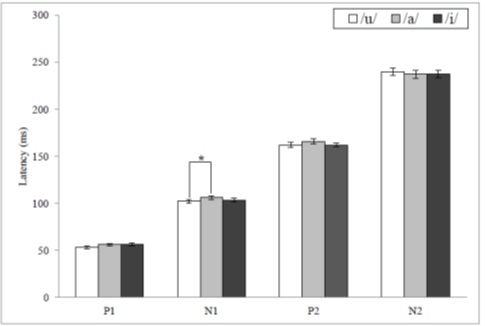
Figure 4: The mean latency values for CAEP components according to vowels and a significant difference depending on the Bonferroni corrected post hoc analyses (* = p < .05).
The P2 latency and N2 amplitude showed statistical significance when compared between the younger and older adults. The mean values of P2 latency for the younger and the older adults were 159.14, and 167.95ms which showed a statistical significance [F(1, 36) = 4.303, p < .05] (Figure 5).The mean values of N2 amplitude for the younger and the older adults were - 2.31 and - 0.80µV which showed a statistical significance [F(1, 36) = 93.993, p < .05] (Figure 6). When compared to the younger adults, a 65.37 % reduction of N2 amplitude was observed in older adults.
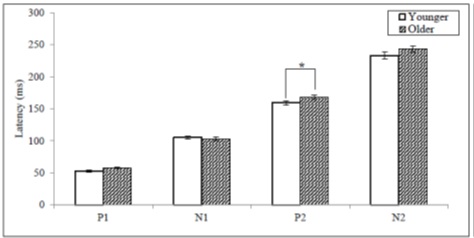
Figure 5: The mean latency values for CAEP components between the younger and older adult groups (* = p < .05).
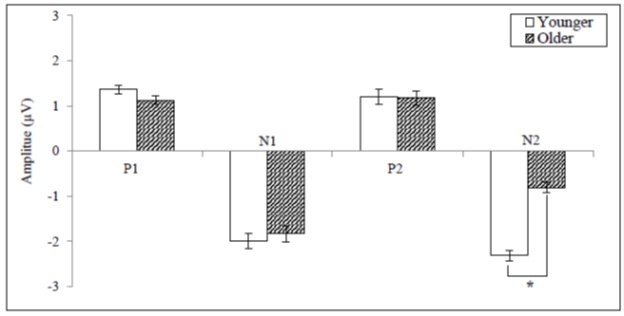
Figure 6: The mean amplitude values for CAEP components between the younger and older adult groups (*= p < .05).
The interaction effects revealed sporadic statistical significance for vowel with emotion, vowel with age, emotion with age, and vowel with emotion and age. The vowel with emotion interaction effect was significantly different at N1 amplitude and P2 latency. The vowel with age interaction was significantly different at N2 amplitude. The emotion with age interaction was significantly different at N2 latency. The vowel with emotion and age interaction was significantly different only at N2 amplitude (Table 4) (Figure 7) (Figure 8).
|
|
Vowel×Emotion |
Vowel×Age |
Emotion×Age |
Vowel× Emotion× Age |
|
|
P1 |
Latency |
.961? |
0.192 |
0.664 |
.569? |
|
Amplitude |
0.102 |
.322? |
0.565 |
0.087 |
|
|
N1 |
Latency |
0.092 |
0.111 |
0.654 |
0.529 |
|
Amplitude |
.002* |
.278? |
.861? |
0.654 |
|
|
P2 |
Latency |
.017* |
0.093 |
0.323 |
0.88 |
|
Amplitude |
0.14 |
0.418 |
.266? |
0.782 |
|
|
N2 |
Latency |
0.83 |
0.175 |
.013* |
0.232 |
|
Amplitude |
0.075 |
.005* |
.720? |
.018*? |
|
α Greenhouse-Geisser value.
*p < .05
Table 4: The interaction effects of vowel, emotion, and age variables depending on the latency and amplitude of CAEP components.
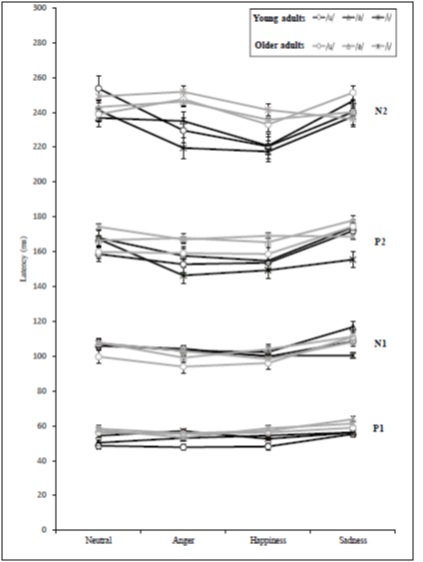
Figure 7: The mean latency values for CAEP components according to vowel, motion, and age variables.
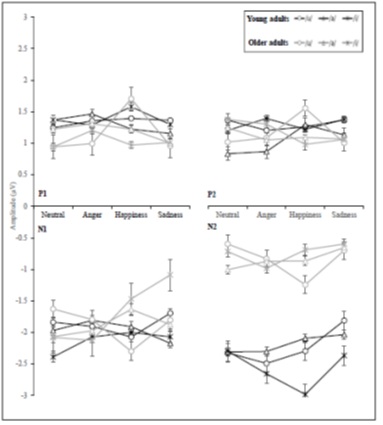
Figure 8: The mean amplitude values for CAEP components according to vowel, motion, and age variables.
DISCUSSION
In the present experiment, all the latencies of the CAEP components revealed significant differences according to emotions, N, A, H, and S with longer latencies in the N and S and shorter latencies in the A and H. A and H emotions tend to have stronger energy and higher pitch when compared to N and S emotions as those were situated opposite to each other in the pleasure axis and could be characterized exaggerated hyper articulation [31]. Although the most of investigations reported the systematic amplitude increase in linear fashion as the intensity of stimuli increased until the moderate to high intensity [32], it was reported that A and H emotions revealed significantly shorter latencies for all the components of CAEP, P1, N1, P2, and N2, and significantly larger amplitudes for P1 and N2 in this experiment. P1 latency was reported the most exogenous factor of all the components and the difference appeared very little in the post-analysis comparing to other components. Recently, one study reported that the latency decreased significantly and the amplitude was partially increased without a statistical significance at the P1, N1, and P2 as the intensity of the speech stimuli increased [33]. Therefore, the shorter latencies of A and H emotions of the present study could be considered to be somewhat under the influence of the acoustic features of stimuli. But the results were not completely identical to the outcomes found depending on the intensity of stimuli. Another explanation for shorter latencies for all the components of CAEP following A and H stimuli of the present study could be found at the active electrode placement at Cz of the electrode montage. It was reported that the cortical regions were more medially stimulated with the higher frequency stimulation and usually revealed shorter latencies with the active electrode placement at Cz regardless of single- or multi-channel recordings [8,34]. Therefore, we can conclude that the listeners’ status and attention which were affected by the emotion loaded on voice played a role in changing latencies of most of the components of CAEP.
There were several investigations that revealed the larger P2 amplitudes for adjectives and nouns with the positive emotional saliences [15,16]. The larger amplitude of P2 was observed with the positive adjectives and nouns during speech processing, explaining the contribution of the higher spectral complexity and higher amount of energy of a positive voice. Out of those results, however, the P2 amplitude was not affected by the stimuli when the word did not have meaning [17]. As this experiment used pure short vowels as stimuli, the meaning could not be identified easily and, therefore, the larger P2 amplitude could not be found. Instead, the larger amplitudes were revealed for P1 without a statistical significance and N2 with a statistical significance with A and H emotions in this experiment. This could be also interpreted as the endogenous effect other than their acoustic features of the stimuli. One investigation reported that the P1 and N2 amplitudes were larger with the unfamiliar sound stimuli in 6 to 7years old children [35]. As an emotion was found to be the hardest to define at the confusion matrix for the discriminant analysis in this experiment and possibly H emotion was known to have the larger bounds of energy for both intensity and frequency, the stimuli with A and H emotions could have been unfamiliar sound stimuli. This was thought to be one of the reasons for revealing the larger P1 and N2 amplitudes of the unknown stimuli.
Dissimilar results from the previous studies on the CAEPs for both latency and amplitude depending on the emotional saliences, especially the significant changes of latencies for all the CAEP components and the inclusion of N2 that was considered as the endogenous component in the significant changes for both latency and amplitude of the present experiment lead us to the speculation of the following. The emotional valence of the stimuli might have revealed a definite effect to other than the effect of stronger intensity and the higher frequency of A and H out of various acoustic features. As this experiment utilized the naturally spoken vowel stimuli, the modulation of the acoustic properties was adopted with the speaker’s emotional changes from neutral to certain emotional statuses. Since the naturally spoken stimuli were the materials we wanted to utilize for this experiment, the uncontrolled intensities of the stimuli might be the limitation of this study. Considering this limitation, it is a little hard to determine that the CAEP components’ natures are endogenous, exogenous, or composite. But we could cautiously conclude that the endogenous factor is predominant to all the CAEP components except the P1, especially to the latency.
The N1 latency was reported to be changed by different vowels in several investigations [36-38]. The latency, amplitude, and source of locations of the N1 component differed depending on vowels. Especially both N1 latency and source location as well as their interaction reflected the properties of speech stimuli. The spectral dissimilarities of the speech were preserved in a cortical representation and yielded the pattern of the spatial configuration of the N1 in the study of auditory magnetic fields. Although we did not measure the topographic index of vowels, the N1 latency showed a statistical significance reflecting the distance of locations for vowel perception in the human auditory cortex. As the vowel /a/ and /i/ showed more distant source locations than the more similar vowels, /i/ and /e/ in German [37], our results showed the similar results. The longest latency was obtained in /a/ with 106.13ms and the shorter latencies of two vowels, /i/ and /u/, with 102.27 and 103.51ms were yielded. Additionally, N1 latency showed a significant difference in the interaction of emotion with age and N1 amplitude and P2 latency showed a significant difference in the interaction of vowel with emotion, implying the strong emotional effect on the interaction effect.
As the age-related CAEPs were known to be difficult to explore due to the limited cognitive function, this study adopted MMSE to distinguish a normal range of the cognitive function of the aging. Although some of the discrepancies were found about aging effects among investigations, it was generally noted that the P2 latency was delayed with aging [24,26]. However, there were some investigations recording shorter and unchanged P2 latencies with the advanced age [39-41]. While the amplitudes of P1 and N1 seemed not affected by aging proving fair resistance to neurobiological aging in the older group [42,43], the N2 component was not recorded sufficiently to extract the agreement. One study reported that the reduced N2 amplitude in older adults when the investigation was performed to find the differential effects of auditory and visual sensory aging [44]. The results of the present experiment showed significant differences in P2 latency and N2 amplitude. The noted prolonged P2 latency could be the result of the decreased neural transmission speed due to the diminished myelination as well as a longer period required for recovering to the initial excitation before neurons were able to fire again. This refractory issue might have affected the synchronized neural activity of critical time-varying speech in older adults. The most pronounced observation of the present experiment was found in the N2 amplitude showing 65.37% reduction with the older adult group. Implying the sensory processing disconnection from perception due to sleeping and the under-developed inhibitory capacities in younger ages, the larger N2 amplitude was observed in young sleeping subjects [1]. Therefore, the reduced N2 amplitude was understood as the substantial inhibitory control in older adults. As the older adults required more inhibitory control and possessed decreased neural synchronization, it was noted that the N2 amplitude could have been substantially affected with aging. The age effects of the CAEP components were thought to reflect the delayed perceptual and cognitive processing as well as inhibitory functions including thalamocortical projections and primarily associated areas of the auditory cortex. The N2 component was also found to be significant in the interactive effect of this experiment. When the age variable was included such as vowel with age and vowel with emotion and age, the amplitude showed the significance. The latency of N2 was also affected by the interaction of the emotion with age. Conclusively, the age variable influenced remarkably in the interaction effects, but the P1 which was considered the most exogenous component was not significant for any effect of the interactions of variables. Additionally, the attenuated N2 amplitudes were observed frontally with advancing age at multi-channel analysis [21]. The author also explained that the activated distribution of the older adults might be the result of the neural network of recruitment of the neighboring neurons with compensatory strategies. Therefore, the multi-channel measurements might be more appropriate for analyzing the aging effect of the CAEPs.
CONCLUSIONS
In the present study, vowel, emotion, and age showed effects influencing the values of the latencies and amplitudes of P1, N1, P2, and N2.The emotional salience yielded the statistical significance for all the latencies of CAEPs. The N1 latency was changed significantly by the vowel. Aging which evoked the cognitive changes affected P2 and N2 components significantly. Therefore, we could cautiously conclude that the endogenous factor was observed at all the CAEP components except P1 although it was a little hard to determine whether the nature of CAEP is endogenous, exogenous, or composite.
DECLARATIONS
Ethics approval and consent to participate
This study was approved by the Institutional Review Board of the Hallym University (HIRB-2017-099). Consent to participate in this study was obtained from each individual participant.
Consent for publication
Not applicable.
Availability of data and materials
The datasets used and/or analyzed during the current study are available from the corresponding author on reasonable request.
Competing interests
The authors declare that they have no competing interests.
FUNDING
Not applicable.
AUTHOR’S CONTRIBUTIONS
SL contributed to the acquisition, analysis, interpretation of the data and revising the manuscript. JY contributed to the conception of the research project, research designing, and drafting and revising the manuscript. WN contributed to the research design and acquisition of the data. HS contributed to the research design and acquisition of the data. WH contributed to the conception of the research project, research design and plan and acquisition of the data. JK is the corresponding author and contributed to the conception of the research project, research design, plan and analysis of the data, and drafting and revising of the manuscript. All authors read and approved the final manuscript.
ACKNOWLEDGEMENTS
None.
REFERENCES
- Ceponiene R, Rinne T, Näätänen R (2000) Maturation of cortical sound processing as indexed by event-related potentials. Clin Neurophysiol 113: 870-882.
- Purdy SC, Kelly AS, Thorne PR (2001) Auditory evoked potentials as measures of plasticity in humans. Audiol Neurotol 6: 211-215.
- Wunderlich JL, Cone-Wesson BK, Shepherd R (2006) Maturation of the cortical auditory evoked potential in infants and young children. Hear Res 212: 185-202.
- Ceponiene R, Shestakova A, Balan P, Alku P, Yiaguchi K, et al. (2001) Children's auditory event-related potentials index sound complexity and “speechness.” Int J Neurosci 109: 245-260.
- Tiitinen H, Virtanen J, Ilmoniemi RJ, Kamppuri J, Ollikainen M, et al. (1999) Separation of contamination caused by coil clicks from responses elicited by transcranial magnetic stimulation. Clin Neurophysiol 110: 982-985.
- Friesen LM, Tremblay KL (2006) Acoustic change complexes recorded in adult cochlear implant listeners. Ear Hear 27: 678-685.
- Wagner M, Roychoudhury A, Campanelli L, Shafer VL, Martin B, et al. (2006) Representation of spectro-temporal features of spoken words within the P1-N1-P2 and T-complex of the auditory evoked potentials (AEP). Neurosci Lett 614: 119-126.
- Agung K, Purdy SC, McMahon CM, Newall P (2006) The use of cortical auditory evoked potentials to evaluate neural encoding of speech sounds in adults. J Am Acad Audiol 17: 559-572.
- Wunderlich JL, Cone-Wesson BK (2001) Effects of stimulus frequency and complexity on the mismatch negativity and other components of the cortical auditory-evoked potential. J Acoust Soc Am 109: 1526-1537.
- Bomba MD, Pang EW (2004) Cortical auditory evoked potentials in autism: a review. Int J Psychophysiol 53: 161-169.
- Ceponiene R, Cummings A, Wulfeck B, Ballantyne A, Townsend J (2009) Spectral vs. temporal auditory processing in specific language impairment: a developmental ERP study. Brain Lang 110: 107-120.
- Cunningham J, Nicol T, Zecker S, Kraus N (2000) Speech-evoked neurophysiologic responses in children with learning problems: development and behavioral correlates of perception. Ear Hear 21: 554-568.
- Sharma M, Purdy SC, Kelly AS (2014) The contribution of speech-evoked cortical auditory evoked potentials to the diagnosis and measurement of intervention outcomes in children with auditory processing disorder. Semin Hear 35: 51-64.
- Spreckelmeyer KN, Kutas M, Urbach T, Altenmüller E, Münte TF (2009) Neural processing of vocal emotion and identity. Brain Cogn 69: 121-126.
- Pinheiro AP, Rezaii N, Nestor PG, Rauber A, Spencer KM, et al. (2016) Did you or I say pretty, rude or brief? An ERP study of the effects of speaker’s identity on emotional word processing. Brain Lang 153: 38-49.
- Herbert C, Kissler J, Junghöfer M, Peyk P, Rockstroh B (2006) Processing of emotional adjectives: Evidence from startle EMG and ERPs. Psychophysiology 43: 197-206.
- Kanske P, Kotz SA (2007) Concreteness in emotional words: ERP evidence from a hemifield study. Brain Res 1148: 138-148.
- Wagner JB, Hirsch SB, Vogel-Farley VK, Redcay E, Nelson CA (2013) Eye-tracking, autonomic, and electrophysiological correlates of emotional face processing in adolescents with autism spectrum disorder. J Autism Dev Disord 43: 188-199.
- Frisina DR, Frisina RD (1997) Speech recognition in noise and presbycusis: relations to possible neural mechanisms. Hear Res 106: 95-104.
- Schneider BA, Pichora-Fuller MK (2001) Age-related changes in temporal processing: implications for speech perception. Semin Hear 22: 227-240.
- Anderer P, Semlitsch HV, Saletu B (1996) Multichannel auditory event-related brain potentials: effects of normal aging on the scalp distribution of N1, P2, N2 and P300 latencies and amplitudes. Electroencephalogr Clin Neurophysiol 99: 458-472.
- Cunningham J, Nicol T, Zecker S, Kraus N (2000) Speech-evoked neurophysiologic responses in children with learning problems: development and behavioral correlates of perception. Ear Hear 21: 554-568.
- Iragui VJ, Kutas M, Mitchiner MR, Hillyard SA (1993) Effects of aging on event?related brain potentials and reaction times in an auditory oddball task. Psychophysiology 30: 10-22.
- Tremblay KL, Piskosz M, Souza P (2003) Effects of age and age-related hearing loss on the neural representation of speech cues. Clin Neurophysiol 114: 1332-1343.
- Tremblay KL, Piskosz M, Souza P (2002) Aging alters the neural representation of speech cues. Neuroreport 13: 1865-1870.
- Rufener KS, Liem F, Meyer M (2004) Age?related differences in auditory evoked potentials as a function of task modulation during speech-nonspeech processing. Brain Behav 4: 21-28.
- Brayne C (1998) The mini-mental state examination, will we be using it in 2001? Int J Geriatr Psychiatry 13: 285-290.
- Definition of an older or elderly person. World Health Organization. 2014.
- Peterson GE, Barney HL (1952) Control methods used in a study of the vowels. J Acoust Soc Am 24: 175-184.
- Nuwer MR (1987) Recording electrode site nomenclature. J Clin Neurophysiol 4: 121-133.
- Tato R, Santos R, Kompe R, Pardo JM (2002) Emotional space improves emotion recognition” In 7th Int. Conf. on Spoken Language Processing, ICSLP 2002.
- Hall JW (2007) New handbook of auditory evoked responses. Pearson Boston, 2007.
- Prakash H, Abraham A, Rajashekar B,Yerraguntla K (2016) The Effect of Intensity on the Speech Evoked Auditory Late Latency Response in Normal Hearing Individuals. J Int Adv Otol 12: 67-71.
- Yetkin FZ, Roland PS, Christensen WF, Purdy PD (2004) Silent functional magnetic resonance imaging (FMRI) of tonotopicity and stimulus intensity coding in human primary auditory cortex. Laryngoscope 114: 512-518.
- Kuuluvainen S, Leminen A, Kujala T (2016) Auditory evoked potentials to speech and nonspeech stimuli are associated with verbal skills in preschoolers. Dev Cogn Neurosci 19: 223-232.
- Diesch E, Luce T (2000) Topographic and temporal indices of vowel spectral envelope extraction in the human auditory cortex. J Cogn Neurosci 12: 878-893.
- Obleser J, Elbert T, Lahiri A, Eulitz C (2003) Cortical representation of vowels reflects acoustic dissimilarity determined by formant frequencies. Cogn Brain Res 15: 207-213.
- Obleser J, Lahiri A, Eulitz C (2004) Magnetic brain response mirrors extraction of phonological features from spoken vowels. J Cogn Neurosci 16: 31-39.
- Spink U, Johannsen HS, Pirsig W (1979) Acoustically evoked potential: dependence upon age. Scand Audiol 8: 11-14.
- Amenedo E, Díaz F (1998) Effects of aging on middle-latency auditory evoked potentials: a cross-sectional study. Biol Psychiatry 43: 210-219.
- Brown WS, Marsh JT, LaRue A (1983) Exponential electrophysiological aging: P3 latency. Electroencephalogr Clin Neurophysiol 55: 277-285.
- Alain C, Snyder JS (2008) Age-related differences in auditory evoked responses during rapid perceptual learning. Clin Neurophysiol 119: 356-366.
- Lindenberger U, Scherer H, Baltes PB (2001) The strong connection between sensory and cognitive performance in old age: not due to sensory acuity reductions operating during cognitive assessment. Psychol Aging 16: 196.
- Ceponiene R, Westerfield M, Torki M, Townsend J (2005) Modality-specificity of sensory aging in vision and audition: evidence from event-related potentials. Brain Res 1215: 53-68.
Citation: Lee S, Yun J, Na W, Song H, Han W, et al. (2019) The Effects of Age, Vowel, and Emotion for the Cortical Auditory Evoked Potentials. J Otolaryng Head Neck Surg 5: 38
Copyright: © 2019 Seungwan Lee, et al. This is an open-access article distributed under the terms of the Creative Commons Attribution License, which permits unrestricted use, distribution, and reproduction in any medium, provided the original author and source are credited.

