The Impact of Carbon Tax Policy on Tuberculosis Outcomes in South Africa
*Corresponding Author(s):
Cyprian M MostertAga Khan University, Brain And Mind Institute, The United Kingdom, Kenya, Pakistan
Email:cypri2003@gmail.com
Abstract
Objective
The South African Government set out ambitious targets to tackle climate change through the implementation of a carbon tax policy in 2019. The carbon tax policy is aimed at reducing carbon emissions and improving access to clean household electricity. This paper investigates the impact of carbon tax policy on tuberculosis outcomes in South Africa.
Methods
This paper used the One-Health Tool to model the budget impact arising from the carbon tax revenue and assess how it will influence TB outcomes until 2045. The study focus on the populations of two working age groups: Youth (25-34 years) and adults (35-44 years).
Findings
The results show that the carbon tax policy will reduce TB mortality by 2.6 percent (on average) in the youth population. This positive outcome will spill over to HIV-TB co-infections resulting in a 1.9 percent average decrease in mortalities. In the adult population, carbon tax policy will reduce TB mortality by an average of 1.5 percent. This epidemiological outcome will spill over to HIV-TB co-infections causing a further 1.1 percent average decrease in mortalities.
Conclusion
Considering these findings, it appears that the carbon tax policy will enhance the improvement of TB outcomes in both youth and adult population in South Africa. Thus, countries with comparable conditions could benefit from implementing a similar policy.
Keywords
Carbon tax policy; Epidemiological Environment; South Africa; Tuberculosis
Introduction
In 2003, the World Health Organisation (WHO) expressed concern that climate change will affect the social and environmental determinants of health-causing increases in infectious diseases [1]. WHO and the World Bank estimated that climate change is expected to cause approximately 250 000 additional deaths between 2030 and 2050 [1, 2]. Based on this estimation, in 2015, the WHO Executive Board endorsed a new working plan on climate change and health. This plan included encouraging member states to consider strategies to reduce carbon emissions in order to minimise the risks of infectious diseases which are central to cause deaths in developing countries [3].
Currently, the South African health system is battling high levels of infectious diseases like Tuberculosis (TB) [4] and 59 percent of TB cases are linked to HIV [5]. As a result, in 2019 South Africa became the first African country to implement a special carbon tax policy with the aim of reducing carbon emissions [2]. This policy is implemented based on the evidence that carbon emissions are one of the major contributing factors to climate change and may lead to worsening of infectious diseases [6]. Therefore, by targeting carbon emitting industries it was suggested that the tax will lower carbon emissions. In turn, this will reduce health risk factors associated with climate change.
However, the current carbon tax rate in South Africa is low compared to international carbon tax rate [2,6] and may not be effective in lowering carbon emissions. Additional concerns are based on the argument that the carbon tax revenue may not yield significant improvements in infectious diseases if the funds are not recycled back into projects that improve social and environmental determinants of health [7]. As a result, there is a need for carbon tax to be channelled back into programs that promise to mitigate climate change and improve infectious diseases. Currently, the South African government has been urged to use part of the carbon tax funds to improve access to clean electricity and incentive corporates to adopt clean technologies to minimise carbon emissions [8]. Both strategies may yield positive results in the fight against Tuberculosis (TB), considering the seasonality of TB which gets worse during cold winter periods and high polluted environment [9,10].
So far- despite the recent adoption of the carbon tax policy in South Africa and the growing debate around this policy [11], there is no study yet analysing the budget impact of carbon tax revenues to Tuberculosis (TB) outcomes in this country. There is also no study that has forecasted HIV-TB co-infections mortality outcomes after the implementation of the carbon tax. Both exercises are important in informing policy makers about the robustness of carbon tax policy in driving improvements of infectious diseases in the context of Africa. The current study seeks to address these gaps and explores the potential impact of the carbon tax revenue in improving TB mortality outcomes between 2020-2045.
The study focuses on two vulnerable population groups of working age: youth (25-34 years) and adults (35-44 years) and sought to answer the following questions: [1] What impact does the carbon tax revenue exert on TB mortality outcomes in both the youth and the adult population. [2] Is the carbon tax revenue likely to have positive spill-over effects to HIV -TB co-infections? [3] Are there gender based differences in the impact of carbon tax revenue? The study believes that providing answers to these interrelated questions represents a key element to unlock the understanding about the potential legacy of carbon tax policy in improving infectious diseases in Africa and mitigate climate change effects.
In order to identify the budgetary impact of carbon tax the paper used data sourced from the National Treasury South Africa’s carbon tax revenue statistics to quantify the expected carbon tax revenue from 2020 until 2045. The study then employs the One-Health Tool managed by the World Health Organisation to estimate the impact of carbon tax revenues to TB outcomes. The results show that the carbon tax policy will improve TB outcomes across the two groups studied. However, the impact of the carbon tax policy will be higher in the youth and female population. Importantly, the carbon tax revenue will also foster positive spill over effects to HIV -TB co-infections. The paper document improvements in HIV -TB mortalities for both young and adult population. In light of these positive outcomes on health, the study concludes that the carbon tax introduced in South Africa in 2019 will enforce resilient improvement in TB related mortalities.
The remainder of the article is organized as follows. Section two discusses the relationship between carbon taxes and health outcomes. Section three describes the history and characteristics of the carbon tax policy in South Africa. Section four discusses the methodology while section five presents the estimated results. The last section concludes.
Carbon tax policy and health outcomes
South Africa has committed to reduce its carbon emissions by 34 percent in 2020 and 42 percent by 2025 [12]. Such ambitious targets reflect South Africa’s ranking as the world’s thirteenth largest carbon emitting country, with per capita emissions nearly twice the global average in 2012 [13]. In 2005, coal-fired power plants generated 92.9 percent of total electricity supply in South Africa, followed by nuclear (4.9 percent) and hydropower (1.8 percent). This reliance on coal-fired plants explains why 53.1 percent of South Africa’s total emissions are from electricity generation purposes [13].
Recently, it has been estimated that for South Africa to reach the low emissions scenario, total carbon emissions will not reach the targeted 42 percent decline in 2025 as previously envisage by the government [14], due slow adoption of clean technologies. This implies that meeting the national emissions targets will move beyond 2025 and will cost the economy 171 billion US$ [15].
These costs will come from greater use of renewable energy, which has lower energy load and therefore requires more installed systems capacity in order to deliver the same electricity output as coal-fired power stations. Other cost will be incurred as industries across various economic sectors adopt clean technologies. Some of these costs will be driven by expanding access to clean electricity as the government plan to offer free electricity to the poor segment of the population [12]. The access to clean household electricity and low carbon emissions will improve the social and environmental determinants of health and mitigate seasonal infectious diseases like Tuberculosis disease (TB).
Recent statistics show that TB alone kills 21 000 people in South Africa and is one of the leading infectious disease linked to HIV [16]. This airborne disease spreads easily from a person with active TB to another person when the infectious person coughs, sneezes, speaks or sings [17]. The incidences of TB remain high not only in South Africa but also in majority of developing countries. It is estimated that globally there were 10.2 million new cases of TB in 2018, and 1.2 million people died from the TB disease [16]. Most of the estimated cases occurred in Asia (45 percent) and Africa (25 percent) due to increases in air pollution. Based on this statistics, it is clear that TB remains a major challenge in the public health systems of developing countries in general - and has been exacerbated by urbanization, population movement and carbon emissions [10, 18,19].
Previous studies have shown that environmental factors play important role in the distribution of TB disease [20, 21]. The incidence of tuberculosis has been shown to be highest during summer, thus, it was discovered that the disease is mainly acquired during winter months [22]. This was attributed to reduction in vitamin D level in the winter season; smoke and lack of clean household energy in poor communities [21] and seasonal change in immune function [23].
Air quality was also linked to TB outbreak. Carbon monoxide promotes bacillary reactivation and increases the risk of TB outbreaks [24]. Therefore, the proposed reduction in carbon emissions in South Africa and improvement in access to clean electricity is expected to improve TB deaths since cold weather conditions and high carbon emission environment are associated with worsening TB outcomes [25]. However, it remains to be seen how the budget arising from the carbon tax revenue and low CO2 emissions will improve TB outcomes, taking into account the existing health system constrains. Currently, it is only 3. 2 percent of the 3. 5 million poor households who benefit from free solar electricity systems in South Africa [26]. The government want to improve this statistic using the carbon fund.
Carbon tax policy in South Africa
History and characteristic of the carbon tax policy in South Africa
The carbon tax policy in South Africa is aimed at reducing carbon emissions [6] and improving access to clean household electricity through subsidising the poor with free electricity [12]. The tax was introduced on the 1st of June 2019 at a much lower rate than global carbon taxes. The nominal amount of carbon tax that a company will pay is R120 (7.8 US$) per ton of carbon dioxide (CO2) emitted in 2020. In most countries carbon tax rate is set at 40 US$ per ton of CO2 and the high level commission on carbon prices recently reported that by 2030, countries should be looking at a carbon price of US$50-100 per ton of CO2 [2]. Despite the low carbon tax rate in South Africa it is expected that carbon emissions will peak in most sectors of the economy in 2030 then begin to fall until 2045(14) [Figure 1].
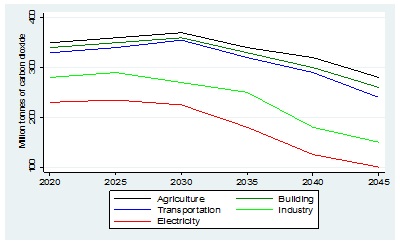 Figure 1: Expected CO2 emissions by economic sectors in South Africa. [Million tonnes of CO2].
Source: Author elaboration with data from the Altieri, K. et al. (2015). Pathways to deep decarbonisation in South Africa, SDSN - IDDRI. [14] Estimations are based on million tons of CO2.
Eligibility
The eligibility criterion is set with an understanding that carbon emissions contributes to climate change. Therefore, carbon emission above 60 percent basic tax-free allowance should be taxed across economic sectors. It is expected that carbon fund will grow in line with domestic inflation [Figure 2].
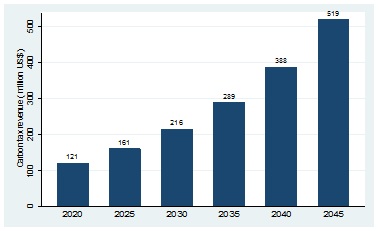 Figure 2: Expected carbon tax revenue in South Africa. [Million US$].
Source: Own elaboration with data from the National Treasury. Estimations are based on millions of USD.
Generosity
The tax is payable by companies which exceed the 60 percent threshold of carbon emissions. The government intends to use the revenues to fund the national budget for electrification of poor households. Other plans include investing in clean technology to minimising carbon emissions.
Administration
South Africa Revenue service (SARS) and the Department of Environmental Affairs (DEA) jointly administer the carbon tax. The DEA collect the emissions data from all companies which is incorporated into the South African National Atmospheric Emissions Inventory System (NAEIS). SARS use the NAEIS data to determine the appropriate tax due for payment.
Duration
Currently, the tax rates are adjusted annually in order to take into account changes in inflation. Using the US$ 121 million collected by the national treasury in 2019 [27], and the future expected carbon tax revenues; the paper was able to model the impact of carbon tax budget in improving TB outcomes until 2045.
Datasets And Methods
To estimate the impact of carbon tax revenue in improving TB outcomes the paper used the One-Health tool, which incorporates priority diseases programmes for the South African health system.
Overview of the one-health tool
The One-Health tool was developed to forecast the costs and health impacts associated with investments to the South African health system, thereby providing information on the medium- to long-term performance of the health system. Since its inception in 2009, the tool has been managed by the World Health Organisation and other United Nations inter-agency working groups [28, 29].
The One Health tool is also integrated in the Spectrum suite of software models, which allows for the linking of health investment to various epidemiological programs and impact models, such as the Lives Saved Tool (29). This allows researchers to estimate TB outcomes in a dynamic manner over time, taking into account population growth, incidence, as well as the projected changes that come with investment coverage arising from preventative strategies to combat TB. In this paper, the tool was used to model scenarios targeted at improving TB outcomes in two population groups: Youth (25-34 years) and adults (35-44 years).
The paper opted to focus on these two groups based on reported evidence by the WHO and the Department of Health in South African that youth (25-34 years) and adults (35-44 years) are the most vulnerable groups for TB. Both populations have the highest cases of TB than any other age group in South Africa. These cases are linked with HIV and cause premature deaths before the age of 65 years [5,30] [Figure 3].
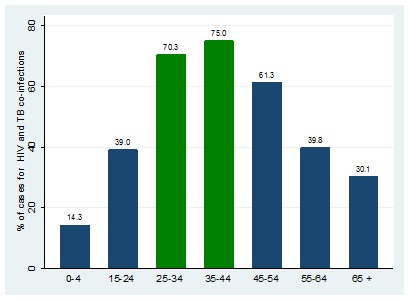 Figure 3: TB and HIV co-infection by age group.
Source: Own elaboration with data from the 2016 National Department of Health- South Africa
Diseases modelling analysis
For modelling exercise, the tool was filled in with South Africa epidemiological data for TB and demographic databases. These datasets came from Statistics South Africa, National Department of Health, World Health Organisation and United Nations. The tool was also loaded with treatment and preventative guidelines for effective TB control as recommended by the South African National Department of Health and World Health Organisation. Estimates for adults suffering from TB came from Department of health, Statistics South Africa and WHO.
The paper then estimated conservative annual improvement in TB outcomes due to decrease in carbon emissions and improvement in access to clean electricity for the youth (25-34 years) and adults (35-44 years) population. The model assume that carbon tax will provide free basic clean electricity for 300 thousand individuals for each cohort in 2020 and the number will remain the same till 2045. In line with current expectation, the paper also assumes CO2 emissions to reach peak in 2030, then fall by 34 percent in 2045 (14) [Figure 4].
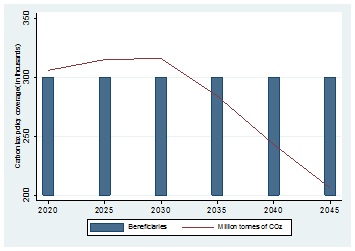 Figure 4: Carbon tax policy coverage for each studied cohort.
Source: Authors own elaboration assuming carbon tax policy coverage for each studied cohort.
Cost analysis
The paper estimated the full electricity cost for each household using ingredient based costing methodology. The study utilised South Africa municipality electricity billing rate to estimate electricity consumption of the following household’s items (refrigerator, television, bar heater, desktop computer, geyser, toaster, microwave, kettle, stove and iron) per month. All costs were converted to USD using average of 15.00 ZAR: 1 USD [Figure 5]. The paper discovers that the total annual electricity cost for 300 thousand individuals was US$ 98 million. Meaning, the current carbon tax revenue (US$ 121 million) is competent for the electrification program of the studied cohorts.
|
Base year 2020 |
Cost |
|
Electricity cost per household (2020 average municipality bill) ZAR |
1 350,00 |
|
Average people per household (2019 Statistics South Africa) ZAR |
3,30 |
|
Cost per person/month ZAR |
409,09 |
|
Cost per person/annum ZAR |
4 909,09 |
|
Annual cost per person for 300k people ZAR |
1 472 727 272,73 |
|
Converted to USD |
$98 181 818,18 |
|
Year |
USD |
Year |
USD |
Year |
USD |
|
2020 |
$ 98 181 818 |
2031 |
$ 186 378 404 |
2042 |
$ 353 801 855 |
|
2021 |
$ 104 072 727 |
2032 |
$ 197 561 108 |
2043 |
$ 375 029 967 |
|
2022 |
$ 110 317 091 |
2033 |
$ 209 414 775 |
2044 |
$ 397 531 765 |
|
2023 |
$ 116 936 116 |
2034 |
$ 221 979 661 |
2045 |
$ 421 383 671 |
|
2024 |
$ 123 952 283 |
2035 |
$ 235 298 441 |
||
|
2025 |
$ 131 389 420 |
2036 |
$ 249 416 347 |
||
|
2026 |
$ 139 272 786 |
2037 |
$ 264 381 328 |
||
|
2027 |
$ 147 629 153 |
2038 |
$ 280 244 208 |
||
|
2028 |
$ 156 486 902 |
2039 |
$ 297 058 860 |
||
|
2029 |
$ 165 876 116 |
2040 |
$ 314 882 392 |
||
|
2030 |
$ 175 828 683 |
2041 |
$ 333 775 335 |
Figure 5: Evolution of electricity cost per 300 thousand individuals.
Source: Authors own elaboration using electricity consumption estimation. Annual costs are adjusted assuming 6 percent inflation in line with South African Reserve Bank inflation target..
Sensitivity analysis
The paper then conducted a sensitivity analyses by assume that carbon tax policy will provide clean electricity to 600 thousand individuals in each cohort. In order to generate confidence intervals, TB change was estimated based on 100,000 iterations of the model using @Risk, version 6.42. The cohort model was coded in Java to estimate the impact of carbon tax policy on cases of TB incidence and mortality. The paper also models the spill over effects of carbon tax policy to HIV-TB overall mortalities.
Results
The model shows that 10 years after the implementation of the carbon tax policy (year 2030); there would be a relatively low reduction in the overall TB outcomes in both population groups. The paper also discovered better reductions for TB deaths in the youth population (2.6 percentage points) than in the adult population (1.5 percentage points) in 2045 [Table 1]. These TB outcomes will also spill over to HIV-TB co infections resulting in a 1.9 percent and a 1.1 percent improvement in HIV-TB mortalities respectively.
|
Year |
|||||||
|
|
2020 |
2025 |
2030 |
2035 |
2040 |
2045 |
Average |
|
Youth |
|||||||
|
TB incidence |
0.7 |
1 |
1.2 |
3.1 |
5.6 |
7.2 |
3.1 |
|
95% CI |
[0.5;0.8] |
[0.9;1.1] |
[1.0;1.5] |
[2.8;3.4] |
[5.5;5.7] |
[7.1;7.5] |
|
|
TB mortality |
0.5 |
0.8 |
1 |
2.5 |
4.8 |
6.3 |
2.6 |
|
95% CI |
[0.3;0.6] |
[0.7;0.9] |
[0.8;1.2] |
[2.1;2.7] |
[4.6;5.1] |
[6.1;6.4] |
|
|
HIV-TB mortality |
0.3 |
0.5 |
0.9 |
2.2 |
2.9 |
4.6 |
1.9 |
|
95% CI |
[0.1;0.4] |
[0.4;0.6] |
[0.7;1.0] |
[2.1;2.3] |
[2.6;3.2] |
[4.4;4.9] |
|
|
Adult |
|||||||
|
TB incidence |
0.4 |
0.5 |
0.9 |
2.3 |
3.4 |
4.5 |
2 |
|
95% CI |
[0.3;0.6] |
[0.4;0.7] |
[0.8;1.2] |
[1.9;2.4] |
[2.9;3.5] |
[4.3;4.7] |
|
|
TB mortality |
0.2 |
0.3 |
0.7 |
1.7 |
2.5 |
3.7 |
1.5 |
|
95% CI |
[0.1;0.3] |
[0.2;0.5] |
[0.6;0.9] |
[1.5;1.9] |
[2.4;2.6] |
[3.5;3.8] |
|
|
HIV-TB mortality |
0.1 |
0.2 |
0.6 |
1.5 |
1.9 |
2.3 |
1.1 |
|
95% CI |
[0.0;0.2] |
[0.1;0.3] |
[0.5;0.8] |
[1.3;1.6] |
[1.8;2.0] |
[2.1;2.4] |
|
Table 1: Projected 5 years percentage reductions due to carbon tax policy.
Source: Authors analysis using One-health tool estimation. 95% confidence intervals (CI) are based on 100,000 iterations of the model that predicted change in TB outcomes resulting from changes in carbon emission and access to clean household energy.
The paper now focuses on whether these positive outcomes are common for both genders. Table 2 shows that the policy will improve TB outcomes more in the female population than males. This is true for both the youth population as well as the adult population [Table 2 and 3]. The policy will improve TB deaths by 2.0 percent (average) for males and 3.3 percent for females in the youth population and by 1.0 percent for males and 2.0 percent for females in the adult population. Similarly, these outcomes will result in positive spill overs to HIV-TB mortalities.
|
Youth population |
|||||||
|
Year |
|||||||
|
|
2020 |
2025 |
2030 |
2035 |
2040 |
2045 |
Average |
|
Female |
|||||||
|
TB incidence |
1.1 |
1.5 |
1.9 |
3.6 |
6.7 |
8.2 |
3.8 |
|
95% CI |
[0.9;1.2] |
[1.3;1.6] |
[1.7;2.1] |
[3.5;3.9] |
[6.5;6.9] |
[7.9;8.3] |
|
|
Male |
|||||||
|
TB incidence |
0.4 |
0.5 |
0.6 |
2.7 |
4.5 |
6.3 |
2.5 |
|
95% CI |
[0.3;0.5] |
[0.4;0.6] |
[0.5;0.7] |
[2.6;2.9] |
[4.4;4.7] |
[6.1;6.4] |
|
|
Female |
|||||||
|
TB mortality |
0.7 |
1.2 |
1.5 |
3.2 |
5.7 |
7.6 |
3.3 |
|
95% CI |
[0.6;0.8] |
[1.0;1.3] |
[1.4;1.6] |
[3.1;3.3] |
[5.6;5.9] |
[7.5;7.8] |
|
|
Male |
|||||||
|
TB mortality |
0.3 |
0.4 |
0.5 |
1.9 |
3.9 |
5.1 |
2 |
|
95% CI |
[0.1;0.4] |
[0.3;0.6] |
[0.4;0.6] |
[1.8;2.1] |
[3.7;4.0] |
[5.0;5.3] |
|
|
Female |
|||||||
|
HIV-TB mortality |
0.5 |
0.8 |
1.4 |
2.8 |
3.3 |
5.5 |
2.4 |
|
95% CI |
[0.4;0.6] |
[0.7;0.9] |
[1.3;1.5] |
[2.7;2.9] |
[3.2;3.4] |
[5.3;5.6] |
|
|
Male |
|||||||
|
HIV-TB mortality |
0.2 |
0.3 |
0.4 |
1.6 |
2.5 |
3.7 |
1.4 |
|
95% CI |
[0.1;0.3] |
[0.2;0.4] |
[0.3;0.7] |
[1.4;1.7] |
[2.4;2.6] |
[3.5;3.8] |
|
Table 2: Projected 5 years percentage reductions for both males and females.
Source: Authors analysis using One-health tool estimation. 95% confidence intervals (CI) are based on 100,000 iterations of the model that predicted change in TB outcomes resulting from changes in carbon emission and access to clean household energy.
|
Adult population |
|||||||
|
Year |
|||||||
|
|
2020 |
2025 |
2030 |
2035 |
2040 |
2045 |
Average |
|
Female |
|||||||
|
TB incidence |
0.6 |
0.7 |
1.3 |
3.1 |
5.5 |
5.5 |
2.8 |
|
95% CI |
[0.5;0.7] |
[0.6;0.8] |
[1.2;1.4] |
[3.0;3.2] |
[5.4;5.7] |
[5.4;5.7] |
|
|
Male |
|||||||
|
TB incidence |
0.2 |
0.3 |
0.5 |
1.6 |
3.6 |
3.5 |
1.6 |
|
95% CI |
[0.1;0.3] |
[0.2;0.4] |
[0.4;0.6] |
[1.5;1.7] |
[3.5;3.8] |
[3.4;3.9] |
|
|
Female |
|||||||
|
TB mortality |
0.3 |
0.4 |
1.1 |
2.2 |
3.6 |
4.8 |
2 |
|
95% CI |
[0.1;0.4] |
[0.3;0.5] |
[1.0;1.2] |
[2.1;2.4] |
[3.4;3.9] |
[4.6;5.0] |
|
|
Male |
|||||||
|
TB mortality |
0.1 |
0.2 |
0.4 |
1.3 |
1.5 |
2.6 |
1 |
|
95% CI |
[0.0;0.2] |
[0.1;0.3] |
[0.3;0.5] |
[1.2;1.5] |
[1.3;1.7] |
[2.4;2.8] |
|
|
Female |
|||||||
|
HIV-TB mortality |
0.2 |
0.3 |
0.9 |
1.9 |
2.5 |
2.7 |
1.4 |
|
95% CI |
[0.1;0.3] |
[0.2;0.4] |
[0.8;1.1] |
[1.8;2.2] |
[2.4;2.6] |
[2.6;2.9] |
|
|
Male |
|||||||
|
HIV-TB mortality |
0.1 |
0.2 |
0.3 |
1.1 |
1.3 |
2 |
0.8 |
|
95% CI |
[0.0;0.2] |
[0.1;0.3] |
[0.2;0.4] |
[1.0;1.2] |
[1.2;1.5] |
[1.8;2.2] |
|
Table 3: Projected 5 years percentage reductions for both males and females.
Source: Authors analysis using One-health tool estimation. 95% confidence intervals (CI) are based on 100,000 iterations of the model that predicted change in TB outcomes resulting from changes in carbon emission and access to clean household energy.
Lastly, the paper analysed the impact of the policy assuming doubling the individuals benefiting from clean electricity in 2020 till 2045. The results show that doubling the policy coverage would nearly double the improvements in TB outcomes in both population groups [Table 4]. Once again, the impact is larger in the youth population compared to the adult population.
|
Year |
|||||||
|
|
2020 |
2025 |
2030 |
2035 |
2040 |
2045 |
Average |
|
Youth |
|||||||
|
TB incidence |
1.3 |
1.9 |
2.3 |
6.1 |
11.1 |
14.3 |
6.1 |
|
95% CI |
[1.1;1.4] |
[1.8;2.1] |
[2.2;2.5] |
[6.0;6.4] |
[11.0;11.3] |
[14.1;14.5] |
|
|
TB mortality |
0.9 |
1.5 |
1.9 |
4.8 |
9.4 |
12.5 |
5.1 |
|
95% CI |
[0.8;1.1] |
[1.4;1.7] |
[1.8;2.1] |
[4.7;5.1] |
[9.3;9.7] |
[12.4;12.8] |
|
|
HIV-TB mortality |
0.5 |
0.8 |
1.7 |
4.2 |
5.6 |
9 |
3.6 |
|
95% CI |
[0.3;0.6] |
[0.7;0.9] |
[1.6;1.9] |
[4.1;4.5] |
[5.5;5.9] |
[8.9;9.3] |
|
|
Adult |
|||||||
|
TB incidence |
0.7 |
0.9 |
1.8 |
4.4 |
6.6 |
8.8 |
3.9 |
|
95% CI |
[0.6;0.8] |
[0.8;1.1] |
[1.7;2.0] |
[4.3;4.7] |
[6.5;6.9] |
[8.7;9.1] |
|
|
TB mortality |
0.3 |
0.5 |
1.3 |
3.2 |
4.8 |
7.3 |
2.9 |
|
95% CI |
[0.2;0.4] |
[0.4;0.7] |
[1.2;1.5] |
[3.1;3.5] |
[4.7;5.0] |
[7.2;7.5] |
|
|
HIV-TB mortality |
0.2 |
0.3 |
1.1 |
2.9 |
3.7 |
4.5 |
2.1 |
|
95% CI |
[0.1;0.3] |
[0.2;0.4] |
[1.0;1.3] |
[2.8;3.2] |
[3.6;4.0] |
[4.4;4.9] |
|
Table 4: Projected 5 years percentage reductions due to scaling up carbon tax policy.
Source: Authors analysis using One-health tool estimation. 95% confidence intervals (CI) are based on 100,000 iterations of the model that predicted change in TB outcomes resulting from changes in carbon emission and access to clean household energy.
Conclusion
The reductions in mortalities in 2045 demonstrate the significance of the carbon tax policy in the national TB programme of South Africa. Indeed, the current carbon tax rate is below the recommended international carbon tax rate and may not yield high reduction in carbon emission before 2030. Despite such setbacks, the policy has the potential to improve TB mortality with an average reduction of 0.9 percent in both the youth and adult population in 2030, due to access to clean household energy. The momentum of the 0.9 percent reduction will be enhanced by the 34 percent reduction in carbon emissions post 2030. Based on these results, decision-makers may need to focus on high-risk populations for TB and prioritise CO2 reduction programs and improving access of clean household electricity. This strategy promises to avert TB related deaths.
The age and gender-based difference in the impact of carbon tax policy results from differences in working conditions between males and females. For example, males in South Africa generally have higher TB incidence than females with most TB cases acquired in the mining industry. These cases correlate with age. Therefore, is it expected that the policy will not improve the TB outcomes of male population aggressively compared to females. This becomes even more visible as the population ages; hence, the adult population recorded low reductions in TB outcomes compared to the younger youth population.
Given the magnitude of this policy- its investment in improving clean household electricity and reducing carbon emission has the potential to produce larger health benefits. Therefore, there is a need for scaling up the carbon tax in order for the policy to be more effective in improving TB outcomes in South Africa. After-all, the current tax rate is subpar compared to the recommended global carbon tax rates. Other developing countries could benefit from implementing this policy as they try to fight TB related diseases.
Conflict of interest
None
Funding
None
References
- World Health Organisation. Climate change and human health-risks and responses. WHO publication. (2003)
- World Bank. State and Trends of Carbon Pricing. World-Bank publication (2019).
- Ghazali T, Guericolas M, Casalino E (2018) Climate change impacts on disaster and emergency medicine focusing on mitigation disruptive effects: An international perspective. International Journal Enviromental Research and Public Health 15: 1379.
- Naidoo P, Theron G, Rangaka M, Chihota V, Vaughan L, et al. (2017) The South African Tuberculosis care cascade: Estimated losses and methodological challenges. Journal of Infectious Diseases 1: 702-713.
- World Health Organisation (2018) TB Profile. South Africa.
- National Treasury South Africa (2019) To provide for the imposition of a tax on the carbon dioxide (CO2) equivalent of greenhouse gas emissions; and to provide for matters connected therewith. South Africa 647.
- Cuevas S, Haines A (2015) Health benefit of carbon tax. The Lancet 387: 9
- Winkler H, Maquard A (2019) South Africa’s new carbon tax could help poor people pay less for energy. The Conversation. World Economic Forum articles.
- Kuddus M, McBryde E, Adegboye O (2019) Delay effect and burden of weather related tuberculosis cases in Rajshahi province, Bangladesh, 2007-2012 . Scientific Reports nature research 9: 12720.
- Fares (2011) Seasonality of Tuberculosis. Journal of global infectious diseases 3: 46-55.
- Carattini S, Carvalho M,Fankhauser S (2017) How to make carbon taxes more acceptable.
- National Treasury South Afria (2010) Discussion paper for public comment. Reducing Greenhouse Gas Emissions: The carbon tax option. National Treasury SA publication.
- Alton T, Arndt C, Davies R, Hartley F, Makrelov K, et al.(2014) Introducing carbon taxes in South Africa. Applied Energy 116: 344-354.
- Altirie K (2015) Pathways to deep decarbonization in South Africa.SDSN - IDDRI.
- Department of Energy South Africa (2011) Integrated resource plan for electricity: 2010-2030. Revision 2. Final report, Pretoria, South Africa.
- World Health Organization (2019) Global-tuberculosis-report.
- Frieden T, Sterling T, Munsiff S (2003) Tuberculosis. Lancet 362: 887-899.
- Alirol E, Getaz L, Stoll B (2011) Urbanisation and infectious diseases in a globalised world. The Lancet Infectious Diseases 11: 131-141.
- Chowdhury R, Mukherjee A, Naska S,Lahiri S (2013) Seasonality of tuberculosis in rural West Bengal: A time series analysis. International journal of health and allied sciences 2: 95-98.
- Talat N, Perry S, Parsonnet J,Dawwod G, Hussain R (2010) Vitamin D Deficiency and Tuberculosis Progression. Emerging Infectious Diseases 16: 853-855.
- Yang T (2016) Seasonality impact on the transmission dynamics of tuberculosis. Computational and mathematical methods in medicine.
- Wubuli A, et al. (2017) Seasonality of active tuberculosis notification from 2005 to 2014 in Xinjiang, China. PLoS One 12: e0180226.
- Nelson J (2004) Seasonal immune function and sickness responses. Trends in Immunology 25: 187-192.
- Fernandes F, et al. (2017) Relationship between climatic factors and air quality with tuberculosis in the Federal District, Brazil, 2003-2012.Brazilian Journal of Infectious Diseases 21: 369-375.
- Mäkinen T, et al. (2009) Cold temperature and low humidity are associated with increased occurrence of respiratory tract infections. Respiratory medicine 103: 456-462.
- Statistics South Africa (2018) Energy and the poor: A municipal breakdown.
- National-treasury South Africa (2020) Budget speech.
- Wong T (2018) Reflections on the use of the World Health Organization’s (WHO) OneHealth Tool: Implications for health planning in low and middle income countries (LMICs) Pg no: 157.
- Cantelmo T (2018) Estimating health plan costs with the OneHealth tool, Cambodia. Bull World Health Organ. 1: 462-470.
- Mvusi L (2016) Mananging and monitoring the TB programme. Department of health South Africa.
Citation: Mostert CM, Groenendijk NS (2021) The Impact of Carbon Tax Policy on Tuberculosis Outcomes in South Africa. J Community Med Public Health Care 8: 93
Copyright: © 2021 Cyprian M Mostert, et al. This is an open-access article distributed under the terms of the Creative Commons Attribution License, which permits unrestricted use, distribution, and reproduction in any medium, provided the original author and source are credited.