The Impact of the Medical Aid Schemes on Health Outcomes of the South African Population in the Post-Apartheid Era
*Corresponding Author(s):
Cyprian M MostertAga Khan University, Brain And Mind Institute, The United Kingdom, Kenya, Pakistan
Email:cypri2003@gmail.com
Abstract
This paper applies a Two-Stage Least Square (2SLS) model to quantify the impact of Medical Aid Schemes (MES) on the South African population's health outcomes. The paper also estimates the racial differences attributed to MES impacts in South Africa. The results show that the MES has a significant effect, improving access to healthcare and avert illness for both adult and children population. The impact of MES is higher in urban regions than in rural settings and larger in educated population than in the least educated population. Men benefitted more from MES compared to women. Notably, the MES impact is more favourable towards the White and Indian population. The impact of MES is not significant in averting illness in the Black and Coloureds population from the under-resourced background. In light of these findings, the paper concludes that MES has not yet succeeded in undermining the legacy of apartheid in South Africa. Reforms may be warranted to bring racial equality as South Africa looks to achieve universal health coverage.
Keywords
Medical Aid Schemes; Racial Inequality; South Africa; Health outcomes
Introduction
The apartheid system in South Africa imposed a rigid hierarchy which brought inequalities in health outcomes [1]. The system classified people into categories of Whites, Indians, Coloureds, and Blacks. These categories determined where people could live, work and access healthcare. Funding for health care for non-whites- especially in the Black communities was always low, resulting in the worst health outcomes for the majority of the South African population [2].
Estimates in the early 1970s determined that the doctor to population ratio in the black communities was 1 to every 15,000 rather than 1 to every 1,700 in the rest of the country [3,4]. Such estimates highlight the lack of health care coverage and the extent to which blacks suffered systematic discrimination both economically and in terms of access to healthcare [5]. The legacy of such discrimination worsens health outcomes including that of children which is still visible even today [6,7].
From 1980 to 1990, the number of doctors working in the private sector increased from 40 to 60 percent [3]. These doctors mainly offered health services to approximately 87 percent of the White population, and the Medical Aid Schemes (MES) were the biggest funders of private care [4]. By the time apartheid ended in 1994, almost three-quarters of general doctors worked in the private sectors, making it even more difficult for Blacks to afford quality healthcare due to medical aid schemes' exclusionary [8].
Recently, the report from an independent investigation launched by the Council for Medical Schemes (CMS) in South Africa shows that non-whites medical practitioners are being discriminated against by the Medical Aid Schemes (MES) [9]. In the report-MES were found to withhold payments to non-whites medical practitioners once they had rendered healthcare services, forcing them to be out of private practice [10,9]. Such unethical behaviour was displayed in the post-apartheid South Africa between the years 2012 -2019.
Against this background -the question confronting South Africa is how the Medical Aid Schemes (MES) influence health outcomes in the post-apartheid South Africa in terms of access to healthcare and averting illness of Whites, Indians, Coloureds, and Blacks comparatively. This paper uses a retrospective analysis between 2012-2019 to answer such question. This answer is likely to present insights on whether MES are entrenching historic health inequalities in post-apartheid South Africa.
Currently, some authors have argued that there is evidence of health equality in the adolescent population residing in urban areas of post-apartheid South Africa [11]. However, other authors reported no evidence of health equality in the adult population, calling for more race-based policy interventions to improve South Africa's health outcomes [12]. This branch of the literature needs improvement considering that it has not factored in the dynamic influence of MES on South Africans' health outcomes- an angle that is less studied using individual data [13,14]. No study has quantified the impact of the MES on access to healthcare and averting illnesses focusing on Whites, Indians, Coloureds, and Blacks comparatively in the post-apartheid South Africa.
Such analysis is needed to establish if there is evidence of health equality across these racial groups driven by MES impact. This paper is designed to fill this gap and seeks to answer the following questions: (1)What impact does the MES exert on access to healthcare focusing on Whites, Indians, Coloureds and Blacks comparatively? (2) What impact does the MES exert on illnesses of Whites, Indians, Coloureds and Blacks comparatively? (3) Are there gender, educational and regional differences in the impact of the MES? (4) Does the MES exert positive spillover effects on children illnesses of Whites, Indians, Coloureds and Blacks comparatively? The paper believes that answering these interrelated questions represents a critical element of understanding the MES's potential legacy of advancing health outcomes and equality in post-apartheid South Africa.
This study hypothesizes that MES improves access to healthcare and averts illnesses in South Africa. However, the impact of MES is still biased towards the White population compared to the non-whites considering that there is positive link between material resources and individual well-being [15]. Whites have more material resources compared to other racial groups in South Africa which may support MES impact. The impact of MES is expected to be modest in the female population compared to the male population. Also, the impact of MES is expected to be less intense in improving health outcomes of the least educated population compared to the educated population. Furthermore, the MES impact is expected to be low in the rural segment of South Africa compared to urban regions. Therefore, the paper anticipates no evidence that MES has undermined the legacy of apartheid and brought equality in modern South Africa.
The remainder of the article is organized as follows. Section two provides an overview of the literature. Section three discusses the history and characteristics of the medical aid schemes in South Africa. Section four contains the methodology. Section five presents the estimated results. The last section concludes.
Literature Review
The current literature was selected from the mainstream international journals and reported South African studies. These studies were analysed based on their relevance to explaining the impact of the MES on health outcomes. South Africa has both public and private healthcare financing systems. Private healthcare sector funding is dominated by medical aid schemes responsible for 41.8 percent of the total healthcare expenditure [16]. In South Africa, MES provides a superior quality of healthcare than the public sector [17]. Hence the middle class in South Africa often prefers private healthcare to the public health system as a crucial driver of good health outcomes.
In 2019, there were 80 medical aid schemes in South Africa, 21 of which were open schemes that anyone was free to join, and 59 were restricted medical aid schemes for companies or specific sectors or industries covering employees [10]. These 80 medical schemes had 4.02 million registered members, serving a total of 8.87 million beneficiaries. In 2019, a total of R186.66 billion was collected as premium contributions from members (2018: R173.95 billion), and expenditure on relevant healthcare services was reported at R169.07 billion (2018: R156.94 billion).
This massive amount of money expended on claims makes MES vulnerable to fraud [16], often resulting in bullying and abuse of power by the schemes, racially profiling non-white medical practitioners [10,9]. Currently, no study has analysed the implication of such abuse on the overall health outcomes of different racial groups in South Africa. So far, a growing number of South Africans are not satisfied with MES behaviours. For example, in the recent MES satisfaction index survey [18]; all MES customers indicated that they do not believe that the premiums paid to the schemes match the quality of cover and experience on offer. There is a need to quantify the impact of MES on health outcomes during this period of unhappiness.
The Health Care Market Inquiry, conducted by the Competition Commission of South Africa from 2014-2019, found that private healthcare in South Africa was designed to drive up resource use and spending without practicing medicine cost-effectively [19]. For example, doctors or therapists in private care got paid for every treatment, appointment, and procedure performed during consultations whereas overseas, they were often paid per general surgery or procedure [19]. This is called "fee for service" in South Africa and incentivizes private health professionals to schedule extra tests or appointments, which means more money for practitioners and expensive health services [20]. MES were found to be complacent to such behaviours, resembling the US health system, which is often characterized by wasteful health spending which does not yield improvement in health outcomes [21,22].
It is not yet clear how the MES in South Africa will evolve in light of the racism allegations. However, internationally-allegations of MES abuse of power and wasteful spending are often met with policy reform design to advance health outcomes without any discrimination to maximize patient protection [23,24]. Nevertheless, any reforms in South Africa may not deliver positive outcomes so long the public does not understand the long-run impact of MES on access to healthcare and illness of various population groups. The current paper is designed to quantify the dynamic influence of MES on health outcomes of the four population groups in South Africa to assess possible inequalities attributed to the MES.
As recommended by the Competition Commission [19], South Africa needs to create an Outcomes Monitoring and Reporting Organisation (OMRO) for providers, patients, and all other stakeholders to generate patient-centred and scientifically robust information on outcomes of healthcare attributed to MES. The current investigation is in line with such a recommendation.
History Of The MES In South Africa
During the apartheid era, the earliest types of Medical Aid Schemes (MES) were merely hospital cash plans rather than covers for medical costs. By the nineties, over 49 000 such policies were sold. However, the modern version of medical aid had its origins in the fifties, influenced by healthcare insurance evolution in the US. The schemes were initially available as group covers or restricted schemes for major medical procedures of specific employees for certain sectors/ companies.
Medical aids for individual membership only came later in the apartheid era. These schemes cover the day-to-day medical costs and hospital costs. This means that the individual pays a monthly contribution to the scheme, and in return, the scheme pays the service providers used according to specified and agreed upon tariffs.
Following the advent of democracy in 1994, private hospitals have increased in South Africa (Figure 1 in the appendix), driven by the MES coverage expansion. Despite such expansions-Blacks still do not benefit from the MES prominently than the White population due to this population group's existing disadvantaged status (Figure 2).
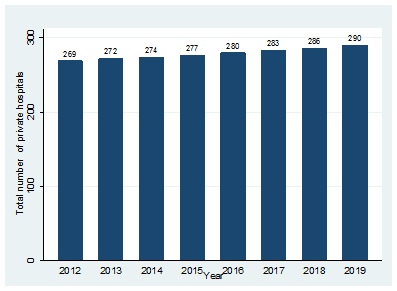 Figure 1: Evolution of private hopitals in South Africa financed by MES.
Source: Own elaboration with data from Fitch Solutions and Business Monitor International.
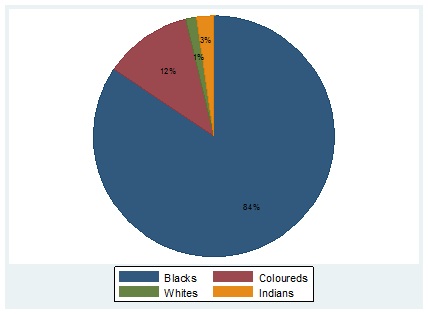 Figure 2: Percentage breakdown of racial groups not covered by MES.
Source: Own elaboration with data from Stats-SA annual surveys 2012-2019.
Regulation of MES
Medical schemes are regulated by the Medical Schemes Act No. 131 of 1998. The Act is designed not only to protect consumers but also for medical professionals, service providers, and schemes. According to the Act, a medical scheme's business is to undertake liability in return for a beneficiary's monthly premiums. From the Act, it clear that the modern MES in South Africa often does not make a cash payment to the member when the member is hospitalized, but instead takes on the financial responsibility associated with such hospitalization on behalf of the member and settle the payment directly with the hospital/ provider.
Generosity of MES
According to the Medical Schemes Act, a principal holder of MES can list family members as dependant to benefit from a scheme's generosity depending on the agreed-upon premium payment. A dependant can be a partner, children, spouse, or immediate family member. As a general rule in South Africa, a person may not be a member of more than one medical aid scheme and cannot submit a claim to more than one scheme. A person cannot be admitted as a principal holder of more than one medical aid scheme or as the dependant of various schemes. A person may not accept any medical scheme benefits if they are not admitted as a dependant or a principal holder.
Additional information on MES
Membership to MES in South Africa can only be suspended or cancelled by the specific schemes if the member fails to pay the premiums within the allowable period according to the particular schemes' rules, or fail to repay debt due to the medical schemes. Other grounds for suspension or cancellation include fraud or non-disclosure of material information.
Database and methodology
The study used a recently released database, the General Household Surveys (GHS), provided by Statistics South Africa (Stats-SA) from 2012 to 2019. The GHS are annual surveys of approximately 120,000 individuals and more than 20,000 households. These surveys aim to identify changes in the composition of South African households and their labour market outcomes. The GHS are complex surveys; the sampling procedure involves explicit stratification by province and within each province, by urban and non-urban areas. Household units are drawn under this stratification.
The individual characteristics presented in each household unit in the Stats-SA database include age, gender, education outcomes, health outcomes, income levels, labour market outcomes, and other general socio-economic status variables. These surveys generally structure questions to obtain a binary response. For example, adults are asked whether they benefit from MES. The general reply is either yes or no. The study used this binary variable to quantify the rate of access to healthcare for individuals who are benefiting from the MES versus those who are not benefiting from the MES. A similar approach was applied to the other variable: reported illness (yes/no). These data were collected physically by Stats-SA agents across the country using the Stats-SA approved questionnaire. For quality purposes, all Stats-SA datasets are reviewed at regular intervals by the Statistician-General and the head of the relevant organ of state to ensure that they remain relevant and of the specified quality.
According to the Republic of South Africa's constitution, Statistics South Africa derived its mandate from the Statistics Act, which states that Stats-SA is the only body responsible for the collection, production, and dissemination of official and other statistics of South Africa [25]. Policymakers in South Africa use access to healthcare and reported illness as measures of health outcomes of the South African population as the country attempts to advance health equality. Hence, these measures are collected by Stats-SA as part of the annual household survey.
The Statistics Act further states that Stats-SA has the vested power to communicate South African statistics independently and without any interference. This Act ensures that no institution has the power to subvert the statistical reports generated by Stats-SA, thus justifying the validity, independence, and reliability of the database generated by Stats-SA. Furthermore, section (e) (i) of the Stats-SA Act guarantees that Stats-SA is the only institution entrusted to liaise with international and regional organizations that request official statistics on South Africa [26]. This means that the current binary variables reflect South African health outcomes and are worthy of use in international scholarship and analysis.
The study linked datasets using the household unit number to create panel data for the current analysis. The panel creation of the annual Stats-SA dataset has been carried out previously to advance economic analysis. For example, the work by [27,28] used the panel version of the Stats-SA GHS data to understand the impact of public policy on development outcomes. The current paper adopted a similar strategy, selecting adults between 18 and 55 and focusing on their health outcomes during their working stages in life. The study was able to define a precise treatment and comparison group. Adults who benefited from the MES were considered as the treatment group, and adults who did not benefit from the MES constituted a comparison group.
The study focused on the MES's beneficiaries (18-55 years) to capture the sensitivity of access to healthcare and illness among these four different racial groups (Whites, Indians, Coloureds, and Blacks). Furthermore, the study explored if there are any gender, educational and regional differences in the MES impact.
The General Household Survey includes information on whether a household is benefiting from the MES. However, the study opted to avoid directly comparing households that receive the MES with those that do not receive it as these two groups of households can differ in many additional dimensions that can have direct impacts on the health outcomes of the adult population (for example, information barriers for the most disadvantaged households, differences in household income, and differences in the proximity to health facilities).
For these reasons, the study did not opt to estimate an OLS model due to the possibility of having inflated coefficients. (Nonetheless, the results of the OLS model are presented in the robustness check section). The study selected adults between 18 and 55 years and focused on reported access to healthcare and reported illness. It considered adults aged 18 to 55, an age range that corresponds to the cohorts' labour productive stages.
 In the first equation, Y is one of the outcomes for individual i at age α (18-55 years old), and "~MES" is the predicted benefit from the medical aid scheme. The regression includes education fixed effects, which capture the education effects that can influence health outcomes; province fixed effects, including all the nine provinces of South Africa; year fixed effects, which capture the year and seasonality bias that may influence the health outcomes; a dummy for intensity, which captures the treatment intensity bias in individuals treated with the MES persistently for more than a year; and a dummy for female for the regressions in which the study estimated effects for both males and females.
In the second equation (which corresponds to the first-stage regression), participation in the MES was estimated as a function of the treatment dummy variable, which identifies individuals who reported benefitting under the MES. In all the model estimations, the study needed two assumptions to be fulfilled: first, the instrument had to be relevant to explaining the probability of MES uptake, which will be corroborated by the F-test of the first-stage equation; and, second, the exclusion restriction needed to hold; that is, the instrument should not influence the main outcome directly through any channel other than the treatment effect of the MES. This assumption means that differences in both access to healthcare and illness between the treated and the comparison group can only be due to the MES coverage.
Results
Descriptive analysis
Table 1 presents the descriptive difference between the treatment and the comparison group. Firstly, adults who were not treated with the MES had low healthcare access than those who benefited from the MES. Secondly, the illness outcomes were better in the treated cohorts than in the comparison group. Thirdly, White people benefited more from the MES, while Blacks were the population group with the highest percentage of no coverage from MES (Figure 2).
|
Treated (cohorts 18-55 years) Control (cohorts 18-55 years) |
||
|
Benefiting from MES |
89.10% |
0.00% |
|
Female |
51.10% |
50.30% |
|
In rich provinces |
66.80% |
61.10% |
|
Reported illness |
35.10% |
43.70% |
|
Having access to healthcare |
65.60% |
50.20% |
|
Observations |
10868 |
11773 |
Table 1: Descriptive statistics .
Source: Own elaboration with data from Stats-SA annual surveys 2012-2019.
Results of the two-stage least square (2SLS) model
When analysing the 2SLS estimations' results, the study noted that the first-stage regression's F-statistic is very large across the four racial groups, indicating the instrument's substantial validity (Table 2). Thus, in Table 2, the author observes that the MES as proxied by the cohort instrument is a determinant in improving health outcomes and access to healthcare. Furthermore, the probability of having access to healthcare increase by 14.8 percentage points in the White population group. As the mean of access to healthcare is 76.5 in this racial group, the MES increases the probability of having access to healthcare by 19.3 percent. Similarly, the probability of having access to healthcare increase by 3.3 percentage points in the Black population. On the other hand, the mean of access to healthcare is 28.5 for this group, so the MES increases the probability of having access to healthcare by 11.6 percent. This estimation shows that the improvement in the MES's coverage is associated with better access to healthcare. The impact of MES is highly favourable towards Whites and Indians (19.3% and 16.4%), respectively. Coloureds and Blacks recorded a lower improvement in healthcare access (12.6% and 11.6%), respectively.
|
2SLS |
Whites |
Indians |
Coloureds |
Blacks |
|
1SLS |
Medical aid scheme |
|||
|
Treated cohorts |
0.087*** |
0.079*** |
0.051*** |
0.049*** |
|
(0.005) |
(0.003) |
(0.001) |
(0.008) |
|
|
Access to healthcare |
||||
|
MES |
0.148*** |
0.096*** |
0.049*** |
0.033*** |
|
[0.002] |
[0.007] |
[0.009] |
[0.002] |
|
|
Education FE |
YES |
YES |
YES |
YES |
|
Province FE |
YES |
YES |
YES |
YES |
|
Year FE |
YES |
YES |
YES |
YES |
|
Intensity FE |
YES |
YES |
YES |
YES |
|
Gender FE |
YES |
YES |
YES |
YES |
|
Mean for access |
0.765 |
0.584 |
0.39 |
0.285 |
|
Observations |
6010 |
3620 |
5797 |
7214 |
|
F-stat 1stSLS |
139.51 |
111.52 |
128.23 |
154.39 |
|
R-squared 2nd SLS |
0.06 |
0.05 |
0.05 |
0.07 |
Table 2: Impact of MES on access to healthcare.
Note:***denotes a p value of < 0.05. Note: The results are from a 2SLS model. In the first stage equation the dependent variable is the probability of benefitting from MES while the instrument is a dummy variable equal to 1 for individuals treated with MES and 0 for individuals not treated with MES. In the second stage regression the dependent variable is a dummy variable of “reporting having access to healthcare”. Both regressions include education, province, year, intensity and gender fixed effects. Source: Stats-SA datasets from 2012-2019.
Next, the study investigated whether the MES also positively impacts illness, considering that it is significant in improving access to healthcare across the four racial groups. Table 3 shows that the MES avert illness more in the White population group compared to the non-whites. More specifically, the MES reduced illness by 8.9 percentage points in the White cohorts, which implies a 22.9 percent improvement in illness. The MES's impact is more diminutive and insignificant in averting illness of the Black population- a reflection of low MES coverage in this population group (Figure 2). Indians and Coloureds recorded significant improvement in illness. More specifically, the MES reduced illness by 3.3 percentage points in the Indian population, which implies an improvement of 8.7 percent in illness for this group. MES reduces illness by 1.2 percentage points in the Coloured population, which implies an improvement of 2.4 percent in this group's illness.
|
2SLS |
Whites |
Indians |
Coloureds |
Blacks |
|
Illness |
||||
|
MES |
-0.089*** |
-0.033*** |
-0.012*** |
-0.005 |
|
[0.006] |
[0.002] |
[0.002] |
[0.008] |
|
|
Education FE |
YES |
YES |
YES |
YES |
|
Province FE |
YES |
YES |
YES |
YES |
|
Year FE |
YES |
YES |
YES |
YES |
|
Intensity FE |
YES |
YES |
YES |
YES |
|
Gender FE |
YES |
YES |
YES |
YES |
|
Mean for illness |
0.388 |
0.377 |
0.49 |
0.491 |
|
Observations |
6010 |
3620 |
5797 |
7214 |
|
F-stat 1stSLS |
149.61 |
121.72 |
138.53 |
164.59 |
|
R-squared 2nd SLS |
0.06 |
0.05 |
0.05 |
0.07 |
Table 3: Impact of MES on illness.
Note: *** denotes a p value of < 0.05. Note: The results are from a 2SLS model. In the first stage equation the dependent variable is the probability of benefitting from MES while the instrument is a dummy variable equal to 1 for individuals treated with MES and 0 for individuals not treated with MES. In the second stage regression the dependent variable is a dummy variable of “experiencing illness”. Both regressions include education, province, year, intensity and gender fixed effects. Source: Stats-SA datasets from 2012-2019.
The results in Table 3 are exciting since the MES avert illness across the four population groups. However, there is no evidence of equality among the four racial groups. The cohorts that were favourably treated with the MES (Whites, Indians, and Coloureds) were the biggest beneficiaries in illness reduction, as presented in Table 3. Such an improvement in illness is reinforced by better access to healthcare (Table 2). For example, collectively, these population groups (Whites, Indians, and Coloureds) recorded an 11.4 percent average illness reduction. The least-benefited population group (Blacks) showed an insignificant 1 percent reduction in illness.
Considering that MES coverage is significant in improving illness, the study then focused on determining whether these positive outcomes for illness can be expected for both genders. The study repeated the same regressions only for males and only for females. Table 4 indicates that the MES reduces illness more for males than for females due to extensive MES coverage in the male population compared to females (Figure 3). The high coverage of MES in the male population groups reflects the patriarchal nature of South African society, with males having more jobs offering medical aid coverage compared to females.
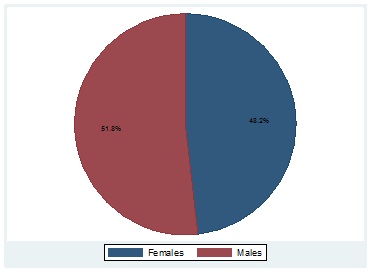 Figure 3: Percentage of MES receivers by gender.
Source: Own elaboration with data from Stats-SA annual surveys 2012-2019.
For example, the MES reduced illness by 30.7 percent for males and 15.9 percent for females when focusing on the White population group and 16.0 percent for males, and 2.7 percent for females when focusing on the Indian population. Once again, the least favourably treated cohorts (Blacks females) recorded an insignificant improvement in illness.
|
2SLS |
Whites |
Indians |
Coloureds |
Blacks |
|
Male illness |
||||
|
MES |
-0.113*** |
-0.055*** |
-0.015*** |
-0.008*** |
|
[0.003] |
[0.005] |
[0.004] |
[0.003] |
|
|
Female illness |
||||
|
MES |
-0.065*** |
-0.011*** |
-0.009*** |
-0.002 |
|
[0.005] |
[0.002] |
[0.003] |
[0.004] |
|
|
Education FE |
YES |
YES |
YES |
YES |
|
Province FE |
YES |
YES |
YES |
YES |
|
Year FE |
YES |
YES |
YES |
YES |
|
Intensity FE |
YES |
YES |
YES |
YES |
|
Mean for illness (male) |
0.368 |
0.343 |
0.46 |
0.45 |
|
Mean for illness (female) |
0.408 |
0.411 |
0.52 |
0.53 |
|
Observations |
6010 |
3620 |
5797 |
7214 |
|
F-stat 1stSLS (male) |
128.51 |
115.52 |
129.23 |
129.39 |
|
R-squared 2nd SLS (male) |
0.06 |
0.05 |
0.05 |
0.06 |
|
F-stat 1stSLS (female) |
133.55 |
121.41 |
130.23 |
137.39 |
|
R-squared 2nd SLS (female) |
0.07 |
0.06 |
0.06 |
0.07 |
Table 4: Impact of MES on illness by gender.
Note: *** denotes a p value of < 0.05. Note: The results are from a 2SLS model. In the first stage equation the dependent variable is the probability of benefitting from MES while the instrument is a dummy variable equal to 1 for individuals treated with MES and 0 for individuals not treated with MES. In the second stage regression the dependent variable is a dummy variable of “experiencing illness”. Both regressions include education, province, year and intensity fixed effects. Source: Stats-SA datasets from 2012-2019.
The study then explored the potential existence of educational differences in the impact of MES. The idea was that the least educated individuals were likely to have low MES coverage than educated individuals. Therefore, MES is expected to be biased towards the educated population groups (Figure 4). The paper considered individuals below grade 12 as least educated. Individuals who completed grade 12 and possess a tertiary qualification were classified as an educated group. Table 5 shows that the MES lowers the probability of illness significantly in the four racial groups of educated population. The impact of MES on the illness of least educated Blacks and Coloureds was found to be insignificant. These results are consistent with the views by the National Institute for Communicable Diseases in South Africa (SA News,2020), which stated that Blacks and Coloureds from lower socio-economic status were more likely to be ill and faces death compared to other racial groups-due to the poor household status of these cohorts. Race based interventions may be needed for these population groups [29].
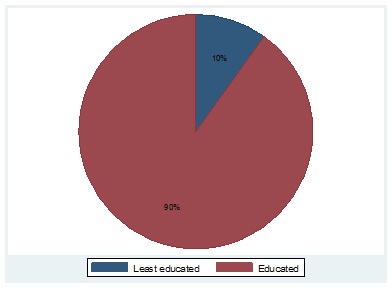 Figure 4: Percentage of MES principal holders by education class.
Source: Own elaboration with data from Stats-SA annual surveys 2012-2019.
|
2SLS |
Whites |
Indians |
Coloureds |
Blacks |
|
Least-educated illness |
||||
|
|
-0.053*** |
-0.007*** |
-0.001 |
-0.002 |
|
[0.003] |
[0.002] |
[0.007] |
[0.004] |
|
|
Year FE |
YES |
YES |
YES |
YES |
|
intensity FE |
YES |
YES |
YES |
YES |
|
Gender FE |
YES |
YES |
YES |
YES |
|
Province FE |
YES |
YES |
YES |
YES |
|
Mean for illness(educated) |
0.248 |
0.233 |
0.26 |
0.25 |
|
Mean for illness(least-ed) |
0.528 |
0.521 |
0.72 |
0.73 |
|
Observations |
6010 |
3620 |
5797 |
7214 |
|
F-stat 1stSLS(educated) |
129.41 |
118.72 |
128.47 |
132.44 |
|
R-squared 2nd SLS(educated) |
0.06 |
0.05 |
0.05 |
0.06 |
|
F-stat 1stSLS(least-ed) |
135.45 |
125.65 |
133.23 |
137.11 |
|
R-squared 2nd SLS(least-ed) |
0.06 |
0.06 |
0.06 |
0.06 |
Table 5: Impact of MES on illness by education level.
Note: *** denotes a p value of < 0.05. Note: The results are from a 2SLS model. In the first stage equation the dependent variable is the probability of benefitting from MES while the instrument is a dummy variable equal to 1 for individuals treated with MES and 0 for individuals not treated with MES. In the second stage regression the dependent variable is a dummy variable of “experiencing illness”. Both regressions include year, intensity, gender and province fixed effects. Source: Stats-SA datasets from 2012-2019.
The study explored the existence of heterogeneous results for resourced (urban)/under-resourced (rural) provinces. It defined under-resourced (rural) provinces as those in Eastern Cape, Free State, Limpopo, and KwaZulu Natal and considered Gauteng, Western Cape, North West, Northern Cape, and Mpumalanga as resourced (urban) provinces. This distinction was made based on the provincial GDP per capita being higher than 6.25 USD [30]. Table 6 shows the illness results for the population living in under-resourced (rural) and resourced (urban) provinces. The study noted that the MES reduces illness outcomes more substantially for resourced (urban) provinces. This difference is potentially a result of extensive MES coverage in rich provinces and high concentration of private hospitals in these provinces compared to under-resourced provinces. Also, resourced provinces are populated with quality doctors and other medical personnel than under-resourced provinces. These issues reinforced better illness improvement in the urban provinces. Blacks and Coloureds in the under-resourced (rural) provinces recorded insignificant illness outcomes once again.
|
2SLS |
Whites |
Indians |
Coloureds |
Blacks |
|
Urban illness |
||||
|
MES |
-0.133*** |
-0.060*** |
-0.020*** |
-0.009*** |
|
[0.004] |
[0.004] |
[0.003] |
[0.002] |
|
|
Rural illness |
||||
|
MES |
-0.045*** |
-0.006*** |
-0.004 |
-0.001 |
|
[0.003] |
[0.002] |
[0.003] |
[0.002] |
|
|
Year FE |
YES |
YES |
YES |
YES |
|
intensity FE |
YES |
YES |
YES |
YES |
|
Gender FE |
YES |
YES |
YES |
YES |
|
Education FE |
YES |
YES |
YES |
YES |
|
Mean for illness(urban) |
0.348 |
0.333 |
0.36 |
0.35 |
|
Mean for illness(rural) |
0.428 |
0.421 |
0.62 |
0.63 |
|
Observations |
6010 |
3620 |
5797 |
7214 |
|
F-stat 1stSLS(urban) |
130.11 |
119.14 |
129.2 |
133.78 |
|
R-squared 2nd SLS(urban) |
0.06 |
0.05 |
0.05 |
0.06 |
|
F-stat 1stSLS(rural) |
136.35 |
126.66 |
135.05 |
139.02 |
|
R-squared 2nd SLS(rural) |
0.06 |
0.06 |
0.06 |
0.06 |
Table 6: Impact of MES on illness by region.
Note:*** denotes a p value of < 0.05. Note: The results are from a 2SLS model. In the first stage equation the dependent variable is the probability of benefitting from MES while the instrument is a dummy variable equal to1 for individuals treated with MES and 0 for individuals not treated with MES. In the second stage regression the dependent variable is a dummy variable of “experiencing illness”. Both regressions include year, intensity, gender and education fixed effects. Source: Stats-SA datasets from 2012-2019.
Lastly, the study then explored the potential existence of spillover effects of the MES to health outcomes of children. The paper considered individuals between 0-17 years as children, and the analysis's idea is that generosity of MES advance children health outcomes and reproduces the current disparities of the four racial groups. Meaning, the poor health status of black parents adversely affects the child’s health yielding low illness improvement [31].Table 7 shows that the MES lowers the probability of illness. The impact is powerful in the White population group. More specifically, illness decreases by 1.4 percent for the least treated Black cohorts than 6.8 percent for the favorably treated White cohorts.
|
2SLS |
Whites |
Indians |
Coloureds |
Blacks |
|
Illness |
|
|||
|
MES |
-0.031*** |
-0.010*** |
-0.008*** |
-0.007*** |
|
[0.002] |
[0.002] |
[0.002] |
[0.001] |
|
|
Education FE |
YES |
YES |
YES |
YES |
|
Province FE |
YES |
YES |
YES |
YES |
|
Year FE |
YES |
YES |
YES |
YES |
|
Intensity FE |
YES |
YES |
YES |
YES |
|
Gender FE |
YES |
YES |
YES |
YES |
|
Mean for illness |
0.451 |
0.467 |
0.493 |
0.494 |
|
Observations |
7512 |
4525 |
7254 |
9017 |
|
F-stat 1stSLS |
141.61 |
136.72 |
138.53 |
154.59 |
|
R-squared 2nd SLS |
0.06 |
0.05 |
0.05 |
0.07 |
Table 7: Impact of MES on illness of children.
Note: *** denotes a p value of < 0.05. Note: The results are from a 2SLS model. In the first stage equation the dependent variable is the probability of benefitting from MES while the instrument is a dummy variable equal to1 for individuals treated with MES and 0 for individuals not treated with MES. In the second stage regression the dependent variable is a dummy variable of “experiencing illness”. Both regressions include education, province, year, intensity and gender fixed effects. Source: Stats-SA datasets from 2012-2019.
Robustness test
In this section, the paper provides robustness checks and additional results to reinforce the current estimation's validity. Tables 1A and 2A in the Appendix show the OLS regressions' results for healthcare access and illness for comparison purposes. The variable of interest is now the variable in the survey that identifies the receipt of the MES. The study also included education, intensity, year, province, and gender fixed effects. As explained above, there are reasons to believe that this is not a randomly assigned programme. Therefore, the OLS estimation may be overestimating or underestimating the MES's effects on access to healthcare and illness outcomes. Many unobserved variables may directly affect the access to healthcare and illness outcomes, such as household income from relatives, access to the necessary information, and proximity to healthcare facilities. Indeed, the results in Table 1A and 2A are all substantially bigger in magnitude than the baseline results of the 2SLS models presented in Table 3A, and this is consistent with the OLS model overestimating the real effects of the MES results.
|
OLS |
Whites |
Indians |
Coloureds |
Blacks |
|
Access to healthcare |
||||
|
MES |
0.258*** |
0.126*** |
0.079*** |
0.055*** |
|
[0.005] |
[0.003] |
[0.008] |
[0.001] |
|
|
Education FE |
YES |
YES |
YES |
YES |
|
Province FE |
YES |
YES |
YES |
YES |
|
Year FE |
YES |
YES |
YES |
YES |
|
Intensity FE |
YES |
YES |
YES |
YES |
|
Gender FE |
YES |
YES |
YES |
YES |
|
Mean for access |
0.765 |
0.584 |
0.39 |
0.285 |
|
Observations |
6010 |
3620 |
5797 |
7214 |
Table 1A: Impact of MES on access to healthcare.
Note: ***denotes a p value of < 0.05. Note: The results are from an OLS model. Regressions include education, province, year, intensity and gender fixed effects. Source: Stats-SA datasets from 2012-2019.
|
OLS |
Whites |
Indians |
Coloureds |
Blacks |
|
Illness |
|
|||
|
MES |
-0.122*** |
-0.058*** |
-0.033*** |
-0.018 |
|
[0.004] |
[0.002] |
[0.003] |
[0.010] |
|
|
Education FE |
YES |
YES |
YES |
YES |
|
Province FE |
YES |
YES |
YES |
YES |
|
Year FE |
YES |
YES |
YES |
YES |
|
Intensity FE |
YES |
YES |
YES |
YES |
|
Gender FE |
YES |
YES |
YES |
YES |
|
Mean for illness |
0.388 |
0.377 |
0.49 |
0.491 |
|
Observations |
6010 |
3620 |
5797 |
7214 |
Table 2A: Impact of MES on illness.
Note: *** denotes a p value of < 0.05. Note: The results are from an OLS model. Note: Regressions include education,province, year, intensity and gender fixed effects. Source: Stats-SA datasets from 2012-2019.
|
2SLS |
Whites |
Indians |
Coloureds |
Blacks |
|
Illness |
|
|||
|
Fake MES |
-0.122 |
-0.058 |
-0.033 |
-0.018 |
|
[1.096] |
[1.079] |
[1.085] |
[1.098] |
|
|
Education FE |
YES |
YES |
YES |
YES |
|
Province FE |
YES |
YES |
YES |
YES |
|
Year FE |
YES |
YES |
YES |
YES |
|
Intensity FE |
YES |
YES |
YES |
YES |
|
Gender FE |
YES |
YES |
YES |
YES |
|
Observations |
3293 |
1703 |
3080 |
3697 |
|
F-stat 1stSLS |
0.01 |
0.25 |
0.37 |
0.39 |
Table 3A: Impact of Fake MES on illness.
Finally, the study ran some placebo regressions in which the study "pretended" that comparison (unaffected) population groups were treated with a fake MES. Thus, it excluded from the sample the cohorts that were genuinely affected by the MES. The study then assigned as treated cohorts affected by the fake MES those who were less than 37 years and used as comparison cohorts those older than 37 years. The study then ran the same 2SLS.
One can see in Table 3A in the Appendix that the F-test of the first-stage regression is extremely low (which suggests that the instrument is not relevant). The treatment variable is not significant across the racial groups: Therefore, the results of these placebo tests analysing the effects of the fake MES reinforce the validity of the study's identification strategy and provide additional evidence of the fulfilment of the exclusion restriction criteria as any cohort-specific events that are not captured by the year and intensity fixed effects that could be biasing the main results should also provide significant results in these placebo tests.
Limitations
The author acknowledges that the current binary variables do not capture all the comprehensive health outcomes linked to these population groups. However, there is no advanced information on the determinants of health in the household survey. Thus, the study interprets the results as providing evidence of a substantial improvement in access to healthcare and illness outcomes attributed to the MES while not capturing other qualitative changes that may further explain these health outcomes. For example, illness can also be driven by household factors like access to quality food [32]. Parents' stress can influence adults' health outcomes later in life [33]. Unfortunately, the survey does not contain such information. Hence, the study was unable to control for these aspects.
Policy implications
The study's results have significant policy implications. The current behaviour of MES discriminating against non-whites medical professionals is likely to widen the existing health inequalities in the post-apartheid South Africa [34]. Equality has been proven to be a positive driver of health outcomes [35].The South African government working with the Council for Medical Schemes (CMS) may need to develop an anti-racism policy to ensure equal treatment and protection of all practitioners against racial abuse. Each practitioner must contribute to advancing health outcomes without racial prejudices which may entrench historic health inequalities. The current desires to achieve universal health coverage will be undermined by institutional abuse if anti-racism policies are not adopted.
Conclusion
Access to healthcare and reduced illness is widely seen as a crucial part of any health system performance. This paper has examined the MES's effect on illness and healthcare access, focusing on the four racial groups in South Africa using a large longitudinal sample.
The estimation shows that the MES has a significant effect, improving illness and access to healthcare. These results support the international studies arguing that the MES expansion improves health outcomes [36]. The current results also support [37], who discovered that the MES advances good treatment procedures in developing countries and boost the existing health outcomes. Indeed, the MES in South Africa not only improves access to healthcare but also avert illness.
Such improvements are an important finding considering the existing evidence in the literature that shows positive long-term labour market outcomes of healthy population groups. The study found that the MES's impact is more substantial for Whites, males, educated class residing in urban regions. Therefore, there is no evidence that MES has undermined the legacy of apartheid as yet, with Blacks recording lower outcomes compared to the other three racial groups. The study also analysed the difference in the MES's impact on resourced and under-resourced provinces in South Africa and found that the MES improves illness to a more considerable extent in resourced provinces.
These results are significant from a policy point of view as they point out the health effects of the MES in the post-apartheid South Africa. The results also highlight the groups of adults and children that manage to benefit more from MES.
Funding
This research did not receive any specific grant from funding agencies in the public, commercial, or not-for-profit sectors.
Competing interest
None
Ethics approval
My institutions do not require ethical approval for this type of study.
Project Details
This research is part of a collaborative project designed to investigate policies that support the engineering of resilient health systems in developing countries.
References
- Cameron N (2013) Physical growth in a transitional economy: The aftermath of South African apartheid. Economics & Human Biology 1: 29-42.
- Coovadia H, Jewkes R, Barron P, Sanders D, McIntyre D (2009) The health and health system of South Africa: historical roots of current public health challenges. Lancet 374: 817-834.
- Cullen M (2020) Health disparities during apartheid in South Africa.
- Benatar S (1986) Medicine and health care in South Africa. N Engl J Med 315: 527-532.
- Mayosi B (2014) Health and health care in South Africa-20 years after Mandela. N Engl J Med 371: 1344-1353.
- Mhongera P, Lombard A (2020) Pathways of resilience for children facing socio-economic adversities: Experiences from Future Families’ OVC programmes in South Africa. Children and Youth Services Review 108: 104657.
- Burger R, Christian C (2018) Access to health care in post-apartheid South Africa: Availability, affordability, acceptability. Health Economics Policy and Law 15: 43-45.
- Nevondwe L, Odeku K (2014) Financing the national health insurance scheme of South Africa: Opportunities and challenges. J Soc Sci 39: 9-18.
- Ngcukaitobi T, Williams K, Hassim A (2021) Section 59 Investigation. Established in terms of Section 7(a) (b) (c) (d), 8(a) and (k) and 9(2) of the Medical Schemes Act, 131 of 1998.
- Council for Medical Schemes (CMS) (2020) Council for Medical Schemes Annual Report-2019/2020. Pretoria: CMS, 2019/2020.
- Griffiths P, Johnson W, Cameron N, Pettifor J, Norris S (2013) In urban South Africa, 16-year-old adolescents experience greater health equality than children. Economics & Human Biology 11: 502-514.
- Averett S, Stacey N, Wang Y (2014) Decomposing race and gender differences in underweight and obesity in South Africa. Economics & Human Biology 15: 23-40.
- Lennon C (2021) Are the costs of employer-sponsored health insurance passed on to workers at the individual level? Economics & Human Biology 41: 100995.
- Marton J, Yelowitz A, Talbert J (2014) A tale of two cities? The heterogeneous impact of Medicaid managed care. Journal of Health Economics 36: 47-68.
- Main G, Montserrat C, Andresen S, Bradshaw J, Lee B (2019) Inequality, material well-being, and subjective well-being: Exploring associations for children across 15 diverse countries. Children and Youth Services Review 97: 3-13.
- Legotlo G, Mutezo A (2018) Understanding the types of fraud in claims to South African medical schemes. SAMJ 108: 299-303.
- Bateman C (2015) Medical aids often their own worst enemies with fraud. S Afr Med J 105: 887.
- SA-CSI (2019) 2019-Customer Satisfaction Index for Medical Schemes Shows Underwhelming Performances.SA-CSI October 17.
- Competition Commission (2019) Health market inquiry. Final findings and recommendations report. Competition Commission. September.
- Barber S, Kumar A, Roubal T, Colombo F, Lorenzoni L (2018) Harnessing the private health sector by using prices as a policy instrument: Lessons learned from South Africa. Health Policy 122: 558-564.
- Shrank W, Rogstad T, Parekh N (2019) Waste in the US Health Care System: Estimated Costs and Potential for Savings. JAMA 322: 1501-1509.
- Mostert C (2018) US Health Spending Problems. Health Affa irs 37: 493-497.
- Pardo C (2019) Health care reform, adverse selection, and health insurance choice. Journal of Health Economics 67: 102221.
- Sohn H, Timmermans S (2017) Social effects of health care reform: Medicaid expansion under the affordable care act and changes in volunteering. Socius 3.
- Statistics South Africa (2021) About the Statistics Act. Pretoria (South Africa): Statistics South Africa.
- Statistics South Africa (2021a) Purpose of Act. [Internet]. Pretoria (South Africa): Statistics South
- Mostert C, Vall J (2020) Long run educational and spillover effects of unconditional cash transfers: Evidence from South Africa. Economics & Human Biology 36: 100817.
- Mostert C (2021) The impact of the school feeding programme on the education and health outcomes of South African children. Children and youth service review 126: 106029.
- Mohamud F, Edwards T, Antwi-Boasiako K, William K, King J, et al. (2021) Racial disparity in the Ontario child welfare system: Conceptualizing policies and practices that drive involvement for Black families. Children and Youth Services Review 120: 105711.
- SA News (2020) Black Africans, Coloureds, and males likely to die of COVID-19. South African Government News Agency. August 20.
- Shaheen A, Hamdan K, Nassar O, Albqoor A (2020) Determinants of child health status: Parent-reported health status in Jordan. Children and Youth Services Review 114: 105036.
- Jürges H, Kopetsch T (2021) Prenatal exposure to the German food crisis 1944-1948 and health after 65 years. Economics & Human Biology 40:100952.
- Zheng X, Shangguan S, Fang Z, Fang X (2021) Early-life exposure to parental mental distress and adulthood depression among middle-aged and elderly Chinese. Economics & Human Biology 41: 100994.
- Van den Heever A (2016) South Africa's universal health coverage reforms in the post-apartheid period. Health Policy 120: 1420-1428.
- Sinha A, McRoy R, Berkman B, Sutherland M (2017) Drivers of change: Examining the effects of gender equality on child nutrition. Children and Youth Services Review 76: 203-212.
- McInerney M, Meiselbach M (2020) Distributional effects of recent health insurance expansions on weight-related outcomes. Economics & Human Biology 38: 100870.
- Lei L, Liu F (2021) Medicaid coverage and use of nicotine replacement treatment. Economics & Human Biology 40: 100938.
Citation: Mostert CM (2021) The Impact of the Medical Aid Schemes on Health Outcomes of the South African Population in the Post-Apartheid Era.J Community Med Public Health Care 8: 92
Copyright: © 2021 Cyprian M Mostert, et al. This is an open-access article distributed under the terms of the Creative Commons Attribution License, which permits unrestricted use, distribution, and reproduction in any medium, provided the original author and source are credited.