The Role of mir-152 and DNMT1 in Gastric Cancer Cell Proliferation and Invasion
*Corresponding Author(s):
Fangyu WangNanjing School Of Clinical Medicine, Southern Medical University, Nanjing, Jiangsu Province, China
Tel:+86 2552155853,
Fax:+86 2552155853
Email:wangfy65@nju.edu.cn; wangfangyuand@163.com
Abstract
Background: Multimolecular mechanisms and multifactorial are involved in Gastric Cancer?GC? initiation and progress. Previous studies showed that miR-152 expression was deregulated in many tumors. Similar to dysregulated expression of miRNA, Over expression of DNA methyltransferase member plays crucial roles in GC. In this study we aimed to investigate how miR-152 and DNMTs act on GC.
Methods: In our study, the expression of miR-152 and DNMT1 were firstly detected in 80 primary GC tissues and their corresponding non-tumor tissues by in situ hybridization, Western blot, immunohistochemistry and quantitative real-time PCR analyzed the difference between the expression and clinicopathological features. Next, the effects of miR-152 on GC cell growth were evaluated by gain function analysis. Then analyzed the expression and relation of miR-152 and DNMT1 in different Gastric cancer cells by quantitative real-time PCR and Western blot. Finally, the target genes of miR-152 in GC cells were explored.
Results: The study demonstrated that miR-152 expression was significantly down regulated in GC tissues compared with the corresponding non tumor tissues. We also showed that miR-152 expression was significantly down regulated in GC cell lines. Ectopic expression of miR-152 suppressed GC cell proliferation, colony formation and invasion. Moreover, we identified DNA Methyltransferase 1 (DNMT1) as a direct target gene of miR-152 in GC cell. DNMT1 expression was unregulated in GC tissues and cells. Furthermore, the expression level of miR-152 was negatively correlated with the expression level of DNMT1 in GC tissues (R2=0.546, P < 0.001). Moreover, DNMT1 over expression rescued the effect of miR-152 mediated GC cell proliferation, colony formation and invasion.
Conclusion: Our finding demonstrated that miR-152 might play as a tumor suppressor miRNA partly through targeting DNMT1 expression. Restoration of miR-152 may be a potential therapeutic strategy for GC patients in the future.
Keywords
INTRODUCTION
Gastric cancer is the fourth most common human malignant disease and the second leading cause of cancer related mortality worldwide on the basis of the most recent statistics, with particularly high incidences and mortality rates in eastern Asia [1-4]. Gastric cancer is a multifactorial disease. Genetic predisposition and environmental factors have been recognized to be involved in gastric cancer initiation and progress. Large scale multidisciplinary investigations on gastric cancer have indicated that gastric cancer is a multiple gene disease and a series of molecules are involved in gastric cancer carcinogenesis [5,6]. Nevertheless, relatively little is known about how specific molecules are involved in the initiation and progression of gastric cancer. Consequently, elucidation of the molecular mechanisms of the carcinogenesis of gastric cancer will be benefit for enhancing prevention, detection and treatment of this disease.
MicroRNAs (miRNAs) constitute a dominating class of small RNAs in most somatic tissues. In RNA silencing, miRNA functions play as a guide to induce translational repression, mRNA deadenylation and mRNA decays by base pairing with its target mRNAs [7]. miRNA - binding sites are usually located in the 3 Untranslated Region (UTR) of mRNAs [8]. More than 60% of human protein-coding genes contain at least one conserved miRNA - binding site, and considering that numerous non-conserved sites also exist, most protein-coding genes may be under the control of miRNAs [9]. A lot of study suggested that miRNA plays crucial roles in many biological processes such as development, inflammation, differentiation, cell proliferation, apoptosis and invasion [10-13]. Thus, their dysregulation is often associated with human diseases, including cancer and neurodevelopmental disorders [14,15].
Emerging evidences have demonstrated that miRNA are deregulated in various cancers including breast cancer, gallbladder cancer, bladder cancer, cutaneous squamous cell carcinoma, laryngeal cancer, rhabdomyosarcoma and GC [16-21]. miRNA can act as a tumor suppressor gene or oncogene in the initiation and development of tumors [12,22,23]. Recently, increasing studies have demonstrated that miR-152 are decreased in various tumor types, indicating that they have the potential to act as tumor-suppressor miRNAs [24-26]. miR-152 plays an important role in various tumors [27-29]. However, the expression and functional role of miR-152 in GC is still unknown. In this study, we studied the relation between miR-152 and DNMT1 in GC cell proliferation and invasion to show the role of miR-152 and DNMT1 in the development of GC.
MATERIALS AND METHODS
Tissue samples
In Situ Hybridization (ISH)
Immunohistochemistry
Evaluation of staining:
Cell lines cultured and transfection
Quantitative real-time RT-PCR
The sequences of RT primers were: miR-152: 5?-GTCGTATCCAGTGCAGGGTCC GAGGTATTCGCACTGGATACGCCCAAGT-3? and U6: 5?-AACGCTTCACGA ATTTGCGT-3?. The sequences of PCR primers used were as follows: miR-152 forward 5?-GAGTGCTCAGTGCATGCAG-3? and reverse 5?-GTGCAGGGTCCG AGGT-3?; DNMT1, forward 5?-GCTACCTGGCTAAAGTCAAA -3? and reverse 5?-CCATTCCCACTCTACGG-3?; β-Actin, forward 5?-AGTGTGCGTGGCATCC GCAAAG-3? and reverse 5?-ATCCACATCTGCTGGAAGGTGGC-3?; U6 forward 5?-GCTTCGGCAGCACATATACTAAAAT-3? and reverse 5?-CGCTTCACGAATT TGCGTGTCAT-3?. The relative miR-152 expression was normalized to U6 SnRNA and the expression of DNMT1 was normalized to β-Actin.
Construction of Vectors
Dual-luciferase reporter assay
Western blot
DNMT1 and β-Actin (Abcam, England). Blots were measured by using the ECL system.
Cell growth and colony formation
Cell invasion
Statistical analysis
RESULTS
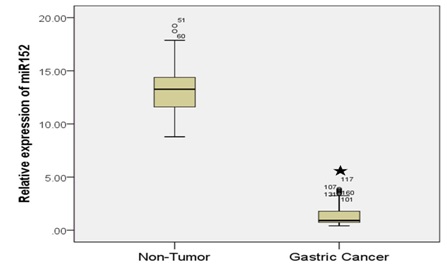
miR-152 expression was down regulated in the GC cell and tissue
Clinicao pathologic features of gastric cancer patient are listed in table 1.
|
Parameter |
N (%) |
miR-152 |
X2 |
P |
|
|
Lower |
Higher |
||||
|
Gender |
|||||
|
Male |
63(78.75) |
53(66.25) |
10(12.5) |
3.156 |
0.093 |
|
Female |
17(21.25) |
11(13.75) |
6(7.45) |
|
|
|
Age (years) |
|||||
|
≤ 60 |
28(35) |
23(28.75) |
5(6.25) |
4.515 |
0.034 |
|
> 60 |
52(65) |
41(51.25) |
11(13.75) |
|
|
|
Tumor location |
|||||
|
Proximal |
42(52.5) |
33(41.25) |
9(11.25) |
0.965 |
0.617 |
|
Middle |
21(26.25) |
16(20) |
5(6.25) |
|
|
|
Distal third |
17(21.25) |
15(18.75) |
2(2.5) |
|
|
|
Tumor size (cm) |
|||||
|
≤ 3 cm |
41(51.25) |
29(36.25) |
12(15) |
3.405 |
0.065 |
|
> 3 cm |
39(48.75) |
35(43.75) |
4(5) |
|
|
|
Pathological differentiation |
|||||
|
High |
37(46.25) |
31(38.75) |
6(7.5) |
1.036 |
0.596 |
|
Moderate |
36(45) |
27(33.75) |
9(11.25) |
|
|
|
Poor |
7(8.75) |
6(7.5) |
1(1.25) |
|
|
|
Depth of invasion |
|||||
|
Mucosa and muscular |
18(22.5) |
10(12.5) |
8(10) |
8.674 |
0.003 |
|
Submucosa and serosa |
62(77.5) |
54(67.5) |
8(10) |
|
|
|
Lymph node metastasis |
|||||
|
No |
30(37.5) |
14(17.5) |
16(20) |
33.333 |
0 |
|
Yes |
50(62.5) |
50(62.5) |
0 |
|
|
|
TNM stage |
|||||
|
I+II |
35(43.75) |
19(23.75) |
16(20) |
25.714 |
0 |
|
III+IV |
45(56.25) |
45(56.25) |
0 |
|
|
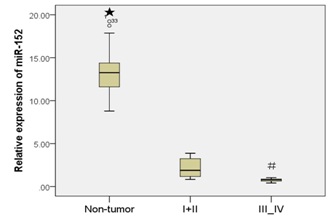
Moreover, patients with the early stages (stage I and II) had a much higher miR-152 expression than patients with the advanced stages (stage III and IV) (Figure 1C).
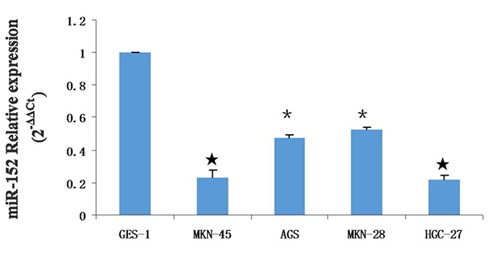
Unfortunately, due to a lack of follow-up data, the correlation between miR-152 expression and prognosis could not be investigated. In addition, we also demonstrated that miR-152 expression was decreased in the GC cell lines compared with normal gastric mucosa cells line (GES-1) (Figure 1D).
?- P < 0.05,?- P < 0.01,? - P < 0.001.
Among these GC cell lines, MKN-45 and HGC-27 cells displayed the most reduction (approximated 80%) in miR-152 expression compared with its expression in GES-1. Hence, further functional analyses on miR-152 were performed in MKN-45 and HGC-27 cells. Taken together, our data showed that miR-152 expression was downregulated in both human GC tissues and GC cell lines, and its downregulation was correlated with clinicopathological features of GC, which indicates that miR-152 may play a vital role in GC progression and development.
Differential expression of DNMT family members in gastric cancer
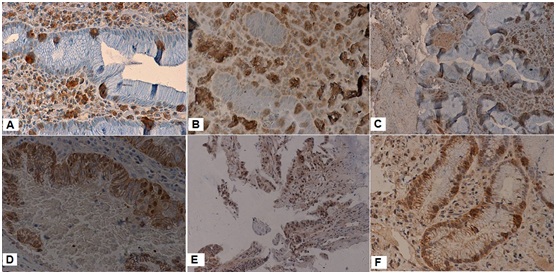
DNMT expression in non cancerous tissue was primarily focused on the proliferating zone of gastric mucosa. DNMTs perform DNA methylation in the nucleus; thus, nuclear staining was investigated. The positive expression rate of DNMT1 was higher than DNMT3a and DNMT3b in GC (Table 2).
|
Parameter |
n |
DNMT1 |
DNMT 3a |
DNMT 3b |
|
Expression (%) |
Expression (%) |
Expression (%) |
||
|
Gender |
||||
|
Male |
63 |
46(57.5) |
23(28.75) |
25(31.25) |
|
Female |
17 |
9(11.25) |
8(10) |
7(8.75) |
|
P |
|
0.113 |
0.576 |
0.911 |
|
Age (years) |
||||
|
≤ 60 |
28 |
20(25) |
12(15) |
13(16.25) |
|
> 60 |
52 |
35(43.75) |
19(23.75) |
19(23.75) |
|
P-value |
|
0.704 |
0.635 |
0.389 |
|
Tumor location |
||||
|
Proximal |
42 |
30(37.5) |
17(21.25) |
18(22.5) |
|
Middle |
21 |
11(13.75) |
8(10) |
7(8.75) |
|
Distal third |
17 |
14(17.5) |
6(7.5) |
7(8.75) |
|
P-value |
|
1.121 |
0.931 |
0.763 |
|
Tumor size (cm) |
||||
|
≤ 3cm |
41 |
26(32.5) |
18(22.5) |
16(20) |
|
> 3cm |
39 |
29(36.25) |
13(16.25) |
16(20) |
|
P- value |
|
0.291 |
0.332 |
0.855 |
|
Differentiation |
||||
|
High |
37 |
29(36.25) |
12(15) |
15(18.75) |
|
Moderate |
36 |
22(27.5) |
16(20) |
14(17.5) |
|
Poor |
7 |
4(5) |
3(3.75) |
2(2.5) |
|
P-value |
|
0.222 |
0.559 |
0.809 |
|
Depth of invasion |
||||
|
Mucosa and muscular |
18 |
8(10) |
8(10) |
6(7.5) |
|
Submucosaand serosa |
62 |
47(58.75) |
23(28.75) |
26(32.5) |
|
P-value |
|
0.011? |
0.573 |
0.512 |
|
Lymph node metastasis |
||||
|
No |
30 |
8(10) |
12(15) |
14(17.5) |
|
Yes |
50 |
47(58.75) |
19(23.75) |
18(22.5) |
|
P-value |
|
0.000? |
0.859 |
0.346 |
|
TNM stage |
||||
|
I+II |
35 |
15(18.75) |
15(18.75) |
17(21.25) |
|
III+IV |
45 |
40(50) |
16(20) |
15(18.75) |
|
P-value |
|
0.000? |
0.506 |
0.168 |
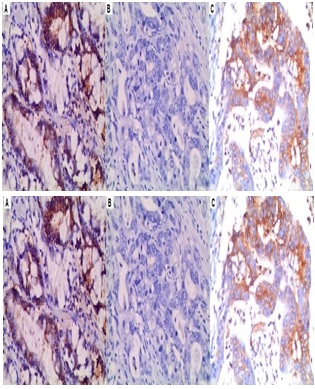
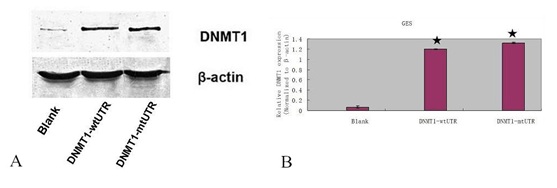
DNMT1 expression was upregulated in the GC cell and tissues
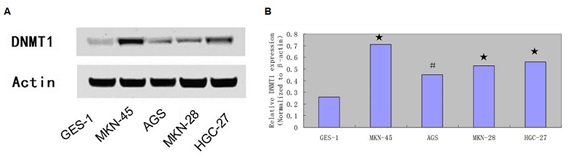
(B) The mRNA expression of DNMT1 was measured by qRT-PCR.
?- P < 0.05, ? - P < 0.001.
Moreover, DNMT1 expression was upregulated in 55 cases (55/80; 68.75%) compared with the adjacent tissues (Table 2). There was a negative relationship between the expression level of miR-152 and DNMT1 in the GC tissues (R2 = 0.546, P < 0.001) (Figure 4).
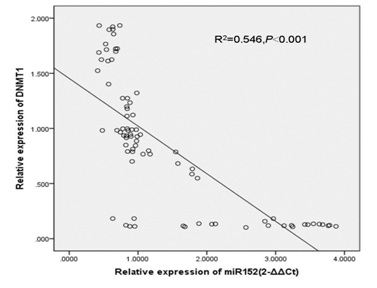 Figure 4: There was negative relationship between the expression level of miR-152 and DNMT1 in the GC tissues.
miR-152 suppressed the GC cell proliferation, colony formation and invasion
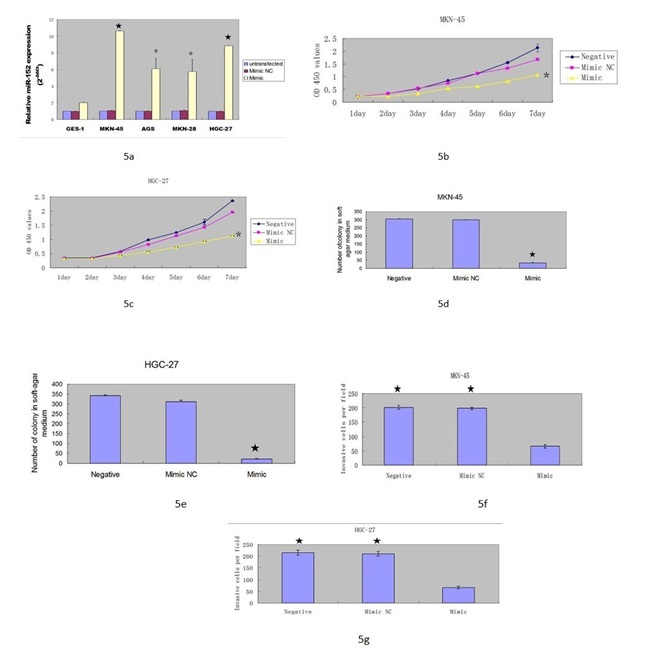
(B & C) Overexpression of miR-152 suppressed the MKN-45 and HGC-27 cell proliferation.
(D & E) Ectopic expression of miR-152 inhibited the MKN-45 and HGC-27 cell colony information.
(F & G) miR-152 overexpression suppressed the MKN-45 and HGC-27 cell invasion.
?- P < 0.001, ?- P < 0.05.
DNMT1 was a direct target gene of miR-152 in GC cell
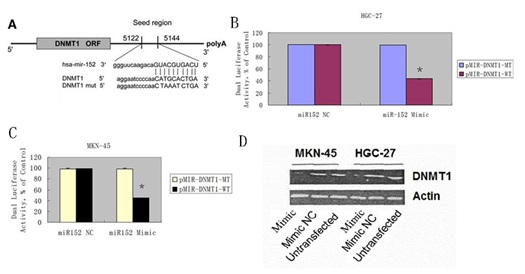
(B & C) Luciferase activity assays of luciferase vectors with wild-type or mutant DNMT1 3?-UTR were performed after co-transfection with miR-152 mimic or mimic NC in the MKN-45 and HGC-27 cell.
(D) Overexpression of miR-152 suppressed the DNMT1 protein expression in the MKN-45 and HGC-27 cell.
?- P < 0.05 miR-152 mimic and wild-type DNMT1 3?-UTR co-transfection group vs. other three groups.
DNMT1 rescued the effect of miR-152-mediated GC cell proliferation, colony formation and invasion
(B) The mRNA expression of DNMT1 was measured by qRT-PCR. ? - P < 0.001.
We rescued DNMT1 expression in the miR-152 overexpressing MKN-45 and HGC-27 cell in the pCDNADNMT1- MT 3?-UTR treated group (Figures 8A & 8B). Furthermore, overexpression of miR-152 suppressed the DNMT1 protein expression in the MKN-45 and HGC-27 cell with wt DNMT1 3?-UTR. CCK8 analysis demonstrated that DNMT1 overexpression promoted the miR-152-overexpressing MKN-45 and HGC-27 cell proliferation (Figures 8C & 8D). Colony formation analysis showed that DNMT1 overexpression increased the miR-152 overexpressing MKN-45 and HGC-27 cell colony formation (Figures 8E & 8F). Invasion analysis demonstrated that ectopic expression of DNMT1 promoted the miR-152-overexpressing MKN-45 and HGC-27 cell invasion (Figures 8G & 8H).
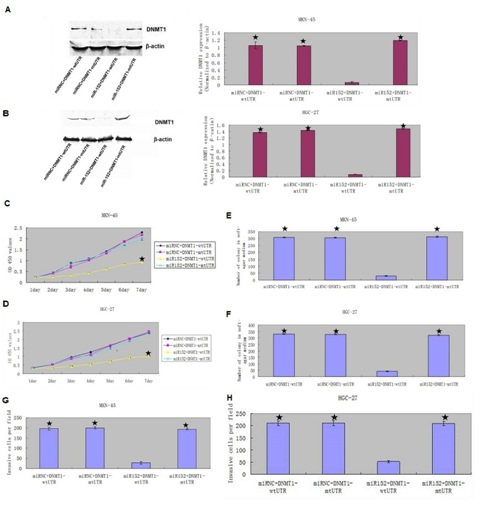
(C & D) Overexpression of DNMTI promoted the miR-152 overexpressing MKN-45 and HGC-27 cell proliferation compared with the group of decreased expression of DNMT1.
(E & F) DNMT1 overexpression increased the miR-152 overexpressing MKN-45 and HGC-27 cell colony formation compared with the group of decreased expression of DNMT1.
(G & H) Ectopic expression of DNMT1 promoted the miR-152-overexpressing MKN-45 and HGC-27 cell invasion compared with the group of decreased expression of DNMT1.
? – P < 0.001, co-transfected with miR-152 mimic and pCDNADNMT1-wt3?-UTR vs. Other three groups.
DISCUSSION
There has been a rapid increase in the number of publications focusing on miR?152 in recent years, which revealed that the expression of miR?152 was inhibited in a variety of tumors, including ovarian cancer [25], endometrial cancer [26], liver cancer [29], non-small lung cancer [28], and colorectal cancer [27]. Here, we investigate the functions of miR-152 in GC and found that miR-152 expression was signifycantly downregulated in GC tissues and cell lines. On the other hand, overexpression of miR-152 significantly inhibited cell proliferation, colony formation and tumor angiogenesis in vitro studies. Su et al., demonstrated that restoration of miR-152 significantly reduced cell proliferation, colony formation, migration and invasion partially via targeting ADAM17 [30]. In addition, miR?152 is also able to target Wnt1 and MMP3 to inhibit cell proliferation in liver cancer cells, thus reducing glioma cell invasion and angiogenesis, respectively [31]. Our study also showed ectopic expression of miR-152 suppressed GC cell proliferation, colony formation and invasion. These findings suggest that miR?152 may potentially function as a tumor suppressor in human cancer.
Aberrant DNA hypermethylation of tumor suppressor genes, Global DNA hypermethylation (GDM) and disruption of histone modification patterns are the three most important epigenetic changes contributing to the malignant phenotype [32]. In particular, DNA hypermethylation may be important in the initiation of multiple types of cancer [32,33]. Nakajima et al., also found that DNA methylation levels in the gastric mucosae correlate with gastric cancer risk levels [34]. Methylation of mammalian genomic DNA is catalyzed by DNMTs. The mammalian DNMT family includes three active members: DNMT1, DNMT3a and DNMT3b [35,36]. The human DNMT 1, 3a, and 3b coordinate mRNA expression in normal tissues and overexpression in tumors [37]. The expression levels of these DNMTs are reportedly elevated in human cancers [36-39]. There is considerable evidence indicating an up-regulation of DNMT1 in cancer [40,41]. In our study, the positive expression rate of DNMT1 was higher than DNMT3a and DNMT3b in GC. And DNMT1 expression was significantly related with depth of invasion, Lymph node metastasis and TNM stage of GC.
Recent studies have found that DNMT1 plays important roles in the GC development [42-44]. But there was no evidence to show the relation between DNA hypermethylation and miR-152 in GC. Here, we identified DNMT1 as a direct target gene of miR-152 in GC cell and DNMT1 expression was upregulated in GC tissues and cells. Furthermore, the expression level of miR-152 was negatively correlated with the expression level of DNMT1 in the GC tissues. DNMT1 overexpression rescued the effect of miR-152 mediated GC cell proliferation, colony formation and invasion. These observations are consistent with previous findings that miRNA-152 induces aberrant DNA methylation in hepatitis B virus - related hepatocellular carcinoma and endometrial cancer by targeting DNMT1 [24]. Our findings indicate that miR-152 directly interacted with the DNMT1 and the lower levels of miR-152 expression in GC cells may be one of the reasons for the abnormal expression of DNMT1, which leads to aberrant DNA methylation, contributing to GC tumorigenicity and development.
This study was limited by its small number of patients and cancer-related genes. Thus, larger multi-gene studies are needed to validate our results. Further work is necessary to elucidate the exact function and interaction with other factors to develop strategies for early diagnosis, prevention and treatment of GC. On the other hand, some researches provided evidences that the down expression of miR-152 in NiS-transformed cells was regulated by DNMT1 via promoter hypermethylation, and miR-152 was linked to DNA methylation by directly targeting DNMT1 3′-UTR, revealing a crucial functional crosstalk between miR-152 and the DNMT1 via a double-negative feedback loop is involved in NiS-induced malignant transformation [45,46]. miR-152 is located at 17q21.32, and a typical CpG is land is around miR-152 promoter. Recently, relatively low expression of miR-152 was shown in gastrointestinal cancer and cholangiocarcinoma [47,48]. DNA hypermethylation and downregulation of miR-152 were frequently observed in endometrial cancer cell lines and primary tumors [26]. Aberrant DNA methylation of miR-152 CpG islands was reported to correlate with a poor clinical outcome in Mixed Lineage Leukemia (MLL) - rearranged acute lymphoblastic leukemia [49]. Therefore, the next study needs to identify the influence of DNMT1 on the expression of miR-152 in GC.
In conclusion, miR-152 maybe acts as a tumor suppressor miRNA in the development of GC through inhibiting DNMT1 expression. Therefore, restoration of miR-152 may be a potential therapeutic strategy for GC patients in the future.
Ethical approval The study protocol was approved by the Ethics Committee of Jinlin Hospital (Nanjing, China).
AUTHOR CONTRIBUTIONS
Wang ZK wrote the paper; Ye YQ and Wang SD designed and analyzed; Shi H and Wu L collected the specimen; Yuan BS and Wang H reviewed histopathology of specimen.
REFERENCES
- Liang J, Liu X, Xue H, Qiu B, Wei B, et al. (2015) MicroRNA-103a inhibits gastric cancer cell proliferation, migration and invasion by targeting c-Myb. Cell Prolif 48: 78-85.
- Duan JH, Fang L (2014) MicroRNA-92 promotes gastric cancer cell proliferation and invasion through targeting FXR. Tumour Biol 35: 11013-11019.
- Liu G, Jiang C, Li D, Wang R, Wang W (2014) MiRNA-34a inhibits EGFR-signaling-dependent MMP7 activation in gastric cancer. Tumour Biol 35: 9801-9806.
- Wan X, Ding X, Chen S, Song H, Jiang H, et al. (2015) The functional sites of miRNAs and lncRNAs in gastric carcinogenesis. Tumour Biol 36: 521-532.
- Tamura G (2006) Alterations of tumor suppressor and tumor-related genes in the development and progression of gastric cancer. World J Gastroenterol 12: 192-198.
- Wu WK, Cho CH, Lee CW, Fan D, Wu K, et al. (2010) Dysregulation of cellular signaling in gastric cancer. Cancer Lett 295: 144-153.
- Huntzinger E, Izaurralde E (2011) Gene silencing by microRNAs: contributions of translational repression and mRNA decay. Nat Rev Genet 12: 99-110.
- Bartel DP (2009) MicroRNAs: target recognition and regulatory functions. Cell 136: 215-233.
- Friedman RC, Farh KK, Burge CB, Bartel DP (2009) Most mammalian mRNAs are conserved targets of microRNAs. Genome Res 19: 92-105.
- Yu X, Li Z, Chen G, Wu WK (2015) MicroRNA-10b induces vascular muscle cell proliferation through Akt pathway by targeting TIP30. Curr Vasc Pharmacol 13: 679-686.
- Song JH , Meltzer SJ (2012) MicroRNAs in pathogenesis, diagnosis, and treatment of gastroesophageal cancers. Gastroenterology 143: 35-47.
- Deng H, Guo Y, Song H, Xiao B, Sun W, et al., (2013) MicroRNA-195 and microRNA-378 mediate tumor growth suppression by epigenetical regulation in gastric cancer. Gene 518: 351-359.
- Bin Z, Dedong H, Xiangjie F, Hongwei X, Qinghui Y (2015) The microRNA-367 inhibits the invasion and metastasis of gastric cancer by directly repressing Rab23. Genet Test Mol Biomarkers 19: 69-74.
- Lujambio A, Lowe SW (2012) The microcosmos of cancer. Nature 482: 347-355.
- Im HI, Kenny PJ (2012) MicroRNAs in neuronal function and dysfunction.Trends Neurosci 35: 325-334.
- Li Z, Yu X, Shen J, Law PT, Chan MT, et al. (2015) MicroRNA expression and its implications for diagnosis and therapy of gallbladder cancer.Oncotarget 6: 13914-13921.
- Yu X, Li Z (2015) The role of microRNAs expression in laryngeal cancer. Oncotarget 6: 232297-232305.
- Li Z, Yu X, Shen J, Liu Y, Chan MT, et al. (2015) MicroRNA dysregulation in rhabdomyosarcoma: a new player enters the game.Cell Prolif 48: 511-516.
- Itesako T, Seki N, Yoshino H, Chiyomaru T, Yamasaki T, et al. (2014) The microRNA expression signature of bladder cancer by deep sequencing: the functional significance of the miR-195/497 cluster. PloS One 9: 84311.
- Vrba L, Munoz-Rodriguez JL, Stampfer MR, Futscher BW (2013) miRNA gene promoters are frequent targets of aberrant DNA methylation in human breast cancer. PloS One 8: 54398.
- Xu X, Wang W, Su N, Zhu X, Yao J, et al. (2015) miR-374a promotes cell proliferation, migration and invasion by targeting SRCIN1 in gastric cancer. FEBS Lett 589: 407-413.
- Kong WQ, Bai R, Liu T, Cai CL, Liu M, et al. (2012) MicroRNA-182 targets camp-responsive element-binding protein 1 and suppresses cell growth in human gastric adenocarcinoma. FEBS J 279: 1252-1260.
- Han TS, Hur K, Xu G, Choi B, Okugawa Y, et al. (2015) MicroRNA-29c mediates initiation of gastric carcinogenesis by directly targeting ITGB1. Gut64: 203-214.
- Huang J, Wang Y, Guo Y, Sun S (2010) Down-regulated microRNA-152 induces aberrant DNA methylation in hepatitis B virus-related hepatocellular carcinoma by targeting DNA methyltransferase 1. Hepatology 52: 60-70.
- Zhou X, Zhao F, Wang ZN, Song YX, Chang H, et al. (2012) Altered expression of miR-152 and miR-148a in ovarian cancer is related to cell proliferation. Oncol Rep 27: 447-454.
- Tsuruta T, Kozaki K, Uesugi A, Furuta M, Hirasawa A, et al. (2011) miR-152 is a tumor suppressor microRNA that is silenced by DNA hypermethylation in endometrial cancer. Cancer Res 71: 6450-6462.
- Li B, Xie Z, Li B (2016) miR-152 functions as a tumor suppressor in colorectal cancer by targeting PIK3R3. Tumour Biol 37: 10075-10084.
- Zhang YJ, Liu XC, Du J, Zhang YJ (2015) MiR-152 regulates metastases of non-small cell lung cancer cells by targeting neuropilin-1. Int J Clin Exp Pathol 8: 14235-14240.
- Dang YW, Zeng J, He RQ, Rong MH, Luo DZ, et al. (2014) Effects of miR-152 on cell growth inhibition, motility suppression and apoptosis induction in hepatocellular carcinoma cells. Asian Pac J Cancer Prev 15: 4969-4976.
- Su Y, Wang Y, Zhou H, Lei L, Xu L (2014) MicroRNA-152 targets ADAM17 to suppress NSCLC progression. FEBS Lett 588: 1983-1988.
- Zheng X, Chopp M, Lu Y, Buller B, Jiang F (2010) miR-15b and miR-152 reduce glioma cell invasion and angiogenesis via NRP-2 and MMP- Cancer Lett 329: 146-154.
- Lujambio A, Esteller M (2007) CpG island hypermethylation of tumor suppressor microRNAs in human cancer. Cell Cycle6: 1455-1459.
- Plass C (2002) Cancer epigenomics. Hum Mol Genet 11: 2479-2488.
- Nakajima T, Maekita T, Oda I, Gotoda T, Yamamoto S, et al. (2006) Higher Methylation Levels in Gastric Mucosae Significantly Correlate with Higher Risk of Gastric Cancers. Cancer Epidemiol Biomarkers Prev15: 2317-2321.
- Ren J, Singh BN, Huang Q, Li Z, Gao Y, et al. (2011) DNA hypermethylation as a chemotherapy target. Cell Signal 23: 1082-1093.
- Jin B, Li Y, Robertson KD (2011) DNA methylation: superior or subordinate in the epigenetic hierarchy? Genes Cancer 2: 607-617.
- Robertson KD, Uzvolgyi E, Liang G, Talmadge C, Sumegi J, et al. (1999) The human DNA methyltransferases (DNMTs) 1, 3a and 3b: coordinate mRNA expression in normal tissues and over expression in tumors. Nucleic Acids Res 27: 2291-2298.
- el-Deiry WS, Nelkin BD, Celano P, Yen RW, Falco JP, et al. (1991) High expression of the DNA methyltransferase gene characterizes human neoplastic cells and progression stages of colon cancer. Proc Natl Acad Sci USA 88: 3470-3474.
- Patra SK, Patra A, Zhao H, Dahiya R (2002) DNA methyltransferase and demethylase in human prostate cancer. Mol Carcinog 33: 163-171.
- Belinsky SA, Nikula KJ, Baylin SB, Issa JP (1996) Increased cytosine DNA- methyltransferase activity is target-cell-specific and an early event in lung cancer. Proc Natl Acad Sci USA 93: 4045-4050.
- Baylin SB, Herman JG, Graff JR, Vertino PM, Issa JP (1998) Alterations in DNA methylation: a fundamental aspect of neoplasia. Adv Cancer Res 72: 141-196.
- He M , Fan J, Jiang R, Tang WX, Wang ZW (2013) Expression of DNMTs and genomic DNA methylation in gastric signet ring cell carcinoma. Mol Med Rep 8: 942-948.
- Ding WJ, Fang JY, Chen XY, Peng YS (2008) The expression and clinical significance of DNA methyltransferase proteins in human gastric cancer. Dig Dis Sci 53: 2083-2089.
- Mutze K, Langer R, Schumacher F, Becker K, Ott K et al. (2011) DNA methyltransferase 1 as a predictive biomarker and potential therapeutic target for chemotherapy in gastric cancer. Eur J Cancer47: 1817-1825.
- Jaenisch R, Bird A (2003) Epigenetic regulation of gene expression: how the genome integrates intrinsic and environmental signals. Nat Genet 33: 245-254.
- Ji W, Yang L, Yuan J, Yang L, Zhang M, et al. (2013) MicroRNA-152 targets DNA methyltransferase 1 in NiS-transformed cells via a feedback mechanism. Carcinogenesis 34: 446-453.
- Chen Y, Song Y, Wang Z, Yue Z, Xu H, et al. (2010) Altered expression of MiR-148a and MiR-152 in gastrointestinal cancers and its clinical significance. J Gastrointest Surg 14: 1170-1179.
- Braconi C, Huang N, Patel T (2010) MicroRNA-dependent regulation of DNA methyltransferase-1 and tumor suppressor gene expression by interleukin-6 in human malignant cholangiocytes. Hepatology 51: 881-890.
- Stumpel DJ, Schotte D, Lange-Turenhout EA, Schneider P, Seslija L, et al. (2011) Hypermethylation of specific microRNA genes in MLL-rearranged infant acute lymphoblastic leukemia: major matters at a micro scale. Leukemia 25: 429-439.
Citation: Wang Z, Ye Y, Wang S, Shi H, Yuan B, et al. (2018) The Role of mir-152 and DNMT1 in Gastric Cancer Cell Proliferation and Invasion. J Gastroenterol Hepatology Res 3: 011.
Copyright: © 2018 Zhenkai Wang, et al. This is an open-access article distributed under the terms of the Creative Commons Attribution License, which permits unrestricted use, distribution, and reproduction in any medium, provided the original author and source are credited.