The Testing of An Instrumented Wheelchair Propulsion Testing and Training Device
*Corresponding Author(s):
Kerri A MorganProgram In Occupational Therapy, Washington University School Of Medicine, Campus Box 8505, 4444 Forest Park Blvd, St. Louis, MO 63108, United States
Tel:+1 3142861659,
Email:morgank@wusm.wustl.edu
Abstract
Researchers and clinicians oFten look for devices that can be used to simulate wheelchair propulsion in different environments for implementing interventions and conducting assessments. Common devices used are belted treadmills, dynamometers (roller systems), and wheelchair ergometers. The Wheelmill System (WMS), a motor-driven roller system, has been developed to match the experience of rolling overground and pushing up and down graded slopes. The purpose of this research was to determine the accuracy of the WMS to simulate surfaces in the environment and to assess propulsion variables. SmartWheel and WMS data were collected with 13 manual wheelchair users pushing their wheelchairs over ground and up two different sloped ramps. The participants then pushed their wheelchairs on the WMS at different resistive settings. Participants pushed at a faster cadence and with more force when pushing overground and on the ramps than on the WMS. The force profiles of the participants were closer on the overground surface compared to the WMS than on the ramps compared to the WMS. During the push phase, the WMS assessed forces similar to those collected with the SmartWheel. These results will assist in enhancing the WMS software models for simulating the resistance of common surfaces encountered by manual wheelchair users.
Keywords
INTRODUCTION
Persons who use manual wheelchairs encounter different surfaces as they move through the environment daily, including smooth, flat surfaces, resistive surfaces (eg: carpet), and graded slopes [1,2]. Propulsion on different surfaces may impact upper extremity injury and participation in life activities [3]. Investigating manual wheelchair propulsion techniques over these surfaces in the natural environment would be ideal; however, the natural environment provides challenges for collecting data and implementing interventions. For example, using accurate data collection procedures (such as video motion capture) can be difficult outside of a laboratory [4]. Therefore, devices are commonly used for manual wheelchair propulsion assessment and training purposes in both research and clinical settings. Fully simulating the many obstacles and terrains manual wheelchair users encounter on a daily basis with a device would be difficult. However, using devices to model common environment conditions such as changes in surface resistance and changes in slope eliminates the problem of limited lab or clinic space, simplifies data collection, and provides a safe and efficient opportunity for wheelchair training.
Many devices have been used and tested by researchers, but it is still unclear which offers the most realistic simulation of propulsion in the environment [5,6]. Each type of system has its strengths and weaknesses (cost, space and adjustability), and the use of different systems makes it difficult to compare data from study to study [7]. However, having different device options allows clinicians and researchers to select the most appropriate device(s) for specific studies or interventions. Common equipment used in manual wheelchair research and clinical interventions includes belted treadmills, rollers, and ergometers. Belted treadmills provide movement variability and require the user to engage in aspects of steering and propulsion at the same time [8]. In addition, changing the angle of the belted surface can allow for the simulation of different ramps. A belted treadmill is, however, difficult to use for the study of rolling resistance on different surface materials [9]. Roller systems, sometimes referred to as dynamometers, are simple to use but have been found to not emulate overground propulsion [6,10]. The ergometer system typically uses a standard laboratory wheelchair but has instrumentation to collect propulsion variables [11,12]. The selection of a device is related to the availability of resources and the specific purpose of the study or clinical intervention.
Belted treadmills, rollers, and ergometers that are commonly used vary in the propulsion experiences for the wheelchair user. Some devices offer a comparable experience to an individual’s actual propulsion pattern in the environment, and some may not [5,6,10,13]. However, few of these devices simulate real-life conditions (eg: changes in surface and speed) encountered by manual wheelchair users during their participation in everyday life activities [5,13]. In addition, it is oFten not possible to assess variables related to manual wheelchair propulsion, such as force, with some of these devices. OFten, additional instruments such as force-sensing wheels are needed [14,15]. The Wheelmill System (WMS) is a motor-driven, computer-controlled roller system that was developed to simulate environmental situations (eg: overground and ramps) and to quantify propulsion variables (eg: cadence, peak force, and average forces) [16]. The purpose of this research was to: (1) evaluate the accuracy of the WMS for simulating propulsion over actual surfaces (smooth, flat, overground surfaces and graded slopes such as ramps) and (2) assess the accuracy of the quantification of propulsion variables. We hypothesized that the WMS propulsion variables would be comparable to those experienced on overground surfaces and up graded slopes. In addition, we hypothesized that the WMS would accurately measure propulsion forces.
METHODS
Participants
| n | % | |
| Gender | ||
| Female | 10 | 76.9 |
| Male | 3 | 23.1 |
| Race | ||
| White | 10 | 76.9 |
| African American | 2 | 15.4 |
| Other | 1 | 7.7 |
| Diagnosis | ||
| SCI | 12 | 92.3 |
| Other | 1 | 7.7 |
| Level of Injury | ||
| Paraplegic | 5 | 38.5 |
| Quadriplegic | 8 | 61.5 |
| Complete vs Incomplete | ||
| Complete | 7 | 53.8 |
| Incomplete | 5 | 38.5 |
| N/A | 1 | 7.7 |
| Side Dominance | ||
| Right | 11 | 84.6 |
| LeFt | 2 | 15.4 |
Equipment
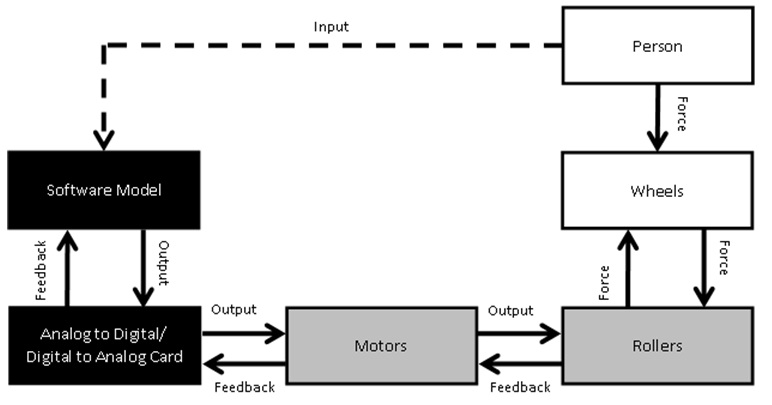
Wheelmill System (WMS): The WMS is a computer-controlled roller dynamometer that has the potential to simulate different environmental conditions through the adjustment of the platform to place the wheelchair in different positions and to provide realistic resistance on the rollers [16]. The system consists of four motor-driven aluminum rollers, a front pan that holds the casters, and two independent motors (Kollmorgen AKM 41 servo motor and S200 servo drive) that are used to control the rollers. The WMS is controlled by soFtware written in MicrosoFt Visual C [19]. The soFtware uses an analog-to-digital/digital-to-analog system (NI USB-6229) to collect data from the motors and to change the roller torque applied by the motors, which changes the resistance and speed of the rollers. The analog-to-digital/digital-to-analog system measures speed with an optical device, measures camber and cross slope angles with goniometers, and controls the motors to change the slope. The soFtware interface displays information such as speed, slope, and distance the person has pushed. The interface also allows the user to change the degree of the slope and cross slope; change the parameters controlling the motors (described below) for the leFt and right rollers changing resistances; and save this information to a data file.
The speed at which the wheels roll is dependent upon the force applied on the pushrims of the wheels by the person using the WMS (Figure 1). To move the rollers, the force the person creates has to be greater than the resistive force of the rollers on the wheels. The motors sense torque placed upon the rollers, and this information is used to control the speed of the rollers. The WMS soFtware model may be dependent upon the characteristics of the person (eg: gender, injury level, and weight), his or her wheelchair setup, and the appropriate surface simulations required for the person’s goals.
| Variable | Definition |
| Motor Control Signal (MCS) | The voltage output by the Digital-to-Analog Converter (DAC) to the motor, which controls the speed of the rollers |
| Previous Signal (PS) | The previous voltage output sent to the motor by the DAC |
| Push Coefficient (PC) | Coefficient that controls the efficiency of the “push” to change the speed of the rollers; it may be related to the weight on the rollers and wheelchair configuration |
| Motor Feedback Signal (MFS) | A signal from the motor to the analog-to-digital converter (ADC) that indicates how much torque is resisting or assisting the current movement of the rollers |
| Decay Coefficient (DC) | Coefficient that controls the decrease in speed of the rollers due to the effects of friction (or other forces resisting the movement, such as gravity, an upslope, or air resistance) |
MCS= {PS +PC[Δ (MFS)]}*DC (1)
Setting
Data collection
Actual surface: Overground and ramps: The SmartWheel was placed on the participant’s dominant side to measure the force occurring during propulsion on an overground surface and on the upgraded slopes. Participants were asked to roll across a smooth, flat, overground surface for 40 meters and up slopes of a low grade (1:20, or about 2.9°) ramp and a high grade (1:12, or about 4.8°) ramp at a self-selected comfortable pace. The slopes of 2.9° and 4.8° were selected because these are the specifications of slopes recommended for ramps in public spaces [24]. Three trials were completed on each surface. A laptop computer with SmartWheel soFtware was used to capture the data for each trial. Data collection of cadence, speed, peak force, average force, and push angle was initiated as the participant began the propulsion motion, prior to the first propulsion stroke. Participants began from a stationary position and accelerated to a self-selected comfortable speed. Data collection was stopped when the participant reached the end of the surface (eg: for the ramp, until the participant reached the platform).
| WMS Setting | Decay Coefficient | Push Coefficient | Level of Resistance | Tile Best Match | Low Ramp Best Match | High Ramp Best match |
| 1 | .6 | 15 | Hardest | 0 | 10 | 12 |
| 2 | .6 | 25 | 0 | 2 | 1 | |
| 3 | .7 | 15 | 0 | 1 | 0 | |
| 4 | .7 | 25 | 0 | 0 | 0 | |
| 5 | .8 | 15 | 0 | 0 | 0 | |
| 6 | .8 | 25 | 0 | 0 | 0 | |
| 7 | .9 | 15 | 0 | 0 | 0 | |
| 8 | .9 | 25 | 4 | 0 | 0 | |
| 9 | 1.0 | 15 | 4 | 0 | 0 | |
| 10 | 1.0 | 25 | 2 | 0 | 0 | |
| 11 | 1.1 | 15 | 1 | 0 | 0 | |
| 12 | 1.1 | 25 | Easiest | 1 | 0 | 0 |
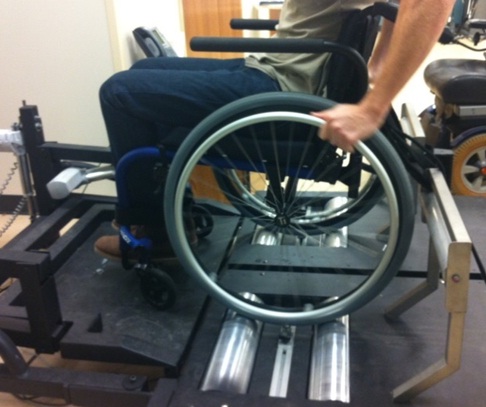
Figure 2: Participant on the WMS.
Data processing
Actual surface comparisons to the WMS settings: To identify best fits of the WMS settings for each of the three surfaces (overground, low-grade, and high-grade ramps), three to five pushes were overlaid using the peak forces as the guide. The force profile for each of the five pushes was averaged to produce one representative push for each WMS setting and for each trial overground and on the ramps. Data on force for the overground and ramp trials were compared to data for each of the WMS settings. Through this process, the values that produced the output closest to the actual surface were identified for each person for flat surfaces and ramps. The WMS setting with the smallest force difference compared to the overground surface and ramps was selected as the best fit. These coefficients were used for comparisons of all five propulsion variables collected by the SmartWheel on the actual surface and on the WMS.
Assessing wheelchair propulsion variables: WMS compared to SmartWheel: To examine the accuracy of the WMS to assess propulsion variables (cadence, peak force, and average force), the data collected from the SmartWheel and the WMS were processed and compared. The WMS does not measure the force applied to the pushrim as the SmartWheel does. The WMS measures the forces at the wheel-ground interface. The tangential Force (Ft) from the WMS was calculated from the motor control signal controlling the torque of the rollers [16]. The torque applied to the rollers by the wheels is sensed by the motor, and a control signal is calculated that controls the torque on the rollers allowing them to turn at the appropriate speed. The Ft was calculated by subtracting a speed-dependent voltage offset from this control signal and multiplying by a conversion coefficient. The motor control signal of the WMS was converted to Ft through custom MicrosoFt Excel spreadsheets.
Actual surface comparisons to the WMS settings: Propulsion variables (cadence, average speed, peak force, average force, and push angle) measured by the SmartWheel were compared from the three different testing conditions (overground, low-grade ramp, and high-grade ramp) to the WMS. A paired-samples t-test was conducted to determine whether there was a significant difference between propulsion variables of pushing overground on a smooth, flat surface compared to propulsion variables when pushing on the WMS setting that was identified as most representative of pushing overground, the null hypothesis being that there is no difference between propulsion overground and on the WMS. A Pearson’s product-moment correlation coefficient was run to assess the relationship between propulsion variables collected overground compared to those collected on the WMS. A Shapiro-Wilk test was used to assess normality of the variables. Scatter plots of each variable were created to evaluate the similarity of variables. We fitted multiple regression models for the five propulsion variables separately as the dependent variable to examine the relationship of each variable to other factors (independent variables). Our independent variables were the settings on the WMS (push and decay coefficients), person factors (gender, injury, and weight), and chair factors (wheelbase length and axle position). Individual participant force profiles were compared between overground and the WMS, and effect sizes were calculated to examine variability within and between participants. This process was repeated for both the low-grade ramp and the high-grade ramp variables.
Assessing accuracy of quantification of wheelchair propulsion variables: WMS compared to SmartWheel: The WMS has the ability to measure variables such as cadence, average peak torque, and average force. These variables were compared to similar data collected from the SmartWheel. Paired t-tests were used to analyze the differences between SmartWheel and WMS data. Pearson’s product-moment correlation coefficients were used to assess the relationship of the variables assessed by the WMS as compared to those of the SmartWheel. Scatter plots of each variable were created to evaluate the similarity of variables.
RESULTS
Actual surface comparisons to the WMS settings: Overground (group comparison)
| Variable | Overground vs. WMS | Low Ramp vs. WMS | High Ramp vs. WMS | |||
| Surface | WMS | Surface | WMS | Surface | WMS | |
| Cadence | 1.04 (.12)* | .95 (.14)* | 1.11 (.22)* | 0.86 (.11)* | 1.08 (.27)* | 0.87 (.12)* |
| Speed | 1.56 (.26)* | 1.16 (.34)* | 0.99 (.21)* | 0.64 (.12)* | 0.895 (.299)* | 0.64 (.14)* |
| Peak force | 46.04 (13.77)* | 34.49 (8.58)* | 95.897 (22.49)* | 68.19 (14.13)* | 101.58 (23.60)* | 70.03 (11.91)* |
| Average force | 25.71 (7.90)* | 19.66 (4.52)* | 60.27 (14.65)* | 42.51 (2.57)* | 67.54 (17.74)* | 43.94 (8.38)* |
| Push angle | 82.45 (14.07) | 78.95 (18.96) | 84.69 (18.21) | 89.01 (15.47) | 84.39 (18.55) | 87.99 (15.96) |
The propulsion variables were used as the dependent variables (cadence, peak force, average force, and push angle). Gender, injury level, and wheelchair dimensions were not significant for any of the variables and, therefore, were excluded from the model. The assumptions of linearity, independence of errors, homoscedasticity, unusual points, and normality of residuals were met. Push, decay, and weight variables significantly (p<.0005) predicted speed (adj. R2=0.797), peak force (adj. R2=0.506), and average force (adj. R2=0.520; table 5). No significant findings were found for cadence or push angle.
| Speed | b | SE | B | 95% CI for b |
| Push (glide)* | 3.663 | 0.648 | 0.78 | 2.198, 5.128 |
| Decay (resistance) | 0.008 | 0.1 | 0.119 | -.014, .030 |
| Weight* | -0.005 | 0.001 | -0.685 | -.007, -.002 |
| Peak Force | ||||
| Push (glide) | -35.864 | 25.444 | -0.303 | -93.423, 21.696 |
| Decay (resistance)* | 1.21 | 0.382 | 0.731 | .345, 2.074 |
| Weight* | 0.086 | 0.038 | 0.515 | .000, .171 |
| Average Force | ||||
| Push (glide)* | -35.533 | 13.186 | -0.571 | -65.363, -5.703 |
| Decay (resistance) | 0.402 | 0.198 | 0.461 | -.046, .850 |
| Weight* | 0.049 | 0.02 | 0.566 | .005, .094 |
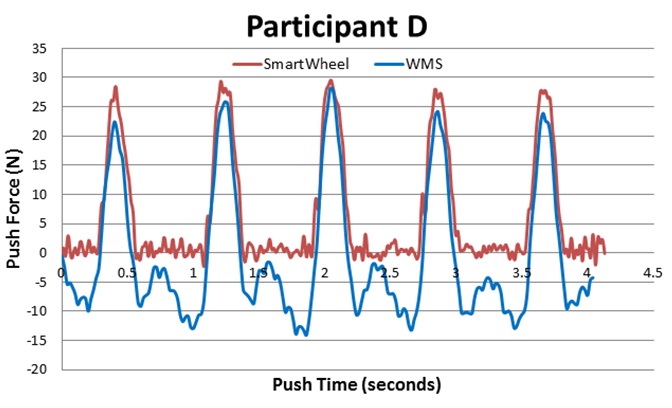
Actual surface comparisons to the WMS settings: Overground (individual examples)
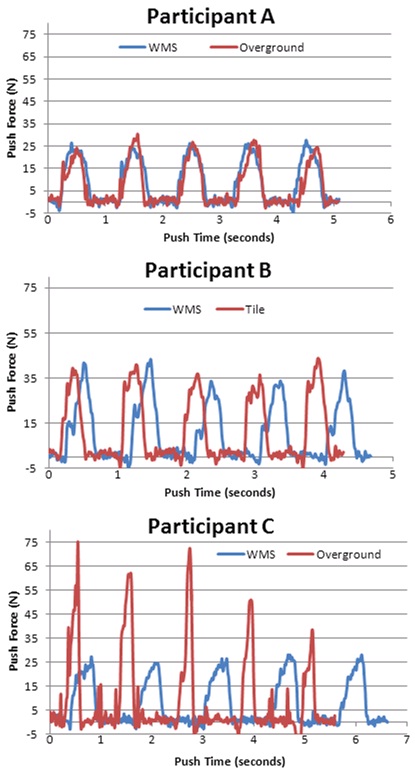
Figure 3: Individual Force Profile Comparisons: Overground and WMS.
Actual surface comparisons to the WMS settings: Ramps (group comparison)
Actual surface comparisons to the WMS settings: Ramps (individual examples)
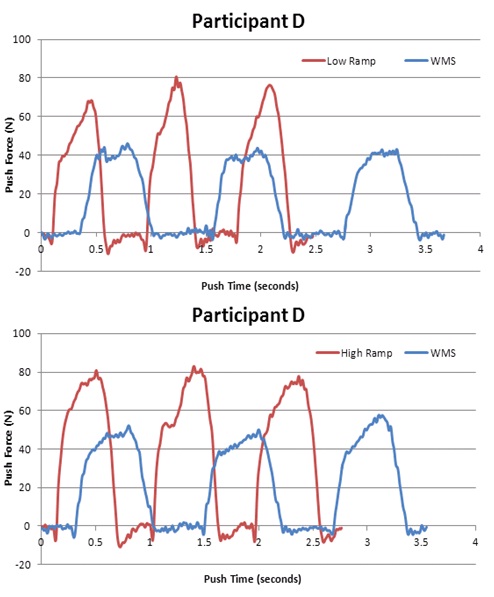
Figure 4: Individual Force Profile: Low Ramp and High Ramp.
Assessing wheelchair propulsion variables: WMS compared to SmartWheel
| Propulsion Variable | SmartWheel Mean (SD) | WMS Mean (SD) |
| Cadence | 0.96 (.138) | 0.97 (.137) |
| Peak force | 38.92(9.49) | 37.99 (8.48) |
| Average force | 22.36 (5.47)* | 18.9356 (3.95)* |
| Recovery force | 0.167 (.584) | ?6.8148 (3.97)* |
Table 6: Comparison of propulsion variables: SmartWheel vs. WMS.
DISCUSSION
Actual surface comparisons to the WMS setting: Overground and ramp
Much of the research studying ramps used actual ramps in the community or ramps built out of plywood in lab settings [28,29]. However, kinematic and kinetic comparisons between actual ramps and simulation on devices are limited. In this study, users had a higher cadence, faster speed, and much higher force on the ramp as compared to the WMS. The soFtware model on the WMS could be adjusted to require higher forces, but there are no consequences on the WMS as there are on an actual ramp. If a person does not have a rapid cadence with enough force on an actual ramp, he or she will roll backward down the ramp. On the WMS, participants are not forced to push harder at a quicker pace to keep from rolling backward, so it is difficult to get a best match for all variables from one WMS setting. Additional soFtware modeling that would include backward rolling of wheels may assist the WMS with matching push variables with variables measured on ramps. This study tested two different common slopes found in public spaces, however manual wheelchair users encounter steeper slopes in the natural and built environment than what was tested. Future testing may want to address a wider range of slopes to ensure the ability of the device to simulate environments commonly experienced by manual wheelchair users.
The data described in this paper will assist in identifying the appropriate push and decay coefficients, so when a user applies force on the pushrims, the rollers will rotate at an appropriate rate to simulate rolling across a typical surface, slowing down as one would expect due to friction. This data comparison between the actual surface and the WMS provides us with an idea of what each of the coefficients equates to for simulating common resistances experienced by manual wheelchair users in everyday life. The higher decay coefficients were matched more closely with participant’s overground propulsion variables. The lower decay coefficients matched more closely with the ramps (Table 2). Some of the middle WMS settings might be more appropriate for environmental surfaces with different rolling resistances, such as carpet. We could go even lower on the push coefficients (we underestimated) and add into the soFtware interface cueing to keep a faster cadence or the rollers will begin to roll backward. The data collected in this paper will assist in updating the soFtware model so that it will automatically calculate the proper parameters for each person on different surfaces.
Assessing wheelchair propulsion variables
The WMS measures tangential forces during the push phase (while the hand is in contact with the pushrim) similar to those measured by the SmartWheel. However, the WMS measures the forces applied to the motors by the wheels of the wheelchair via the rollers, whereas the SmartWheel measures the forces applied to the pushrims. The benefits of using the WMS to measure forces occurring on the pushrim include the ability to measure the push forces on wheelchairs with any size wheel and regardless of where the wheelchair user applies force to the wheel. The rollers on the WMS use separate motors for the right and leFt wheel; therefore, force can be measured at the same time on both sides without the need for two instrumented wheels. When using the WMS to measure force during propulsion, the participant can use his or her own wheelchair and wheels and does not have to acclimate to pushing on a different wheel or think about only pushing on the pushrim. The WMS does not have the ability to measure the resultant force, whereas an instrumented wheel has the ability to measure different forces acting upon the pushrim [20]. The WMS and the SmartWheel measured tangential force similarly during the push phase. However, during the recovery phase (when the hand is not in contact with the pushrim), the force on the WMS and the SmartWheel differed. As would be expected, the SmartWheel force was around zero during the recovery phase, but this was not the case for the WMS, since the WMS collects the data from the interaction between the wheel and the roller. This force during recovery would include forces between the roller and the wheel and may be related to the participant repositioning or shiFting his or her center of gravity in preparation for the next push. The data may be useful in identifying participants who use their core or trunk during a propulsion cycle.
Clinical and research applications
CONCLUSION
The WMS has the ability to simulate different environments and assess propulsion variables, and it adds to the equipment available to clinicians and researchers. Information to improve the soFtware modeling of the WMS to simulate propulsion on different surfaces was gathered. Pushing on an overground surface moderately correlates with pushing on the WMS. The ramp models need to be modified to allow for higher forces and to implement a cue to increase cadence. The WMS has clinical applications in its ability to simulate different surfaces. The WMS also has research applications in its use for assessing propulsion variables.
ACKNOWLEDGEMENTS:
REFERENCES
- Kasemsuppakorn P, Karimi HA, Ding D, Ojeda MA (2015) Understanding route choices for wheelchair navigation. Disabil Rehabil Assist Technol 10: 198-210.
- Routhier F, Vincent C, Desrosiers J, Nadeau S (2003) Mobility of wheelchair users: a proposed performance assessment framework. Disabil Rehabil 25: 19-34.
- Hurd WJ, Morrow MM, Kaufman KR, An KN (2009) Wheelchair propulsion demands during outdoor community ambulation. J Electromyogr Kinesiol 19: 942-947.
- Hurd WJ, Morrow MM, Kaufman KR, An KN (2008) Influence of varying level terrain on wheelchair propulsion biomechanics. Am J Phys Med Rehabil 87: 984-991.
- Kwarciak AM, Turner JT, Guo L, Richter WM (2011) Comparing handrim biomechanics for treadmill and overground wheelchair propulsion. Spinal Cord 49: 457-462.
- Stephens CL, Engsberg JR (2010) Comparison of overground and treadmill propulsion patterns of manual wheelchair users with tetraplegia. Disabil Rehabil Assist Technol 5: 420-427.
- DiGiovine CP, Cooper RA, Boninger ML (2001) Dynamic calibration of a wheelchair dynamometer. J Rehabil Res Dev 38: 41-55.
- Vegter RJ, Lamoth CJ, de Groot S, Veeger DH, van der Woude LH (2013) Variability in bimanual wheelchair propulsion: consistency of two instrumented wheels during handrim wheelchair propulsion on a motor driven treadmill. J Neuroeng Rehabil 10: 9.
- van der Woude LH, Geurts C, Winkelman H, Veeger HE (2003) Measurement of wheelchair rolling resistance with a handle bar push technique. J Med Eng Technol 27: 249-258.
- Koontz AM, Worobey LA, Rice IM, Collinger JL, Boninger ML (2012) Comparison between overground and dynamometer manual wheelchair propulsion. J Appl Biomech 28: 412-419.
- de Groot S, Veeger HE, Hollander AP, van der Woude LH (2002) Consequence of feedback-based learning of an effective hand rim wheelchair force production on mechanical efficiency. Clin Biomech (Bristol, Avon) 17: 219-226.
- Mercer JL, Boninger M, Koontz A, Ren D, Dyson-Hudson T, et al. (2006) Shoulder joint kinetics and pathology in manual wheelchair users. Clin Biomech (Bristol, Avon) 21: 781-789.
- Mason B, Lenton J, Leicht C, Goosey-Tolfrey V (2014) A physiological and biomechanical comparison of over-ground, treadmill and ergometer wheelchair propulsion. J Sports Sci 32: 78-91.
- Cooper RA (2009) SMARTWheel: From concept to clinical practice. Prosthet Orthot Int 33: 198-209.
- Guo L, Kwarciak AM, Rodriguez R, Sarkar N, Richter WM (2011) Validation of a biofeedback system for wheelchair propulsion training. Rehabil Res Pract 2011: 590780.
- Klaesner J, Morgan KA, Gray DB (2014) The development of an instrumented wheelchair propulsion testing and training device. Assist Technol 26: 24-32.
- Asato KT, Cooper RA, Robertson RN, Ster JF (1993) SMARTWheels: development and testing of a system for measuring manual wheelchair propulsion dynamics. IEEE Trans Biomed Eng 40: 1320-1324.
- DiGiovine CP, Koontz AM, Boninger ML (2006) Advances in manual wheelchair technology. TopSpinal Cord Inj Rehabil 11: 1-14.
- MicrosoFt Visual Studios (2005) MicrosoFt Visual C++ [computer soFtware]. MicrosoFt, Redmond, Washington, USA.
- Boninger ML, Souza AL, Cooper RA, Fitzgerald SG, Koontz AM, et al. (2002) Propulsion patterns and pushrim biomechanics in manual wheelchair propulsion. Arch Phys Med Rehabil 83: 718-723.
- Cowan RE, Boninger ML, Sawatzky BJ, Mazoyer BD, Cooper RA (2008) Preliminary outcomes of the SmartWheel Users’ Group database: a proposed framework for clinicians to objectively evaluate manual wheelchair propulsion. Arch Phys Med Rehabil 89: 260-268.
- Niesing R, Eijskoot F, Kranse R, den Ouden AH, Storm J, et al. (1990) Computer-controlled wheelchair ergometer. Med Biol Eng Comput 28: 329-338.
- Cowan RE, Nash MS, Collinger JL, Koontz AM, Boninger ML (2009) Impact of surface type, wheelchair weight, and axle position on wheelchair propulsion by novice older adults. Arch Phys Med Rehabil 90: 1076-1083.
- Department of Justice (2010) 2010 ADA Standards for Accessible Design. USA department of justice civil rights division, ADA government, USA
- MATLAB Central (2010) MATLAB xUnit: new version available. MATLAB version 7.10.0, The MathWorks Inc., Natick, Massachusetts, USA.
- MicrosoFt (2011) MicrosoFt Excel [computer soFtware]. MicrosoFt, Redmond, Washington, USA.
- IBM (2012) SPSS Statistics Version 21. SPSS Inc., IBM, Chicago, IL, USA.
- Koontz AM, Cooper RA, Boninger ML, Yang Y, Impink BG, et al. (2005) A kinetic analysis of manual wheelchair propulsion during start-up on select indoor and outdoor surfaces. J Rehabil Res Dev 42: 447-458.
- Sabick MB, Kotajarvi BR, An KN (2004) A new method to quantify demand on the upper extremity during manual wheelchair propulsion. Arch Phys Med Rehabil 85: 1151-1159.
- Boninger ML, Cooper RA, Robertson RN, Shimada SD (1997) Three-dimensional pushrim forces during two speeds of wheelchair propulsion. Am J Phys Med Rehabil 76: 420-426.
- Kotajarvi BR, Basford JR, An KN, Morrow DA, Kaufman KR (2006) The effect of visual biofeedback on the propulsion effectiveness of experienced wheelchair users. Arch Phys Med Rehabil 87: 510-515.
Citation: Morgan KA, Engsberg JR, Klaesner J (2015) The Testing of An Instrumented Wheelchair Propulsion Testing and Training Device. J Phys Med Rehabil Disabil
Copyright: © 2015 Jack R Engsberg, et al. This is an open-access article distributed under the terms of the Creative Commons Attribution License, which permits unrestricted use, distribution, and reproduction in any medium, provided the original author and source are credited.