Understanding Hardness Distribution on Biological Surfaces in Manipulative Therapy
*Corresponding Author(s):
Yoshitaka ArimaDepartment Of Acupuncture And Moxibustion Therapy, Faculty Of Health Promotional Sciences, Tokoha University, 1230 Miyakoda-cho Kita-ku Hamamatsu-shi Shizuoka 432-2102, Japan
Tel:+81 0534281225,
Email:arima@hm.tokoha-u.ac.jp, yoshitaka.arima@nifty.com
Abstract
The use of palpation for measuring the hardness of soft biological tissues is essential for the diagnosis of pathological conditions and for determining the therapeutic effects of manipulative therapy. However, the clinical assessment of hardness distribution is subjective and based on a therapist’s experience and intuition. Thus, it would be useful to further develop these assessments to be both objective and quantifiable. To understand hardness distribution on the surface of biological bodies, we studied the characteristics of two types of commercially available pressure-type hardness measurement devices that do not require an external analysis system and one type soft rubber hardness measurement device, based on model measurement data. For measuring hardness, three devices were used: NEUTONE TDM-NA1, PEK-1 and ASKER Durometer Type F. A digital cooking scale KD-320 was used to measure load. For the hardness model, three layered sheets of six types of gel sheets of Type V acupuncture practice pads and the in duration-embedded model were used. Measurements the hardness of each gel was measured 10 times each at stand angles of 0º, 12º, 23º, 35º, 45º and 60º. Load during measurements at 0° was determined. Furthermore, the in duration model was measured at multiple points and compared the contour map. PEK-1 allows the measurement of a range of objects from soft to hard at low pressure loads. It is well suited for multiple point measurements. TDM-D1 characteristics were able to be clarified, which were ideal for measuring objects that were relatively hard and that could be stably pressurized. With these points in mind, it was determined that the PEK-1 was ideal for determining the hardness distribution of biological surfaces.
Keywords
Biological body surface; Hardness; Hardness distribution; Hardness meter
INTRODUCTION
The use of palpation for measuring the hardness of soft biological tissues is essential to make a diagnosis of pathologic conditions and to determine the therapeutic effects of manipulative therapy. This is particularly true in acupuncture or massages trigger point therapy, in which parts that are harder or softer than surrounding tissues are called acupoints or trigger points and are targeted in therapy. However, the clinical assessment of the distribution of hardness is subjective and based on a therapist’s experience and intuition. Thus, it would be useful to make these assessments objective and quantifiable.
Hardness is a relative and comparative notion exemplified by various physical traits such as being prone or not prone to stretching, injuries, deformation, abrasion, or fatigue. Hardness measurement was developed to make indirect assessments primarily through finding the strength, endurance, or safety according to the mechanical characteristics of materials. Measurement and assessment methods are selected according to the purpose of measurement. For the measurement or assessment of soft biological tissues, methods such as static pressure or response to displacement, response to a dynamic load or displacement, response to shock, and response to different frequencies are used [1-14]. The main differences between static and dynamic measurements are as follows: 1) the former defines the elasticity of the object as hardness, whereas the latter defines not only elasticity but also the dynamic characteristics of viscoelasticity including viscosity as hardness; 2) in comparison to static measurements, which can be done on single bodies and in a short time period, dynamic measurements require a time period equal to that of the external system and 3) for static measurements, instantaneous pressure/displacement at a constant contact pressure/displacement are used as indicators [2-4,6]. Devices that measure the hardness of biological body surfaces and that are commercially sold in Japan include the muscle hardness meter NEUTONE TDM series and the biological tissue hardness PEK meter series; they operate with a different measurement method [6,15].
The purpose of the present study was to understand hardness distribution on the surface of biological bodies. To do this, we studied the characteristics of two types of commercially available pressure-type hardness measurement devices that do not require an external analysis system and one type soft rubber hardness measurement device, based on model measurement data.
METHODS
Assessment of measurement device characteristics
For measuring hardness, a muscle hardness tester (NEUTONE Muscle Hardness Tester TDM-N1; TRY-ALL Co., Ltd.; TDM), a muscle hardness meter (Muscle Hardness Meter PEK-1; IMOTO MACHINERY Co., Ltd.; PEK), and an Asker hardness meter (ASKER Durometer Type F; KOBUNSHI KEIKI Co., Ltd.; A–F) were used (Figure 1) [6,15].
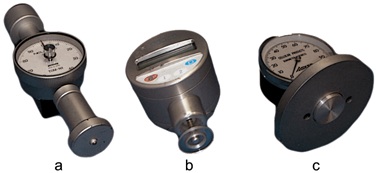 Figure 1: Hardness meter. A: TDM-N1, B: PEK-1, C: ASKER Durometer Type F.
The TDM is composed of a hardness meter adapted from the PEACOCK durometer (OZAKI MFG. CO. LTD.), and its tip portion is composed of a 30-mm diameter step bottom portion, and a rotatable ball-sharp bottom portion(approximately 4.5 mm diameter) measuring piece corresponding to the indenter point which protrudes 2.54 mm from the base surface. The force exerted to the ball-sharp bottom portion by the object pressing at a certain force is considered as the hardness index, and it shows relative hardness values from the measurement device between 0 and100. One hundred indicates that the measurement device tip is on the same side as the object and is hard. The PEK tip is composed of the main axis and auxiliary cylinder with different spring strengths. A hardness index of 0?100indicates that a relative comparative value of 10× is the shift distance of the main axis (mm) when the auxiliary cylinder is shifted by 10mm. The main axis corners are rounded so that the measured object is not damaged when measured at a 7-mm diameter. It is shaped like the brim of a hat with an external diameter of 25 mm and internal diameter of 14 mm to increase the stability of the contact and pressing force for support. When measuring hard objects, the main axis and auxiliary cylinder shift in a uniform manner. As their shift distance is large, the measured value will also be large. For measuring soft objects, as the shift distance of the main axis is smaller than that of the auxiliary cylinder, the measured value will be small. A–F is composed of an 80 mm in diameter pressurized foot that comes into stable contact with the object to obtain an appropriate reference point for measuring materials, particularly those that are soft, and a 25.2-mm cylindrical indenter point that protrudes 2.54 mm from the base side. The reaction force exerted on the indenter point from the object when the A-F is placed onto the object of measurement (there is no need press the A-F into the object) is indicated by 0 to 100. It is also suitable for measuring materials where stress mitigation occurs.
For the hardness model, three layers of six types of silicone gels of various hardness were used [measuring approximately 90 × 60 × 6mm, in order of soft to hard (SG-a, b,-c, -d, -e, and -f) from layered Unico Type V acupuncture practice pads (NISSIN MEDICAL INDUSTRIES Co., Ltd.]; these are used in acupuncture education in Japan. Measurements were taken on a laptop angle adjustable stand (GORODE21Goro ne de sk, THANKO Co.).
Each gel’s hardness was measured at stand angles of 0º, 12º, 23º, 35º, 45º and 60º to the horizontal. For each angle paired with a gel, measurements were 10 times in each case. For 0º only, a digital cooking scale (KD-320 TANITACo.) was used to concurrently measure load. For the load at the time of measurement, the units were changed from the default grams (g) displayed on the scale tonewtons (N) to find the minimum, maximum, and mean values and standard deviation (SD) and Coefficient of Variation (CV) for each angles (each 60 sets. The mean and Standard Deviation (SD) for each silicone gel was found.
Hardness was indicated in values relative to the numbers in the measurement device between 0 and 100 without units. First, the mean, SD and CV of each silicone gel were found at 0º; the range was found by subtracting the minimum mean from the maximum mean. A multiple comparison test (Tukey’s) of the silicone gel for each measurement device and a correlation analysis (Pearson’s) between the measurement devices were performed. Next, statistical comparisons were performed with a multiple comparison test (Dunnett’s) with 0º as the control to measure the effects of angles. GraphPad Prism 6J for Windows was used, and p ≤ 0.05 was considered to indicate statistical significance.
Expression of hardness distribution
In a 140 × 140 × 40-mm silicone gel block, two hemispherical silicone types of different hardness were embedded(A: mixture of AskerC19 and silicone gel, B: addition of 50% JIS A40 and 50% AskerC19 to A with a 1 maculating) so that the apex of the hemispheres was positioned 5 mm from the surface. This was used as the in duration embedded model (NAKAMURA BRACE Co. Ltd.) (Figure 2). Measurements were taken on 11 × 12 square grids; Microsoft Excel 2010 for Windows was used to create and compare a contour and three-dimensional contour map.
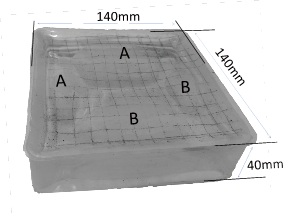 Figure 2: In duration embedded model. A is harder than B.
RESULTS
Measurement device characteristics
The minimum and maximum loads at the time of measurement were 16.9-21.8 N for TDM, 3.3-6.7 N for PEK, and 5. 1-5.1 N (all the same loads) for A-F. The mean ± SD was highest for TDM at 19.2 ± 1.1 N, followed by PEK at 5.2 ± 1.1 N and A-F at 5.1 ± 0.0 N. The CV was smallest for A–F at 0.0%, followed by 5.5% for TDM and 21.0%for PEK. For PEK, the harder the object, the more the load at the time of measurement tended to increase (Table 1).
|
|
TDM |
PEK |
A-F |
|
min. - max. |
16.9 - 21.8 |
3.3 - 6.7 |
5.1 - 5.1 |
|
mean ± S.D. |
19.2 ± 1.1? |
5.2± 1.1 |
5.1 ± 0.0 |
|
C.V. |
5.5 % |
21.0 % |
0.0% |
|
SG-a |
18.3 ± 1.0 |
3.9 ± 0.4 |
5.1 ± 0.0 |
|
SG-b |
19.6 ± 0.7 |
4.0 ± 0.4 |
5.1 ± 0.0 |
|
SG-c |
19.2 ± 0.9 |
5.1 ± 0.4 |
5.1 ± 0.0 |
|
SG-d |
19.8 ± 1.4 |
5.7 ± 0.4 |
5.1 ± 0.0 |
|
SG-e |
19.1 ± 0.7 |
6.1 ± 0.2 |
5.1 ± 0.0 |
|
SG-f |
18.8 ± 0.6 |
6.6 ± 0.1 |
5.1 ± 0.0 |
Table 1: Load at the time of measurement. TDM and A-F are constant; PEK changes according to the hardness of the object.
TDM was treated at 0 as the needle did not move for SG-a, which was the softest. The multiple comparison of values from the six types of silicone gels for each hardness demonstrated a statistically significant difference for all combinations of TDM with the exception of the combination between SG-a and -b. Correlation analysis revealed a strong and significant positive correlation between TDM and PEK (r = 0.095, p < 0.0001), TDM and A–F (r = 0.910,p = 0.0118) and PEK and A–F (r = 0.925, p = 0.0082); however, the order of hardness of the silicone gel was a < b< c < d < e < f for TDM and PEK and a < b < c < e < f < d for A–F. The range was widest in the order of PEK, 55.6> TDM, 35.0 > A–F, 24.5. CV was large when measuring soft objects with TDM (Table 2).
|
mean± S.D. %C.V. |
TDM |
PEK |
A-F |
|
SG-a |
0.0 ± 0.0 0.0 % |
17.2 ± 0.4 2.5 % |
45.2 ± 2.0 4.4 % |
|
SG-b |
1.1 ± 0.7 67.1 % |
24.5 ± 0.5 2.2 % |
47.0 ± 1.7 3.6 % |
|
SG-c |
14.0 ± 1.9 13.5 % |
43.0 ± 0.0 0.0 % |
59.8 ± 1.3 2.2 % |
|
SG-d |
23.0 ± 1.6 7.1 % |
58.0 ± 0.5 0.8 % |
73.7 ± 1.1 1.4 % |
|
SG-e |
26.9 ± 1.3 4.8 % |
63.6 ± 0.7 1.1 % |
64.3 ± 1.1 1.6 % |
|
SG-f |
35.0 ± 0.9 2.7 % |
72.8 ± 0.9 1.3 % |
69.7 ± 1.1 1.5 % |
|
range |
35.0 |
55.6 |
24.5 |
Table 2: Sheet hardness by the machine model. The range was wide for PEK. For TDM, SG-a was 0 and the coefficient of variation of SG-b was large. The order of hardness for A–F was different from those for TDM and PEK.
In measurement with different stand angles, measurements could not be made with A-F for angles of ≥23º. Multiple comparison test results for A-F showed a significant difference in 7 of 12 combinations of measured values at 0º. InPEK, there were no combinations in which significant differences were observed, and in TDM, there was a significant difference observed at 0º and 23º with SG-e (p <0.05) (Figure 3).
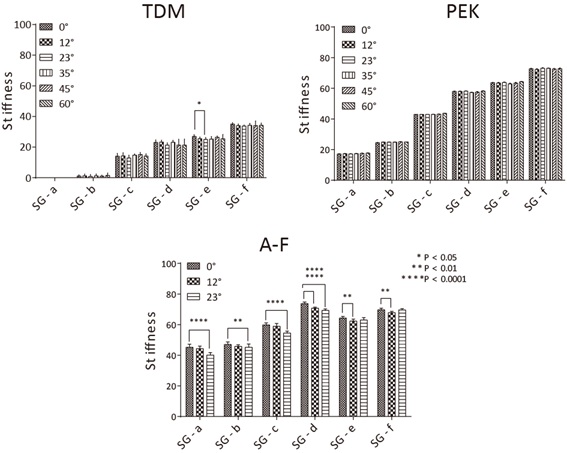 Figure 3: Sheet hardness by each angle by the machine model. TDM: Significant difference at 0º and 23º of SG-e (p < 0.05). A-F: A measurement could not be taken at angles ≥23º; significant difference in 7 groups (P < 0.01).
Expression of hardness distribution
Minimum and maximum TDM and PEK values were 0 and 37 and 24 and 65, respectively. The calibration axes for TDM and PEK were 0-50 and 20-70, respectively and using these axes; a wireframe contour chart was created. Both measurement devices captured the hardness differences between A and B inside the in duration model. Form extraction was more pronounced with PEK than with TDM (Figure 4).
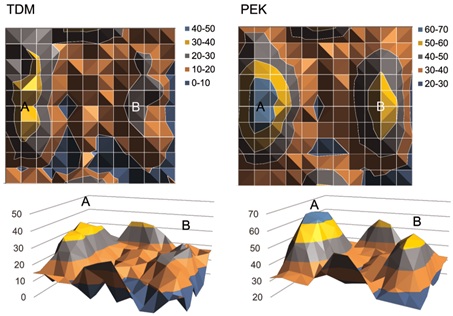 Figure 4: Contour plan of the in duration embedded model. Difference in hardness of A and B detected in both measurement devices. However, the shape was clearer with PEK.
DISCUSSION
The order of hardness of the six types of silicone gel used in the present study matched the order of the TDM and PEK measured values, but it did not match those of A-F. A-F is a hardness measurement device that measures the surface perpendicular to gravity. Therefore, this measurement device is ideal for measuring materials in which stress mitigation occurs. The phenomenon of stress mitigation can be explained by the Maxwell model, which places an elastic spring and a viscous dashpot in series (Figure 5) [16]. Immediately after a certain amount of displacement occurs due to a pressing force, the rapidly reacting spring becomes compressed to generate stress δ0 to compress the spring.
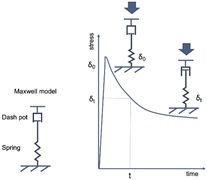
Figure 5: The Maxwell model and stress mitigation. The phenomenon of stress mitigation in which load decreases over time for the same displacement is explained by the dynamic.
After that, the spring compresses the dashpot to gradually shorten it. Although displacement is constant, the distance that the dashpot shortened will be re-extended over time by the spring and the stress δt that compresses it gradually decreases. TDM and PEK assess elasticity immediately after displacement as hardness, whereas A–F assesses hardness, including viscoelastic mechanic behaviors that cause stress mitigation; the difference in the assessed parameter is the primary factor explaining this discrepancy. Although A-F is ideal for assessments, including those of viscoelastic mechanic behaviors, it requires a certain amount of time to make the measurements, and it can be affected by the measurement angle; therefore, it was determined to be unsuitable for capturing the hardness distribution of biological body surfaces.
TDM, which operates on the same durometer measurement mechanism as A-F, was differentiated from A-F by adding sound and light features that notified the researchers about the measurement effects of the surface angle at a constant load. In contrast, PEK uses a relative shift distance of the main axis to the shift distance of the auxiliary cylinder as the indicator of hardness. Therefore, it is not affected by the angle of the measurement surface. In static pressing force hardness measurements, constant contact force, instantaneous pressure during constant distortion, or instantaneous distortion (displacement) was used as an indicator, and many other types are also being developed for research [3,4]. Types that measure and analyze the relationship of load displacement in dynamic viscoelastic measurement are affected by the angle of the measurement surface or pressing degree distance [6,7]. However, static pressing force types are presumed to be less likely affected.
The load at measurement (Table 1) was 19.2 ± 1.1 for TDM, whereas it fluctuates between 3.3 and 6.7 N in PEK depending on the hardness of the measured object (mean = 5.2 N). A strong correlation was observed between the measured values of TDM and PEK; however, in TDM, the hardness value of SG-a was 0. SG-f was 35.0 ± 0.9 N, which was very small compared to 72.8 ± 0.9 N for PEK. The range was narrower for TDM (35.0) compared to PEK (55.6), indicating lower sensitivity. There is the possibility that sensitivity is improved by changing the load at the time of TDM measurement. However, the results of measurement method comparisons by a constant contact depth and contact force in pressing force-type hardness measurements have indicated that a scheme based on constant contact depth was superior in sensitivity [2]. Therefore, it is possible that the measurement mechanism influences sensitivity. The silicone gel that was used as an object for measurements in our study simulated the hardness of biological soft tissues and is used by Japanese acupuncturists to practice acupuncture or palpation. Acupuncturists focus not only on hard areas as reaction points but also on softer areas compared to surrounding tissues in the human body surface local region. Therefore, PEK is superior for making an objective assessment of hardness that is useful in clinical acupuncture practice; whereas TDM can be presumed to be better suited for measuring harder objects than SG-f. It is essential to make a selection adapted to the object as correlation between the measurements of both PEK and TDM and muscle deformation have been reported [17,18].
We were able to confirm using numerical values that the range of hardness for the in duration-embedded model we used was similar to the six types of silicone gel. Given that, we were able to detect differences in hardness of the two types of embedded silicone of different hardness in both TDM and PEK. TDM was believed to be ideal for measuring parts with structures of the same hardness on which a stable load could be applied from the point structure to the stem bottom (30-mm external diameter). The structure of PEK allows measurements to be made even when the main axis and auxiliary cylinder are separated by 7 mm and when the full surface of the auxiliary cylinder is not in contact with the object. Therefore, shape extraction of the hemisphere was superior in PEK.
CONCLUSION
PEK allows the measurement of a range of objects from soft to hard at low pressure loads. It is well suited for multiple point measurements. TDM characteristics were able to be clarified, which were ideal for measuring objects that was relatively hard and that could be stably pressurized. With these points in mind, it was determined that the PEK was ideal for determining the hardness distribution of biological surfaces.
ACKNOWLEDGEMENT
The author thanks Crimson Interactive Pvt. Ltd. (Ulatus) – www.ulatus.jp for their assistance in manuscript translation and editing.
AUTHOR DISCLOSURE STATEMENT
This work was supported by JSPS KAKENHI Grant Number C25460916 and C18K10868.
REFERENCES
- Kothari SF, Kothari M, Zambra RF, Baad-Hansen L, Svensson P (2014) Standardization of muscle palpation- Methodological Considerations. Clin J Pain 30: 174-182.
- Yen P-L (2014) Palpation sensitivity analysis of exploring hard objects under soft tissue. In Advanced Intelligent Mechatronics 2: 1102-1106.
- Arokoski JP, Surakka J, Ojala T, Kolari P, Jurvelin JS (2005) Feasibility of the use of a novel soft tissue stiffness meter. Physiol Meas 26: 215-228.
- Oflaz HA, Baran ON (2014) A new medical device to measure a stiffness of soft materials. Acta BioengBiomech 16: 125-131.
- Burlin TE, Hutton WC, Ranu HS (1977) A method of in vivo measurement of the elastic properties of skin in radiotherapy patients. J Invest Dermatol 69: 321-323.
- Arima Y (1997) Objectification of hardness information of palpation. Bull Meiji Univ Orient Med (Japanese) 21: 25-49.
- Horikawa M, Ebihara S, Sakai F, Akiyama M (1993) Non-invasive measurement method for hardness in muscular tissues. Med Biol Eng Comput 31: 623-627.
- Nagao M, Yatabe K, Konno SI, Endo T, Yokota O (2013) Development of a finger-shaped muscle hardness tester and its measurement cases. JMEA 3: 405-413.
- Arima Y, Yano T (1998) Basic study on objectification of palpation. Japanese Journal of Medical Electronics and BiologicalEngineering 36: 321-336.
- Kimura K, Watanabe Y, Umeda M, Arima Y, Watsuji T, et al. (2007) Quantitative analysis of the relation between soft tissue stiffness palpated from the body surface and tissue hemodynamics in the human forearm. Physiol Meas 28: 1495-1505.
- Irie T, Oka H, Yamamoto T (1994) Measurement of hardness of human skin with impact force. Med Biol Eng Comput 32: 231-233.
- Omata S (1985) New type transducer for measuring contact compliances of a soft body. J Acoust Soc Am 78: 1-5.
- Chino K, Akagi R, Dohi M, Fukashiro S, Takahashi H (2012) Reliability and validity of quantifying absolute muscle hardness using ultrasound elastography. PLoS One 7: 45764.
- Wang CZ, Li TJ, Zheng YP (2014) Shear Modulus Estimation on Vastus Intermedius of Elderly and Young Females over the Entire Range of Isometric Contraction. PloS One 9: 101769.
- Takanashi A, Karasuno H, Shiota K, Fujiwara T, Konuma R, et al. (2008) Reproducibility and reliability of two kinds ofsoft tissue stiffness meter (Japanese). Rigakuryoho Kagaku 23: 297-300.
- Roylance D (2001) Engineering viscoelasticity. Department of Materials Science and Engineering. Massachusetts Institute of Technology Cambridge MA, USA.
- Chino K, Takahashi H (2016) Handheld tissue hardness meters for assessing the mechanical properties of skeletal muscle: Afeasibility study. J Manipulative PhysiolTher 39: 518-522.
- Kato G, Andrew PD, Sato H (2004) Reliability and validity of a device to measure muscle hardness. J Mech Med Biol 4: 213-225.
Citation: Arima Y (2020) Understanding Hardness Distribution on Biological Surfaces in Manipulative Therapy. J Altern Complement Integr Med 6: 098.
Copyright: © 2020 Yoshitaka Arima, et al. This is an open-access article distributed under the terms of the Creative Commons Attribution License, which permits unrestricted use, distribution, and reproduction in any medium, provided the original author and source are credited.