Vaccine Wastage and Its Contributing Factors in Public Health Facilities, Ethiopia: Explanatory Sequential Mixed Method Design
*Corresponding Author(s):
Solomon Ahmed MohammedDepartment Of Pharmacy, College Of Medicine And Health Science, Wollo University, Dessie, Ethiopia
Email:ahmedsolomon21@gmail.com
Abstract
Background: Although the availability of vaccines is crucial to achieve comprehensive and equitable immunization coverage, health facilities are struggling with vaccine wastage to support national immunization programs efficiently. This study assessed vaccine wastage and its contributing factors in public health facilities in Ethiopia.
Methods: A facility-based explanatory sequential mixed method was used. The quantitative method used an institutional-based cross-sectional study design to collecting vaccine wastage data retrospectively and verification of the vaccine cold chain management in all (27) health facilities and assessed the knowledge and attitude of 127 vaccinators and handlers. Descriptive and inferential statistics were made using statistical package for social sciences version 20. Finally, a phenomenological study design was employed among key informants and content analysis was performed using NVivo 11 plus.
Results: The overall vaccine wastage rate was 22.9% while the wastage factor was 1.4. The vaccine wastage rate was found highest for Bacillus-Calmette-Guerin (55.2%), 20 dose vials (55.2%), lyophilized (44.7%) and injectable vaccine (26.0%). Only 13 (48.1%) facilities were having satisfactory cold chain infrastructure while 17 (63%) had good cold chain practices. Sixty-eight (53.5%), 58 (45.7%) and 62 (48.8%) were rated as having satisfactory knowledge, positive attitude and good practice respectively. Distance from Woreda health office (p=0.03) and Ethiopian pharmaceutical supply agency (p=0.02), work experience (p=0.04), level of education (p=<0.001), profession (p=0.001), and attitude (p=0.04) of vaccinators and vaccine handlers were determinants of vaccine wastage. Key informants stated that factors related to logistics, immunization practices, health professional and vaccines were contributing to wastage.
Conclusion: Vaccine wastage in health care facilities was above the standard. Factors related to logistics, immunization practices, health professionals and vaccines were contributing to vaccines wastage. The identified factors should be considered complementary. Improving the availability of cold chain logistics, supportive supervisions and training were recommended to reduce wastage.
Keywords
Ethiopia; Cold chain management; Vaccine wastage
List of abbreviations
BCG: Bacillus-Calmette-Guerin
IPV: Injectable Polio Vaccine
OPV: Oral Polio Vaccine
PV: Pentavalent Vaccine
PCV: Pneumococcal Conjugate Vaccine
TT: Tetanus Toxoid
WHO: World Health Organization
Introduction
Vaccines are biological preparations produced from living organisms that enhance immunity against disease either by preventing or, in some cases, treating disease [1]. Vaccines prevent more than 2.5 million child deaths each year globally [2,3]. Thus, childhood immunization remains the most successful and cost-effective health intervention to improve health and reduce child mortality due to vaccine-preventable diseases [4-7].
Vaccine wastage can occur in “unopened vials” due to loss by expiry, vaccine vial monitor change, heat exposure, freezing, breakage, missing inventory and theft. In “opened vials” wastage may occur due to discarding remaining doses in an opened vial at the end of a session, the number of doses drawn from a vial is not the same as indicated on the label, poor reconstitution practices, opened vials are submerged in water, and contamination [8].
Only 19 out of 72 the Vaccine Alliance eligible countries had analyzable wastage data at World Health Organization (WHO) headquarters and the median wastage rates for single, two and ten dose vials were 5%, 7%, and 10% respectively. Ethiopia is among the 74% of the Vaccine Alliance eligible countries that do not report vaccine wastage [9]. The absence of national or local valid vaccine wastage data created a problem to monitor vaccine supply and logistics management [10]. Globally, greater than half of the vaccines was wasted [11]. In India, the highest vaccine wastage was recorded at service delivery and supply chain level for Bacillus-Calmette-Guerin (BCG)(61%) and Measles vaccine (3.46%)respectively [12].
Since vaccines are expensive [13], the percentage of losses were significant [14,15]. In 2014, 31% and 26% of low and lower-middle-income countries experienced stock-outs at the national level and district level respectively [16]. This high wastage and unavailability of vaccine translates into less coverage [17] and incomplete-immunization [15,18], and thus contributed to high levels of under 5 mortality [19]. Besides, the total cost to vaccinate a child also increases [20,21].
Despite efforts made so far, cold chain systems are struggling to efficiently support national immunization programs [22] and a combination of factors had resulted in a dysfunctional immunization cold chain and supply chain logistics [19]. The various studies indicated that there were gaps in maintaining cold chain system which ultimately compromise the potency of the vaccines and quality of the immunization services [20,23-27], besides the knowledge and attitude of vaccine handlers was suboptimal [28,29].
Vaccine wastage can be expected in all programs and some level of vaccine wastage is unavoidable and some are inevitable to control [30]. Thus there should be an acceptable limit of wastage [31]. Therefore, it is prudent to minimize vaccine wastage and maintaining vaccine potency to make vaccines available for vaccination. Thus, this study assessed vaccine wastage and contributing factors in in public health facilities of Oromia special zone.
Methods
Study area and period
The study was conducted in public health facilities of Oromia special zone from September 1- September 30, 2019. Oromia special zone is one of the ten zones found in the Amhara regional state having a tropical climate which could compromise the potency of vaccines. The administrative zone offered health service through 2 hospitals, 28 health centers, and 115 health posts for total population of 459,847.
Since January 2018, Ethiopian Pharmaceutical Supply Agency (EPSA) was responsible for the whole vaccine supply chain management and has started to transport vaccine to the Woreda health offices store each month. Health facilities received vaccines from their respective Woreda health offices. The types of vaccines supplied were BCG (20 dose), Pentavalent Vaccine (PV) (1 dose), Oral Polio Vaccine (OPV) (10 dose), Tetanus Toxoid (TT) (10 dose), Injectable Polio Vaccine (IPV) (10 dose), Pneumococcal Conjugate Vaccine (PCV) (2 dose), Rotavirus (1 dose) and Measles (10 dose).
Study design
A facility-based cross-sectional study design was used. It was to collect vaccine usage and wastage data retrospectively, to verify the available cold chain logistics and equipment’s and to assess the knowledge and attitude of vaccinators and vaccine handlers. Finally, a phenomenological study design was employed to fully explore in-depth about why and how vaccine wastes among the key informants.
Sources and study population
All public health facilities (28 health centers and 2 hospitals) which had been offering immunization services, all health workers (131) who had been involved in administering vaccination services in the surveyed facilities during the data collection period and all vaccines (8) received and wasted in between June 2018-June 2019 were the study population.
Inclusion and exclusion criteria
All vaccine wasted from 8/7/2018 to 7/7/2019, all public health facilities engaged in vaccination services, health professionals who were available and volunteers during the study period and health workers who handle vaccines at public health facilities were included in the study.
Health facilities not rendering vaccination services greater than one month, wasted vaccine other than the EPI program and health professionals who was refuse to participate in the study were excluded from the study.
Sample size determination and sampling procedures
All public health facilities (27) which had been involved in offering immunization services were included. But one health center and both hospitals were excluded due to incomplete vaccine records and interruptions in rendering vaccination services respectively. All health professionals, except four (127) who engaged in vaccine cold chain management activities of the selected public health facilities were included. Four participants refused to participate. Purposive sampling was used to select key informants by Woreda health office vaccine logistics officers. Health professionals where recruited in their working health institutions by Woreda health office vaccine logistics officers by identifying eligible participants and explaining the study goals. Woreda health office is responsible for coordinating, monitoring and evaluating the vaccination program. The sample size for the phenomenological study was depending on the saturation of information concerning emerging themes. Thus, 13 key informants (4 midwives, 8 nurses, and one health officer) were included. The sample for quantitative study can be considered representative of a larger population. However, the nature of qualitative study alters confidence in the generalizability of the findings.
Variables
The outcome variable of the study is vaccine wastage. Socio-demographic characteristics, knowledge, attitude and practice of health professionals, characteristics of health institutions, vial size, cold chain failures, and session size were predictor variables.
Data collection tools and procedures
Records of vaccine usage and wastage was abstracted by reviewing vaccine registration logbooks, health commodity management information system and stock cards using a data collection sheet adapted from WHO [8]. A structured observation checklist adopted from WHO was also used to assess the practice and system of vaccine cold chain of health facilities [32]. The vaccine cold chain practice was assessed using a total of 25 questions under 9 domains. Knowledge and attitude questions were adapted from WHO [33-35]. Knowledge was assessed using a total of 21 questions and attitude toward vaccine cold chain management was scored using a total of 6 questions on a 5 point Likert scale.
For the qualitative part of the study, the semi-structured interview guide was prepared in English and translated to Amharic and finally back-translated into the English language to maintain consistency and standardization of the instruments. The principal investigator conducted the in-depth interview which lasted an average of 20 minutes. The interview was done in Amharic and field note were also used. All interviews were audio-recorded and transcribed verbatim.
Issues of reflexivity: The principal investigator status as an insider
The principal investigators status as a “professional” offers certain strengths and limitations for this study. The investigators approached as senior pharmacy professionals and operated with awareness of insider bias. They practiced non-judgment and maintained awareness of professional relativity in their work. The limitation was they faced with the challenge of being perceived as a powerful individual based on their position.
Data management and analysis
All collected data was critically examined for completeness, accuracy, clarity, and consistency during data collection. The data was entered using EpiData version 4.6 and exported to Statistical Package for Social Sciences (SPSS) version 20 for analysis. Knowledge and practices was assigned a score of 1 and 0 for correct and false responses respectively. The mean knowledge, attitude and practice score for each respondent and vaccine cold chain practice and infrastructure of health facilities was calculated. Mean score was used to categorize variables.
The associations between dependent and independent variables were tested by independent t-test and multiple linear regression with 95 % confidence intervals, and variable with p-value < 0.05 were taken as statistically significant. Kruskal-Wallis test was also used for variables violating assumptions. Analysis of variance and independent t-test were also computed to examine subgroup interactions.
All written transcripts were read several times to obtain the overall feeling for them. All sections of original transcripts were translated into English to facilitate coding and each transcript was coded line by line using NVivo 11 plus and analyzed using the principles of content analysis.
Operational definition
- High volume health center: Health facilities that serve more than 100 patients per day.
- Medium volume health center: Health facilities that serve 50 to 100 patients per day.
- Low volume health center: Health facilities that serve less than 50 patients per day.
Ethical considerations
The Ethics Review Committee of the College of Medicine and Health Sciences, Wollo University (CMHS/406/13/11) and Oromia special zone health department (OZHD/544/2011) approved this study. The Ethics Review Committee approved use of oral consent. Consent was also requested from the surveyed health facilities and their respective Woreda health offices. Moreover, study participants involved in the study were fully informed about the nature and objectives of the study and the confidentiality of the data. Since there is no anticipated risk on study participants and no sensitive data was collected, their consent to participate in the study was obtained verbally. Moreover, the most of the data, which was extracted from health facilities, were related with vaccines, not directly related with human study participants. Verbal consent was documented by writing the time and date on the researcher version of consent form that the participant has read and understood the consent form.
Results
Among the 27 health centers, 22 (81.5%) were low volume, 2 (7.4%) were medium volume and 3 (11.1%) were high volume. Eight (29.6%) health facilities were located in urban and 19 (70.4%) in rural settings. Of the total health centers, the minimum distance was 0.1 kilometer and the maximum was 36 kilometers away from the Woreda health office with mean and SD of 14.5 ± 10.4. On the other hand, health facilities were located 18 and 150 kilometers away from the supplier at a minimum and maximum respectively with mean and SD of 96.9 ± 30.4.
The vaccine wastage rate (55.2%) and vaccine wastage factor (2.3) was found highest for BCG and the lowest wastage was seen in the use of Rotavirus (7.7%). The highest open (6.5%) and unopened vaccine wastage rate (48.7%) was for BCG (Table 1). The overall vaccine wastage rate was 22.9% while wastage factor was 1.41. A 9 years experienced nurse portrayed, “we have a hard time using a multi vial policy every day. That's why we administered the vaccine only 2 times a week. Even so, there was more than an acceptable level of wastage. ….it was the measles and BCG most wasted”. Kruskal-Wallis test showed that there was a statistically significant wastage difference among each vaccine (p< 0.001).
The wastage rate (55.2%) for 20 dose vials was higher than 10 (24.2%), 2(15.9%) and 1 doses vial (7.8%). Eight years experienced midwife said, “….in opening 20 dose vials, and we got a maximum of 11 or 12 children per session. The vial size is too large’’. Another 8 years experienced nurse stated, “…inadequate number of children per session made the vaccines to be discarded”.
|
S. no |
Vaccines |
Dose per vial |
Vaccine usage rate |
Vaccine wastage rate |
Vaccine wastage rate |
Wastage factor |
P value |
|
|
Unopened |
Opened |
|||||||
|
1 |
BCG |
20 |
44.8 |
55.2 |
6.5 |
48.7 |
2.3 |
0.00 |
|
2 |
OPV |
10 |
80.1 |
19.9 |
6.3 |
13.7 |
1.3 |
|
|
3 |
IPV |
10 |
77.1 |
22.9 |
5.5 |
17.5 |
1.3 |
|
|
4 |
TT |
10 |
80.4 |
19.7 |
4.8 |
14.8 |
1.3 |
|
|
5 |
PV |
1 |
92.0 |
7.98 |
0.7 |
7.3 |
1.1 |
|
|
6 |
PCV |
2 |
84.1 |
15.9 |
1.8 |
14.1 |
1.2 |
|
|
7 |
Rotavirus |
1 |
92.3 |
7.7 |
0.9 |
6.8 |
1.1 |
|
|
8 |
Measles |
10 |
65.7 |
34.3 |
11.0 |
23.1 |
1.8 |
|
|
Total |
77.7 |
22.9 |
4.7 |
18.2 |
1.4 |
18.2 |
1.4 |
|
Table 1: Wastage rate and factor for different vaccines in public health facilities of Oromia special zone, 2019.
With regards to types of vaccines, the wastage rate was higher for lyophilized (44.7%) than the liquid vaccine (15.7%). A 9 year’s experienced nurse said, “Measles was unable to form solution. I got the vaccine precipitated”. It was further substantiated by 6 years experienced nurse, “after diluting, I saw it. It was small. The reconstituted vaccines were not enough to immunize all beneficiaries”. The vaccine wastage rate was found higher in the injectable vaccine (26.0%) than oral route vaccines (13.8%) (Figure 1). Eight years experienced nurse stated, “I have more doses with a syringe while sucking the vaccine from the vial”.
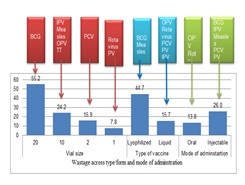 Figure 1: Wastage across type/form of vaccine in public health facilities, Oromia special zone, 2019.
Lyophilized, 20 doses, and injectable vaccines had the higher open vaccine wastage rate 35.9%, 48.7%, and 20.9% respectively while lyophilized, 10 dose and injectable vaccines had the higher unopened vaccine wastage rate 8.7%, 6.9%, and 5.0% respectively. Wastage factor was also found higher for lyophilized (2.0), 20 doses (2.3) and injectable (1.5) vaccines. Difference in wastage rate for vial size (= 2.4, p = 0.01), type of vaccine (β= -0.02, p = 0.006) and mode of administration (β= -13.55, p = 0.015) of vaccines was found significant (Table 2). Increasing the vial size will result in increment of vaccine wastage by 2.4. Moreover, changing the formulation from lyophilized to liquid formulation, and injection to oral dosage form will change the vaccine wastage by -0.02 and -13.5 respectively.
|
Type and form of vaccines |
Vaccine wastage rate |
Wastage factor |
P value |
(95%CI) |
||
|
Unopened |
Opened |
|||||
|
Vial size |
1 |
0.8 |
7.1 |
1.1 |
0.01 |
2.4 (1.23-3.14) |
|
2 |
1.8 |
14.1 |
1.2 |
|||
|
10 |
6.7 |
17.3 |
1.4 |
|||
|
20 |
6.5 |
48.7 |
2.3 |
|||
|
Type of vaccine |
Lyophilized |
8.7 |
35.9 |
2.0 |
0.006 |
-0.02 (-0.04- -0.01) |
|
Liquid |
3.3 |
12.4 |
1.2 |
|||
|
Mode of Administr-ation |
Injectable |
5.0 |
20.9 |
1.5 |
0.01 |
-13.5 (-24.1- 3.68) |
|
Oral |
3.6 |
10.2 |
1.2 |
|||
Table 2: Wastage across types/forms of vaccine in public health facilities of Oromia special zone, 2019.
Health facilities found in urban had highest wastage (23.4%) but lowest wastage factor (1.4). Medium volume health facilities had a highest wastage rate (26.2%) and factor (1.5) while high volume health facilities had lowest wastage rate (19.8%) and factor (1.3). There is no statistically significant difference among volume and location health facilities (Table 3).
|
Facility description |
Vaccine wastage rate |
Vaccine wastage rate |
Wastage factor |
P value |
||
|
Unopened |
Opened |
|||||
|
Location |
Urban |
23.4 |
4.2 |
19.1 |
1.4 |
0.81 |
|
Rural |
22.8 |
4.9 |
17.9 |
1.4 |
||
|
Volume |
High |
19.8 |
2.3 |
17.4 |
1.3 |
0.05 |
|
Low |
23.1 |
4.7 |
18.3 |
1.4 |
||
|
Medium |
26.2 |
7.7 |
18.5 |
1.5 |
||
Table 3: Wastage across health facility location and volume in public health facilities of Oromia special zone, 2019.
Public health facilities of Oromia special zone had an annual vaccines supply amounting to USD 411,282.9 and the annual wastage rate was 13.3% amounting to USD 54,868.2. Unopened and open vaccine wastage constituted USD 8,522.2 (2.1%) and 46,345.9 (11.3%) respectively. From 8 vaccines that were assessed, BCG and Measles vaccines had the leading with the overall wastage rate of 48.2% and 28.5% accounting for USD 3,895.6 and 713.2 respectively (Table 4) while the least observed in the vaccines were PV with wastage rate of 6.9% amounting to USD 3,673.7. Midwife, having 2 years’ experienceemphasized the situation, “…lot of costly vaccine supplied and some of them have recently been wasted”. Kruskal-Wallis test showed that there was a statistically significant difference among each vaccine wastage by monetary value (p < 0.001).
|
Vaccine |
Monetary value (USD) |
Percentage |
P-value |
||||
|
Vaccine supply |
Unopened Wasted |
Open Wasted |
Unopened wasted |
Open Wasted |
Total wasted |
||
|
BCG |
4566.8 |
256.8 |
1945.6 |
5.6 |
42.6 |
48.2 |
0.00 |
|
OPV |
11362.7 |
452.5 |
1455.4 |
4.0 |
12.8 |
16.8 |
|
|
IPV |
20028.8 |
1274.2 |
2754.4 |
6.4 |
13.8 |
20.1 |
|
|
TT |
32339.2 |
1225.1 |
4154.9 |
3.8 |
12.9 |
16.6 |
|
|
PV |
53663.8 |
318.4 |
3355.3 |
0.6 |
6.3 |
6.9 |
|
|
PCV |
199122.9 |
3538.8 |
25490.1 |
1.8 |
12.8 |
14.6 |
|
|
Rotavirus |
78832.3 |
603.1 |
4803.3 |
0.8 |
6.1 |
6.9 |
|
|
Measles |
11365.8 |
853.3 |
2386.9 |
7.5 |
21.0 |
28.5 |
|
|
Total |
411282.2 |
8522.2 |
46345.9 |
2.1 |
11.3 |
13.3 |
|
Table 4: Wastage rate by monetary value in public health facilities of Oromia special zone, 2019.
Opened vial wastage by dose and monetary value were 31.1% and 11.3% while unopened vial wastage by dose and monetary value were 8.6% and 2.1% respectively. Independent t test was performed to determine the wastage difference across opened/unopened type of wastage by dose and there was a statistically significant difference (β= -13.55, p = 0.015) (Table 5). The major reasons for wastage of vaccines were expiry (24%), VVM change (26%), and discarded dose (50%) amounting to USD 81,541.6, 91444.0 and 238,287.3 respectively.
|
Type of vaccines wastage |
Vaccine wastage rate |
P value |
β (95% CI) |
|
|
Type of wastage by dose |
Opened |
31.1 |
0.015* |
13.55 (-24.02- -3.88) |
|
|
Unopened |
8.6 |
|
|
|
Type of wastage by monetary value |
Opened |
11.3 |
0.00** |
|
|
|
Unopened |
2.1 |
|
|
Table 5: Opened and unopened vaccine wastage rate in public health facilities of Oromia special zone, 2019.
*Independent t test**Kruskal-Wallis test
Only 13 (48.1%) of health facilities were rated as having satisfactory cold chain infrastructure while 17 (63%) had good cold chain practices. Eight years experienced nurse portrayed“we do not have enough storage for all vaccines supply”.
Another 9 years experienced nurse stated, “The power interruption cause vaccine vials monitor to change. We have a health post nearby and we transport vaccines to there”.
This was further explained by 4 year experienced midwife, “When the service time ends, the generator will be switched off. Stand always to save fuel. No one bothers about vaccines”.
In multiple linear regressions, heath facilities characteristics, cold chain infrastructure, and practice were computed. The effect for health facilities cold chain infrastructure, practice, level, and volume were not found statistically significant (p<0.05) but the distance from Woreda health office (β= -0.24, p = 0.03) and EPSA (β= 0.07, p=0.02) in wastage rate was found significant (Table 6).
|
Variables |
Number(Percentage) |
P value |
β (95% CI) |
|
|
Cold chain infrastructure |
Satisfactory |
13(48.1) |
0.54 |
1.28(-3.11-5.69) |
|
|
Unsatisfactory |
14(51.9) |
|
|
|
Cold chain practice |
Good |
17(63) |
0.78 |
0.53(-3.44-4.51) |
|
|
Poor |
10(37) |
|
|
|
Level of health facility |
Low |
21(81.5) |
0.23 |
-2.46(-6.61-1.69) |
|
|
Medium |
2(7.4) |
|
|
|
|
High |
3(11.1) |
|
|
|
Location |
Rural |
19(70.4) |
0.95 |
0.18(-6.31-6.68) |
|
|
Urban |
8(29.6) |
|
|
|
Distance from Woreda health office |
0.03 |
-0.24(-0.46- -0.01) |
0.03 |
-0.24(-0.46- -0.01) |
|
Distance from EPSA |
0.02 |
0.07(0.01-0.13) |
0.02 |
0.07(0.01-0.13) |
Table 6: Health facility factors contributing to vaccine wastage in health facility of Oromia special zone, 2019.
There were 85(66.9%) male and 42(33.1%) female respondents with a mean age of 25.95. Among the vaccinator and vaccine handlers included in the study, 50 (39.4%) were nurses, 9(7.1%) were health officers and 68 (53.5%) were midwives. With regards to the level of education, 48 (37.8%) were diploma while the rest 79 (62.2%) had a degree having work experience ranged from 4 months to 14 years with mean work experience and SD of 3.29 ± 2.44. Only 31 (24.4%) and 35 (27.6%) of vaccinator and vaccine handlers received training and supervision on cold chain management respectively (Table 7).
|
S. no |
Socio-demographic profile |
Number |
Percentage |
|
|
1 |
Sex |
Male |
85 |
66.9 |
|
|
|
Female |
42 |
33 |
|
2 |
Age |
20-24 |
49 |
38.6 |
|
|
|
25-29 |
57 |
44.9 |
|
|
|
≥30 |
21 |
16.5 |
|
3 |
Work experience |
<5 |
93 |
73.2 |
|
|
|
≥5 |
34 |
26.8 |
|
4 |
Level of education |
Diploma |
79 |
62.2 |
|
|
|
Degree |
48 |
37.8 |
|
5 |
Education |
Midwifery |
68 |
53.5 |
|
|
|
Health officer |
9 |
7.1 |
|
|
|
Nurse |
50 |
39.4 |
|
6 |
Salary |
1651-3200 |
70 |
55.1 |
|
|
|
3201 |
43 |
33.9 |
|
|
|
>5251 |
14 |
11 |
|
7 |
Received training on cold chain management |
Yes |
31 |
24.4 |
|
|
|
No |
96 |
75.6 |
|
8 |
Time of last training |
Less than 6 month |
14 |
45.2 |
|
|
|
6-12 months ago |
11 |
35.5 |
|
|
|
Greater than a year ago |
6 |
19.3 |
|
9 |
Receive supervision |
Yes |
35 |
27.6 |
|
|
|
No |
92 |
72.4 |
|
10 |
Time of last supervisory visits |
Less than 6 month |
15 |
42.9 |
|
|
|
6-12 months ago |
12 |
34.3 |
|
|
|
Greater than a year ago |
8 |
22.8 |
Table 7: Socio-demographic characteristics of vaccinators and vaccine handlers in public health facilities of Oromia special zone, (n=127).
Sixty-eight (53.5%), 58 (45.7%) and 62 (48.8%) vaccinator and vaccine handlers were rated as having satisfactory knowledge, positive attitude and good practice respectively. A 2 years experienced midwife explained, “my knowledge is so limited and do not update my selves because I don't see it as issue of my department”. He also stated the practice, “…. forgetting vaccines on the ice pack is usually I experienced through negligence” and attitude “we store water in the refrigerator saying that we will drink when we are thirsty”.
Socio-demographic characteristics, knowledge, attitude and practice of participants were run in to multiple linear regressions. Work experience (β= 1.91, p= 0.04), level of education (β=33.16, p = < 0.001), profession (β= 3.76, p = 0.001), and attitude (β= 2.3, p = 0.04) have statistically significant effect on vaccine wastage (p<0.05) (Table 8). Increase health facilities distance by one-kilo meters from Woreda health office and EPSA will reduce and increased vaccine wastage by 0.24 and 0.07 respectively. Learning more and increasing work experience increases vaccine wastage by 33.16 and 1.91 respectively.
|
Descriptions |
Percentage |
P value |
β (95 % CI) |
|
|
Work experience |
<5 |
73.2 |
0.04 |
1.91(0.1-3.71) |
|
≥5 |
26.8 |
|||
|
Level of education |
Diploma |
62.2 |
0.00 |
33.16(28.1-38.22) |
|
Degree |
37.8 |
|||
|
Education |
Midwifery |
53.5 |
0.001 |
3.76(2.04-5.49) |
|
Health officer |
7.1 |
|||
|
Nurse |
39.4 |
|||
|
Time of last training |
< than 6 month |
45.2 |
0.16 |
-1.24(-3.13-0.65) |
|
6-12 months ago |
35.5 |
|||
|
> than a year ago |
19.3 |
|||
|
Time of last supervisory visits |
< than 6 month |
42.9 |
0.69 |
-0.25(-1.73-123) |
|
6-12 months ago |
34.3 |
|||
|
> than a year ago |
22.8 |
|||
|
Knowledge |
Satisfactory |
53.5 |
0.78 |
0.22(-1.68-2.14) |
|
Unsatisfactory |
46.5 |
|||
|
Attitude |
Positive |
45.7 |
0.04 |
2.3(0.12-4.47) |
|
Negative |
54.3 |
|||
Table 8: Socio-demographic factors contributing to vaccine wastage in public health facilities of Oromia special zone, 2019.
Discussion
Vaccine wastage could be expected in all programs and there should be an acceptable limit [36]. The estimated vaccine wastage rate and factor in the present study in terms of the dose were found to be 22.9% and 1.41. It is slightly higher than the national [37] and WHO wastage rate (20%) [8]. The finding was lower than the government of India's recommended wastage rate of 25% and the wastage factor of 1.3 [38]. This was supported by qualitative findings where higher level of wastage above the standard was still reported. The difference might be attributed to their national policy, countries geographic condition, cold chain system and competency of professionals [39].
The wastage rate and factor of the BCG vaccine was 55.2% and 2.3 respectively. The findings were higher than the recommended values (50%) of Ethiopia [37]. The wastage rate and wastage factor were highest for BCG found in various studies done in India [30, 31, 39], but it is much lower than the results found by UNICEF [12] (61%) and Islam et al [40] (79.4%) in India. The finding (54.9%) was comparable with study done in Gambia [41]. This may be because of the maximum doses per vial size of BCG and as per national guidelines; the vaccine should be discarded after six hours of reconstitution if adequate children were not approached to the site. The number of beneficiaries per session decrease, the wastage per session increase and it’s statistically significant [42].
The wastage rate for OPV was 19.9% and found much lower than UNICEF [12] (47%), Sharma et al [31] (29.5%) and Islam et al [40] (21.7%) but results found by Tiwari et al (14.7%), Usuf et al [41] (4.4%) and Bagdey et al [30] (5.2%) was much lower than this study. The wastage rate of the OPV vaccine was higher than the national [37] as well as WHO recommended wastage rate (10%) [8]. The higher wastage rate for OPV might be wastage at the time of administering a vaccine, for example, administering more drops than required due to faulty vaccinating technique of vaccinators, moving the head of a child at the time of ingestion of vaccine and the reaction of a baby while administering vaccines.
The calculated wastage rate for measles vaccine was 34.3% which in line with wastage rate obtained by UNICEF [12] (35%) but higher than Sharma et al [31] (27.7%), Islam et al [40] (30.7%), Tiwari et al [39] (21.7%), Usuf et al [41] (15.6%) and Bagdey et al [30] (11.4%). The finding was also higher than the national [37] and WHO [8] recommended wastage rate (25%). This may be because of discarded dose within 6 hours of reconstitution and less number of beneficiaries per session.
Wastage rate for TT vaccine (19.7%) nearly 2.5 higher than Islam et al [40] and Tiwari et al [39] (21.7%), 10 times higher than Usuf et al [41] and 3.6 times higher than Bagdey et al [30] while 0.6 times lower than UNICEF findings [12]. The finding also higher than the recommended wastage rate of Ethiopia [37] and WHO [8] (10%). This might be due that the vaccine placed in the delivery ward, unlike other EPI vaccines and vaccination errors.
The wastage rate for the injectable vaccine (26.0%) was found more than the oral vaccine (13.8%). The result was different from studies by Sharma et al [31] (injectable 15.6%, oral 29.5%), Islam et al [40] (injectable 12.6%, oral 21.7%) and UNICEF [12] (injectable 35%, oral 47%). A study conducted by Tiwari et al [39] found a negligible difference (injectable 13.3%, oral 14.7%). The discrepancy might be due to errors during the reconstitution and measuring of injectable vaccines. The qualitative study also substantiated this finding. Appropriate reconstitution practice, mode of administration and community mobilization can reduce wastage of vaccines.
In the present study, the vaccine wastage rate for the lyophilized vaccine (44.7%) was found higher than the liquid vaccine (15.7%). Similar studies revealed that more wastage for lyophilized vaccine were found by Islam et al [40] (lyophilized 54.8%, liquid 16.3%) and UNICEF ([12] lyophilized 50%, liquid 38%) but Sharma et al [31] (lyophilized 23.3%, liquid 20.7%), Bagdey et al [30] (lyophilized 18%, liquid 5.93%), Tiwari et al [39] (lyophilized 21.0%, liquid 11.1%)was found lower. The higher wastage for lyophilized vaccines attributed to their need to be reconstituting with diluents before vaccination and to be discarded within 6 hours of the constitution and an inadequate number of beneficiaries per session. Key informants also mentioned this reasons. World Health Organization also noted that higher wastage is expected with lyophilized vaccines since liquid vaccines can be used in subsequent sessions for up to 4 weeks [8].
The wastage rate in this study for 20 dose vials (55.2%) was higher than 10 doses (24.2%), 2 doses (15.9%) and one dose of the vial (7.8%). The physical reaction and movement of the baby during vaccination made the opened dose to be discarded. Hence, opened vaccine wastage for one dose vial was recorded. These values were higher than studies by Sharma et al [31] (10 dose 13.9%, 20 dose 29.5%), Bagdey et al [30] (10 dose 15.7%, 20 dose 4.3%) and Tiwari et al [39] (10 dose 12.6%, 20 dose 14.7%). The difference was because of the number of children attending immunization sessions is less, reconstitution and measurement errors.
The present study indicated that the higher the number of doses in vials, the higher will be the wastage and the difference was statistically significant. The result was in line with Mehta et al study [42] in which wastage of vaccines has a direct relationship with vial size. Switching from 10 to 5 dose vials, the wastage rate for IPV was reduced from 0.3 to 0.1 in Bangladesh, 0.2 to 0.1 in India, 0.13 to 0.06 in Mozambique, and 0.09 to 0.04 in Uganda, respectively [43]. Although the reduction of vial size will have a substantial incremental impact on storage volume requirements as the multi-dose vial is more cost-effective and wastage should be justified [12]. A high wastage rate attributable to opening a multi-dose vial for a small session size to avoid missed opportunities is more justified than wastage attributable to freezing or expiry [8].
Wastage of vaccines has a direct relationship with session size [42]. For about 17.5% of OPV sessions, up to 5 doses per session were given and the wastage was more than 75%. The lyophilized vaccine showed that less than 5 doses per session were administered. This indicated that the ideal size of these vaccines to be 5 doses per vial [12]. Key informants also revealed that wastage was attributed to large vial size due to inadequate number of children per session. Adhering proper reconstitution of vaccines, accuracy in measurement and improving community awareness and mobilization can reduce wastage of vaccines.
In this study, there was a negligible wastage difference between urban (23.4%) and rural health facilities (22.8%). The result was in line with study done in India [41] where the wastage difference between rural and urban facilities was statistically insignificant. However, vaccine wastage rates are higher than expected in the urban primary health care setting of India [44]. Although acceptable levels wastage varies between facilities experience and local situations, WHO stated that remote services have to open more vials per child than urban services and as a result, higher wastage rates are expected [36]. Medium volume health facilities had the highest wastage rate (26.2%) and factor (1.5) while high volume health facilities had the lowest wastage rate (19.8%) and factor (1.3). This might be attributed to health facilities immunization practice and their professional competency.
Public health facilities of Oromia's special zone had an annual wastage rate of 13.3% amounting to USD 54,868.2 and it was higher than the targeted (2%) wastage rate [45]. The WHO reports high wastage rates are still occurring in countries [46] and newer and much more expensive vaccines have a dramatic impact on the cost of wastage [36]. For example, India accounted 39% procured vaccine cost to cover the vaccine wasted [12] and increase vaccine demand and inflate overall program cost [42]. Key informants also portrayed that expensive vaccines were wasted. Unnecessary vaccine wastage in developing countries translated fewer children being vaccinated with the same resources [17]. Reducing vaccine wastage has great importance to spare money and increased effectiveness of delivery services [15].
On the other hand, high wastage result shortage of vaccines and a decline in the quality of healthcare services [47]. In Ethiopia, 67% of health centers and 40% of health posts experienced stock out in the previous six months and the median stock-out time for BCG, Rotavirus and TT vaccines was more than a week [48]. About 15% and 35% of the total sessions observed in India, measles and BCG vaccine was not available at the session site [12]. Though child vaccination coverage significantly varied among zones, coverage was low [49] and was found to be lower in households with the poorest wealth, low parity and no maternal education [48]. In Nigeria, 30% of caregivers reported being turned away for vaccination at least once and 53% of these children had not yet received the missed dose [20].
Unopened and open vaccine wastage constituted USD 8,522.2 (2.1%) and 46,345.9 (11.3%) respectively. In Nigeria, there was zero wastage for all unopened vials [20]. In Ethiopia, unopened wastage for TT was 2.4 fold higher and nearly 13 times lower for BCG than the present study [50]. Freezing, near expiry and VVM stage 2 supplies were stated for unopened vaccines wastage by key informants. Unopened vial wastage is usually attributable to cold chain and stock management problems [12] and can be minimized while opened vials wastage can be reduced by the introduction of the multi-dose vial policy, the effective use of VVM, and improved immunization strategies and practices [46].
The major reasons for wastage of vaccines were expiry, VVM change, and discarded dose amounting 24%, 26%, and 50% wastage respectively. Rotavirus vaccines expired in stock in all facilities and unopened vials wasted through missing inventory, VVM failure, breakage and use of wrong diluent [41]. Using incorrect figures made the country to face over stock leading to increased wastage through expiry [46]. Wastage of vials because of VVM change was also observed in India [51].
The result of the present study showed that 63% of health centers had good cold chain practices. As compared to national assessment, the finding was better [48]. Still, it was better than various literature in which the practice of cold chain found suboptimal [27,48,52] and fair [4,25]. The finding also supported by key informants’ who portrayed that cold chain practices was poor. Cold chain failures do continue to occur at the primary session site [6]. Poor cold chain management at all levels may adversely affect the quality of the vaccine [52] and this results in the revaccination of many patients and significant financial loss [53]. Since vaccine storage is the most critical element of immunization, the reliability of the electricity supply and routine cold chain maintenances are the keys to safe vaccine storage and delivery. Provision, use, and care of equipment and adequate funding [54] can make significant improvements in cold chain management resulting in considerable savings in vaccine wastage [6].
This study showed that 53.5% of vaccinators and vaccine handlers were rated as having satisfactory knowledge. The finding was consistent with a study done in central Ethiopia and Bale zone where 54.3% [55] and 54.6% [23] had satisfactory knowledge but comparable with a study conducted in the Guragie zone (51.3%) [56]. Various studies also reported that knowledge of health personnel on cold chain management in Nigeria [25,
29,57,58] and India [4,52,59] was poor, India [28] was average, and Malaysia [60] and India [10] was good. The discrepancy might be due to a difference in staff motivation, study participants’ qualifications, and characteristics of the country and nature of the study. Health professionals in charge should know how to carry out vaccines stock management and how to fill stock records. Thus, appropriate vaccines stock management training should be given.
The present study also found 45.7% vaccinators and vaccine handlers had a positive attitude on cold chain management. The result was better than a study done in Nigeria where 79.8% had a poor attitude towards cold chain [60]. However, it is much lesser than the study conducted in Nigeria reported 93.2% [29]. The qualitative study also revealed the knowledge gap and attitude problem among vaccinators and vaccine handlers made vaccine cold chain management compromised. This wide discrepancy among vaccinators and vaccine handlers might be due to geographical and sociocultural differences among studies.
Good practice of cold chain management among vaccinators and vaccine handlers was 48.8% in this study. The finding was 1.5 fold lower (73%) than the practice of cold chain management in Nigeria [25,57]. Respondents who had good knowledge and received formal training on vaccine cold chain management were more likely to have good vaccine practices [28,57]. An increasing level of education of respondents improves 5.2 times to have a good practice of cold chain management [25].
This study showed that determinates of vaccine wastage were work experience (p=0.04), level of education (p <0.001), profession (p=0.001), attitude (p=0.04), and distance from Woreda health office (p=0.03) and EPSA (p=0.02) and had statistically significant effect on vaccine wastage. When health facilities distance increase by one-kilo meters from Woreda health office and EPSA, vaccine wastage reduced and increased by 0.24 and 0.07 respectively. It may be because of staying longer time during transporting vaccines by EPSA which increases exposure to environmental conditions. Learning more increases vaccine wastage by 33.16 and increasing work experience of vaccinators and vaccine handlers by one year will increase vaccine wastage by 1.91. This might be due to the negligence of professionals up on working and learning more. Creating and building awareness of vaccinators and vaccine handlers will also reduce vaccine wastage by 1.02 as professionals are free from misperceptions.
Although the nature of phenomenological study alters the generalizability of the findings, both study designs identified complimentary results and made the finding to be relevant to vaccination service. The study utilizes recorded vaccines utilization and wastage data from health facilities. Although the study was conducted by cross checking various sources of information, the poor quality of information management systems in health institutions may introduce bias to the study. The shorter period of data collection was also the limitation of the study.
Conclusion
Vaccine wastage in health care facilities was above the standard. BCG and measles vaccines had the highest levels of wastage. Besides, 20 doses of vial preparations, vaccines using a lyophilized production method, and injectable vaccines had a higher wastage.Health center’s distance from the EPSA and the Woreda health office, vaccinators and vaccine handlers’ year of service, level of education, profession, and attitude were significant causes of vaccine wastage.Improving the availability of cold chain logistics, supportive supervisions, training and community mobilization were recommended to reduce wastage.
References
- WHO (2012) Vaccine fact book. Geneva: Switzerland: World Health Organization.
- “Immunization: Introduction.
- Andre FE, Booy R, Bock HL, Clemens J, Datta SK, et al. (2008) Vaccination greatly reduces disease, disability, death and inequity worldwide. Bulletin of the World Health Organization 86: 140-146.
- Krishnappa L, Anniappan AB, Voderhobli NH, Krishna SK, Yathiraj S, et al. (2014) Evaluation of cold chain practices in urban health centers of a metro city in India. National J Community Medicine 5: 288-292.
- Esposito DH, Tate JE, Kang G, Parashar UD (2011) Projected impact and cost-effectiveness of a rotavirusvirus vaccination program in India, 2008. Clinical Infectious Diseases 52: 171-177.
- Turner N, Laws A, Roberts L (2011) Assessing the effectiveness of cold chain management for childhood vaccines. Journal of primary health care 3: 278-282.
- https://www.who.int/emergencies/diseases/novel-coronavirus-2019/question-and-answers-hub/q-a-detail/coronavirus-disease-(covid-19)-vaccines?adgroupsurvey={adgroupsurvey}&gclid=CjwKCAjwsfuYBhAZEiwA5a6CDPyvhMHUpp87rHmaGLz1jhDn-l-iQ9j6Rn5OK2GbJvrx5SrrkVnzIBoCQhQQAvD_BwE
- WHO (2005)Monitoring vaccine wastage at country level: guidelines for programme managers. World Health Organization;.
- Parmar D, Baruwa E, Zuber P, Kone S (2010) Impact of wastage on single and multi-dose vaccine vials: Implications for introducing pneumococcal vaccines in developing countries. Human Vaccines 6: 270-278.
- Harsh S, Bonny S, Ketan P, Surendra J (2016) Closing gaps in routine immunization-impact and cost assessment on components of new vaccine policy in routine immunization in Gujarat, India. Journal Of Research In Medical And Dental Science 4: 70-74.
- GAVI (2010) First Inception Report for Countries Receiving Support from inception. The Global Alliance For Vaccines and immunizaions.
- UNICEF (2010) Vaccine Wastage Assessment. Field assessment and observations from National stores and five selected states of India.
- UNICEF (2017) In support of the global polio Eradication Initiative: Guidance note on cold chain logistics and vaccine management during polio supplementary immunization activities.
- Dias B, Almeida R (2017) Rotavirusvirus and Triple Viral Vaccine Losses in Vaccination Rooms: A Cross-Sectional Study. MedicalExpress 4.
- Ebong C, Levy P (2011) Impact of the introduction of new vaccines and vaccine wastage rate on the cost-effectiveness of routine EPI: Lessons from a descriptive study in a Cameroonian health district. Cost Effectiveness and Resource Allocation 9: 9.
- WHO (2016) Achieving immunization targets with the comprehensive effective vaccine management (EVM) framework: WHO/UNICEF joint statement. World Health Organization.
- Patel P, Rana J, Jangid S, Bavarva N, Patel M, et al. (2016) Vaccine wastage assessment after introduction of open vial policy in Surat municipal corporation area of India. International journal of health policy and management 5: 233.
- Mugada V, Chandrabhotla S, Kaja D, Machara S (2017) Knowledge towards childhood immunization among mothers & reasons for incomplete immunization. Journal of Applied Pharmaceutical Science 7: 157-161.
- Sarley D, Mahmud M, Idris J, Osunkiyesi M, Dibosa-Osadolor O, et al. (2017) Transforming vaccines supply chains in Nigeria. Vaccine 35: 2167-2174.
- Wallace AS, Willis F, Nwaze E, Dieng B, Sipilanyambe N, et al. (2017) Vaccine wastage in Nigeria: An assessment of wastage rates and related vaccinator knowledge, attitudes and practices. Vaccine 35: 6751-6758.
- Jacobson S, Karnani T, Sewell E (2004) Assessing the impact of wastage on pediatric vaccine immunization formulary costs using a vaccine selection algorithm. Vaccine 22: 2307-2315.
- Ashok A, Brison M, LeTallec Y (2017) Improving cold chain systems: Challenges and solutions. Vaccine 35: 2217-2223.
- Woldemichael B, Bekele D, Esmael A (2018) Cold Chain Status and Knowledge of Vaccine Providers at Primary Health Care of Units Bale Zone Southeast Ethiopia Cross-sectional Study. Immunome Res. 14: 2.
- Kitamura T, Bouakhasith V, Phounphenghack K, Pathammavong C, Xeuatvongsa A, et al. (2018) Assessment of temperatures in the vaccine cold chain in two provinces in Lao People’s Democratic Republic: A cross-sectional pilot study. BMC research notes 11: 261.
- Ogboghodo EO, Omuemu VO, Odijie O, Odaman OJ (2017) Cold chain management practices of health care workers in primary health care facilities in Southern Nigeria. Pan African Medical Journal.
- Trama A, Walker D, Fox-Rushby J (2005) Introducing hepatitis B virus vaccine into the Expanded Programme on Immunization in Bangladesh a proposed method to evaluate whether the existing infrastructure has the capacity. Journal of Health Population and Nutrition. 23: 25-33.
- Agueh V, Jerome C, Nyametso D, Paraiso M, Azandjemè C, et al (2016) Evaluation of the Performance of Expanded Immunization Programme Supply Chain and Logistics Management in Southern Benin Rural Health District. Universal Journal of Public Health 4: 160-170.
- Shah J, Agarwal M, Patel J, Trivedi A (2015) Quality assessment of immunization services: A cross sectional study at UHCs of Ahmedabad Municipal Corporation. Int J Health Sci Res 5: 21-25.
- Ogboghodo E, Omuemu V, Odijie O, Odaman O (2018) Cold chain management: An assessment of knowledge and attitude of health workers in primary health-care facilities in Edo State Nigeria. Sahel Med J 21: 75-82.
- Bagdey P, Narlawar U, KishorSurwase D, Dhage D, Adikane H (2017) A cross sectional study of assessment of vaccine wastage in tertiary care centre of central India. Int J Health Sci Res 7: 12-17.
- Sharma G, Sethia R, Acharya R, Meena R (2014) Assessment of vaccine wastage in the immunization clinic attached to SP Medical College Bikaner Rajasthan. International Journal of Community Medicine And Public Health 3: 675-688.
- WHO (1998) Safe vaccine handling cold chain and immunizations a manual for the newly independent states Fact sheet. Geneva Switzerland World Health Organization.
- WHO (2005) Vaccine management assessment. Geneva: World Health Organization.
- WHO (2008) Training for mid-level managers (MLM). Geneva: Switzerland: World Health Organization.
- WHO (2002) Vaccines and biological: Ensuring the quality of vaccines at country level, guideline for health staff. Geneva: Switzerland: World Health Organization..
- WHO (2005) WHO-UNICEF effective vaccine store management initiative modules 1-4 Geneva World Health Organization.
- FMOH (2013) Vaccine management training manual for EPI coordinators and focal persons. Addis Ababa: Ethiopia: Federal Ministry of Health.
- MoHFW (2016) Handbook for vaccine & cold chain handlers second edition Ministry of Health Family Welfare Government of India.
- Tiwari R, Shatkratu D, Piyush S, Mahore R, Tiwari S (2017) A study to assess vaccine wastage in an immunization clinic of tertiary care centre Gwalior Madhya Pradesh India. Int J Res Med Sci internet. 5: 2472-2476.
- Islam F, Pathak R, Roy S, Agarwalla R, Panda M, et al. (2018) Assessment of vaccine wastage in primary health care settings of South Delhl. International Journal of Scientific Research 7: 43-46.
- Usuf E, Mackenzie G, Ceesay L, Sowe D, Kampmann B, et al. (2018)Vaccine wastage in The Gambia: A prospective observational study. BMC public health 18: 864.
- Mehta S, Umrigar P, Patel P, Bansal R (2013) Evaluation of vaccine wastage in Surat. National Journal of Community Medicine 4: 15-19.
- Yang W, Parisi M, Lahue BJ, Uddin MJ, Bishai D (2014) The budget impact of controlling wastage with smaller vials a data driven model of session sizes in Bangladesh, India Uttar Pradesh Mozambique and Uganda. Vaccine 32: 6643-6648.
- Chinnakali P, Kulkarni V, Kalaiselvi S, Nongkynrih B (2012) Vaccine wastage assessment in a primary care setting in urban India. Journal of Pediatric Sciences 4: 1-6.
- FMOH (2010) Health Sector Development IV (HSDP IV /2010-2015) plan. Addis Ababa Ethiopia Federal Ministry of Health.
- WHO (2014) Principles and considerations for adding a vaccine to a national immunization programme: From decision to implementation and monitoring.
- Ameen H, Salaudeen A, Bolarinwa O, Uthman M, Musa O, et al. (2014) Vaccine Storage and Handling Practices among routine immunization service providers in a metropolitan city of North-Central Nigeria. Journal of Community Medicine and Primary Health Care 26: 18-28.
- FMOH (2015) Extended Program on Immunization (EPI) coverage in selected Ethiopian zones: A baseline survey for L10K’s Routine Immunization Improvement Initiative. Addis Ababa: Ethiopia. Federal Ministry of Health.
- Meleko A, Geremew M, Birhanu F (2017) Assessment of child immunization coverage and associated factors with full vaccination among children aged 12-23 months at Mizan Aman town bench Maji zone Southwest Ethiopia. International journal of paediatrics.
- Guichar S, Hymbaugh K, Burkholder B, Diorditsa S, Navarro C, et al. (2010) Vaccine wastage in Bangladesh. Vaccine 28: 858-863.
- Mukherjee A, Ahluwalia T, Gaur L, Mittal R, Kambo I, et al. (2004) Assessment of Vaccine Wastage during a Pulse Polio Immunization Programme in India. Journal of Health Population and Nutrition 22: 13-18.
- Rao S, Naftar S, Unnikrishnana B (2012) Evaluation, awareness, practice and management of cold chain at the primary health care centers in coastal South India. Journal of Nepal Paediatric Society 32: 19-22.
- CDC (2019) Vaccine Storage and Handling Toolkit. Atlanta US Department of Health and human Services, Center for Disease Control and Prevention.
- Brown VB, Oluwatosin OA, Ogundeji MO (2017) Impact of training intervention on immunization providers knowledge and practice of routine immunization in Ibadan, south-western Nigeria a primary health care experience. Pan African Medical Journal.
- Rogie B, Berhane Y, Bisrat F (2013) Assessment of cold chain status for immunization in central Ethiopia. Ethiop Med J 51: 21-29.
- Yassin ZJ, Nega HY, Derseh BT, Yehuala Y, Dad AF (2019). Knowledge of Health Professionals on Cold Chain Management and Associated Factors in Ezha District Gurage Zone Ethiopia. Scientifica 22.
- Dairo D, Osizimete O (2016) Factors affecting vaccine handling and storage practices among immunization service providers in Ibadan Oyo State Nigeria. African health sciences 16: 576-583.
- Akoh W, Ateudjieu J, Nouetchognou J, Yakum M, Nembot F, et al. (2016) The expanded program on immunization service delivery in the Dschang health district west region of Cameroon a cross sectional survey. BMC public health 16: 801.
- Mallik S, Mandal P, Chatterjee C, Ghosh P, Manna N, et al. (2011)Assessing cold chain status in a metro city of India: An intervention study. African health sciences 11: 128-133
- Azira B, Norhayati M, Norwati D (2014) Knowledge attitude and adherence to cold chain among general practitioners in Kelantan Malaysia. International Journal of Collaborative Research on Internal Medicine & Public Health 5:157.
Citation: Mohammed SA, Kahissay MH, Workneh BD (2022) Vaccine Wastage and Its Contributing Factors in Public Health Facilities, Ethiopia: Explanatory Sequential Mixed Method Design. J Community Med Public Health Care 9: 111.
Copyright: © 2022 Solomon Ahmed Mohammed, et al. This is an open-access article distributed under the terms of the Creative Commons Attribution License, which permits unrestricted use, distribution, and reproduction in any medium, provided the original author and source are credited.