Yield Stability of KDML105 Rice Introgression Lines, Developed Through Marker- Assisted Selection, Under Blast and Bacterial Blight Infection in Northeasthern Thailand
*Corresponding Author(s):
Jirawat SanitchonDepartment Of Agronomy, Faculty Of Agriculture, Khon Kaen University, Khon Kaen 40002, Thailand
Email:Jirawat@kku.ac.th
Jonaliza L. Siangliw
National Center For Genetic Engineering And Biotechnology (BIOTECH), National Science And Technology Development Agency(NSTDA), Thailand Science Park, Phahonyothin, Khlong Nueng, Khlong Luang, Pathum Thani 12120, Thailand
Email:jsiangliw@gmail.com
Abstract
Yield interaction of rice genotypes under different environments was found in this study. The experiment of this study was focused on yield adaptation of 14 KDML105 Introgression Lines (ILs) (developed by NSTDA of Thailand) compared with the original KDML105. Fourteen ILs containing different gene combinations of Bacterial Blight Resistance, Blast Resistance, Brown Planthopper resistance and submergence tolerance, were evaluated across three diverse locations of Northeastern Thailand, including Khon Kaen, Nong Khai, and Roi Et (totally 6 environments). The experiment was conducted in 2019 and 2020 during wet season and laid out in a randomized complete block (RCB) design with three replications. Grain yield and natural disease incidence related to traits of improvement were mainly considered in this study. Yield stability analysis indicated that there were four genotypes showing high yield stability including genotype 4 (RGDU03009-11-107-13-B), 6 (RGDU03012-218-19-7-B), 7 (RGDU03014-381-193-1-B), and 8 (RGDU03014-381-197-1-B). While, another four genotypes (1 (RGD00002-MS83-3-B4-49), 10 (RGDU03009-5-46-1-B), 12 (RGDU03028-MS109-MS9-MS4-36-B-B), and 14 (RGDURSC-6-14G08)) showed specific adaptation. Moreover, the results revealed that Bacterial Blight (BB) infection was the main factor affecting yield stability. Among specific adapted genotypes, three BB-resistant ILs, including 1, 12, and 14, were well adapted to severe BB infection environment. Therefore, these three genotypes could provide a new improved rice varieties for BB resistance in Northeastern Thailand. Additionally, these results suggest that BB resistance is a prerequisite for future rice breeding in northeastern Thailand.
Keywords
Biotic stress; Jasmine rice; Ooze; Rice disease; Xoo; Yield adoption.
Introduction
Khao Dawk Mali 105 (KDML105) is the most popular commercial jasmine rice cultivar produced and consumed in Thailand because of its rich high cooking quality, aroma and softness. The vast majority of jasmine rice KDML105 produced in Thailand is exported to world rice trading markets rivaled with large exporters such as India, Cambodia, and Vietnam (Thai rice exporters association, 2019). Unfortunately, the KDML105 is well adapted to the low soil fertility of the rainfed lowlands of Thailand especially Northeastern, it is very susceptible to various abiotic and biotic constraints, including flash flooding, drought, soil salinity, blast and Bacterial Blight (BB) diseases, the Brown Planthopper (BPH) and the White Back Planthopper [1,2].
Rice disease, blast, in rice crops is the most disastrous, causing 70-80% yield loss. This disease was originated in China around 7000 years ago [3]. Rice blast has become more difficult to control because of the pathogen’s ability to survive and multiply in harsh environmental conditions and easily spread to new fields [4, 5]. In Thailand, it's reported that blast affected approximately 69,139 ha of wet-season production area in northeast Thailand [6]. KDML105 was identified to be blast susceptible which compared with blast resistance varieties [7]. Flooding is one factor affecting rice growth and yield mostly in South and Southeast Asia especially India, Bangladesh, Thailand, Vietnam, Myanmar and Indonesia are exposed to flash flooding during rainy season [8]. Nearly 22 million hectares of rainfed lowland areas of South and Southeast Asia get affected due to flooding. Economic loss is estimated to be 1 billion US dollar [9]. Thailand rice production wet-season 2019 had 1.12 million ha that were affected by flooding [10] especially the KDML105 growing area. While KDML105 had low percentage of surviving seedling and percentage of seedling elongation after 12 days submerges condition with 100 cm. above [2]. Bacterial Blight (BB) is one of the most serious diseases in rice. The early disease occurrence symptom greatly effected growth and yield more than 40% [11]. Thai jasmine rice KDML105 in one variety is very susceptible to BB. In year 2005-2006 KDML105 and IR1188 (BB resistance variety carrying Xa21) were validated by artificial inoculation for BB resistance which was performed with the thirteen Xoo strains were collected around Thailand [12] similar with other reported KDML105 which is very susceptible to BB disease [13]. Brown Planthopper (BPH) infested on rice plants at maximum tiller stage have fewer panicles per unit area and fewer grains per panicle, while plants infested after the heading stage have lower percentages of ripened grain and gram weight. The heavily infested plants exhibit the characteristic symptom commonly referred to as hopperburn [14]. BPH infestion to KDML105 reported decide to susceptible which compared with BPH resistance rice improved lines [2].
Therefore, to enhance resistance and tolerance of KDML105 to biotic and abiotic stresses, introgressing multiple resistance genes into one genotype KDML105 improved version through marker assisted backcross selection (MABS) is necessary [15]. Previously, a few researchers have improved stress resistance and/or tolerance of KDML105 through MABS. Jairin [16] developed the KDML105 for Brown Planthopper resistance with grain quality characteristics, selected the elite lines and then evaluated yield and grain quality. Likewise, submergence tolerance [17,18] and Brown Planthopper resistance of KDML105 have also been improved by Korinsak [2], who selected the pyramiding lines to evaluate and characterize agronomic traits under field conditions in Northeast Thailand for selction the promising lines. However, these improved KDML105 varieties were not considerably accepted by farmers because the adaptability was probably not appropriate for farming practices.
To overcome this obstacle, the National Science and Technology Development Agency (NSTDA) of Thailand improved new generations of jasmine rice KDML105 introgression lines (ILs) for multiple disease resistance through MABS [2 and 15]. KDML105 ILs were intensely validated for gene expression and preliminaries selection for yield and agronomic traits. Moreover, the KDML105 ILs should be evaluated for field resistance, yield stability, and agronomic traits under field conditions in massive utilization areas in Northaest Thailand with multilocational yield trials. Evaluation environments for Genetic X Environment Interaction (GxE) needed to evaluate ILs on differing in soil properties, rainfall, rain distribution, and disease occurrence. Therefore, the objective of this study is to evaluate yield stability and yield response of rice KDML105 introgression lines (ILs) derived from MABS, compared to the original KDML105 under diverse environments with much higher frequency of biotic and abiotic stress which related to introgression genes in Northaest Thailand.
Materials and Methods
Plant Materials: The experimental material consisted of a standard check variety KDML105 and fourteen KDML105 Introgression Lines (ILs), which through from chromosome segmentation technique which gene pyramiding into KDML105 recurrent parent. Seven donor parents each carrying resistance genes for different traits, i.e., IRBB21 (Xa21) and IR62266 (xa5) for BB resistance, JHN (qBLch1&11) and P0489 (qBLch2&12) for blast resistance, Rathu and Abhaya (Bph6&12) for brown plant hopper resistance, and FR13A (SubqTLch9) for submergence tolerance. After crossing, marker-assisted selection (MAS) was utilized to identify and select the introgression lines that contain multiple resistance/tolerance genes. The ILs obtained resistance/ tolerance genes representing two, three, and four-trait combinations were designated, respectively. Core selection based on genotypes and phenotypes data was used to select perfectly fourteen ILs to evaluate yield stability compared with the original KDML105 totaling 15 genotypes were used for this experiment (Table 1).
|
Entry |
Pedigree |
Gene/QTLs |
Traits of improvement |
|||
|
|
|
|
BB resistance |
BPH resistance |
Blast resistance |
Submergence tolerance |
|
1 |
RGD00002-MS83-3-B4-49 |
SubQTLch9, Xa21 |
/ |
- |
- |
/ |
|
2 |
RGD00002-MS83-3-B4-88 |
SubQTLch9, Xa21 |
/ |
- |
- |
/ |
|
3 |
RGDU03009-11-107-9-B |
SubQTLch9, QTLBphch12 |
- |
/ |
- |
/ |
|
4 |
RGDU03009-11-107-13-B |
SubQTLch9, QTLBphch12 |
- |
/ |
- |
/ |
|
5 |
RGDU03009-4-38-B |
SubQTLch9, QTLBphch12 |
- |
/ |
- |
/ |
|
6 |
RGDU03012-218-19-7-B |
SubQTLch9, QTLBphch12 |
- |
/ |
- |
/ |
|
7 |
RGDU03014-381-193-1-B |
SubQTLch9, QTLBphch12 |
- |
/ |
- |
/ |
|
8 |
RGDU03014-381-197-1-B |
SubQTLch9, QTLBphch12 |
- |
/ |
- |
/ |
|
9 |
RGDU03014-381-197-2-B |
SubQTLch9, QTLBphch12 |
- |
/ |
- |
/ |
|
10 |
RGDU03009-5-46-1-B |
SubQTLch9, QTLBphch12 |
- |
/ |
- |
/ |
|
11 |
RGDU03028-MS109-MS9-MS4-35-B-B |
Xa21, QTLBphch6&12 |
/ |
/ |
- |
- |
|
12 |
RGDU03028-MS109-MS9-MS4-36-B-B |
Xa21, QTLBphch6&12 |
/ |
/ |
- |
- |
|
13 |
RGDU03029-MS721-M11-B-2-22 |
SubQTLch9, Xa21, QTLBphch6&12 |
/ |
/ |
- |
/ |
|
14 |
RGDURSC-6-14G08 |
SubQTLch9, Xa5&21, Bph3&4, QBL1&11 |
/ |
/ |
/ |
/ |
|
15 |
KDML105 |
- |
- |
- |
- |
- |
Table 1: Resistance gene combination of fourteen rice Introgression Lines (ILs) derived from marker assisted selection and standard check KDML105.
BB = Bacterial Blight, BPH = Brown Planthopper
Experimental Sites, Experimental Design and Field Management: The experiment was conducted under paddy field condition in 2019 and 2020 during wet season in main production sites of KDML105 in Northeastern Thailand. Three diverse locations, including Khon Kaen (16°45’10”N 102°37’58”) represented irrigated area, Nong Khai (17°51’0”N 102°35’6”E) represented slope rainfed area along Maekhong river, and Roi Et (15°36’33”N 103°48’1”E) represented dry and late-planting rainfed plain area and the biggest KDML105 production area [19], were selected for evaluating yield stability.
The experiment was laid out in Randomized Complete Block (RCB) design with three replications. The thirty-day seedlings were transplanted into field plot using three seedlings per hill. The size of the plots were held at 8 m2 (2 m x 4 m) with a row and hill spacing of 0.25 m and 0.25 m, respectively. Fertilizer applications were applied after 7 days tranplanting. Fertilizer formula 16-20-0 was used for clay soil at a rate of 50 kg ha–1:
62.5 kg ha–1: 0 kg ha–1 (N: P2O5: K2O) and 16-8-8 was used for sandy loam soil at a rate of 50 kg ha–1: 25 kg ha– 1: 25 kg ha–1 (N: P2O5: K2O) which applications were followed by the Department of Agriculture of Thailand. Field management, such as weed, insect, disease, and moisture condition, were controlled manually.
Data Collection: Data collection was recorded for agronomic traits, field disease occurrence cause by natural disease infection, yield and yield components, and climatic data which affected yield stability.
Agronomic traits were focused on plant type such as tiller number, plant height, panicle number, and day to flowering. Tiller number recorded was conducted at maximum tiller stage until before booting stage. Plant height and panicle number were recorded at permanent plant growth stage (marturity stage) measure from ground to plant tip. Day to flowering was recorded on each plot by counting the flowering hills from the start of flowering and again every two days until 50% of the plot which used for assign harvest day at 30 days after 50% flowering. Yield and yield components were recorded after harvest. Plot yield was sampling without border effect from 4 m2 (64 hills) per plot. The perfected grain with 14% seed moisture content were measured for grain yield. Harvest index was harvest 4 whole plants to measure biological yield and economic yield (HI = Biological yield/ Economic yield). 1,000 seed weight were sampling perfect seed from grain yield.
Climatic data was recorded for soil properties and rainfall. Soil properties measurement was analyzed before experiment when samples of each location were collected following soil sampling guidelines [20] to obtain soil properties data. And the rainfall during the experiment period used the manual rain gauge instate without shading for individual environments record at 7.00 am of the rainy days.
Field Disease Resistance evaluations used the severity scale of the Standard Evaluation System for rice (SES) [21, 22]. Disease evaluation was conducted when the symptom appeared, and continued every seven days. The disease resistance was scored for ten plants per plot and the average score was calculated. The highest severe score were used for analysis.
Statistical Analysis: Analysis of variances (ANOVA) of this experiment was performed using RCBD and combined analysis. A least significance different (LSD) at p < 0.05 [23] were done for mean comparisons using Stat10 software. The AMMI analysis (cluster dendrogram and GGE-biplot) for yield stability and yield response analysis were carried out used R software [24, 25].
Results
Grain Yield of Rice Introgression Lines at Various Environments: The combined analysis of variance across 6 environments for 15 genotypes showed that environment (E) and GxE interaction significantly (p < 0.01) affected the grain yield. While there was not a significant difference among the Genotypes (G). Additionally, the environment contributed to the biggest variation (SS) revealing the need for further analysis of stability (Table 2).
|
Source |
DF |
MS |
F |
|
Environment (E) |
5 |
11,960,000 |
21.80** |
|
Reps. within E |
12 |
548,719 |
|
|
Genotypes (G) |
14 |
228,611 |
0.92ns |
|
G x E interaction |
70 |
486,724 |
1.96** |
|
Pooled error |
168 |
248,012 |
|
|
Total |
269 |
|
|
Table 2: Combined analysis for rice grain yield of 15 genotypes evaluated in six environments
ns = not significant difference; * = significant at 95 %; ** = significant at 99 %, DF = degree of freedom, SS = sum of square, MS = mean square
Mean comparison of effective grain yield for individual environment caused by GxE interaction. The environments with higher mean yield were Khon Kaen 2019 (4,391 kg./ha) followed by Nong Khai 2020 (3,383 kg./ha), Nong Khai 2019 (3,328 kg./ha), Khon Kaen 2020 (3,282 kg./ha), Roi Et 2020 (3,015 kg./ha) and Roi Et 2019 (2,976 kg./ha) respectivly. The results showed that there were no significant differences in five environments including Khon Kaen 2019, Nong Khai 2019, Roi Et 2019, Khon Kaen 2020, and Roi Et 2020 but the other environment Nong Khai 2020 was significant at 95% confidence level (Table 3). Where focus on Nong Khai 2020 conditions, presenting as top three genotypes were higher-yielding than the standard check KDML105 including 1 (RGD00002-MS83-3-B4-49), 12 (RGDU03028-MS109-MS9-MS4-36-B-B), and 14 (RGDURSC-6-14G08). While other genotypes were not significant compared to KDML105 (Table 3). While, genotype 10 (RGDU03009-5-46-1-B) presented low yield at NK 2020 but the other five environments showed high yields. Other genotypes without above lines mostly not extremely yield value changed among locations.
|
Yield (kg/ ha) |
|||||||
|
Entry |
Line/ variety |
KK 2019 |
NK 2019 |
RE 2019 |
KK 2020 |
NK 2020 |
RE 2020 |
|
1 |
RGD00002-MS83-3-B4-49 |
4,073 |
3,591 |
2,910 |
3,272 |
4,408 a |
2,826 |
|
2 |
RGD00002-MS83-3-B4-88 |
4,563 |
3,343 |
2,615 |
3,168 |
3,533 a-d |
2,491 |
|
3 |
RGDU03009-11-107-9-B |
4,378 |
3,385 |
2,944 |
3,453 |
2,658 de |
3,181 |
|
4 |
RGDU03009-11-107-13-B |
4,784 |
3,351 |
3,399 |
3,196 |
3,006 cde |
2,938 |
|
5 |
RGDU03009-4-38-B |
4,645 |
3,088 |
2,552 |
3,039 |
2,727 cde |
2,702 |
|
6 |
RGDU03012-218-19-7-B |
4,436 |
3,940 |
2,746 |
3,137 |
3,177 cd |
3,553 |
|
7 |
RGDU03014-381-193-1-B |
4,662 |
3,263 |
2,927 |
3,411 |
3,122 cd |
3,138 |
|
8 |
RGDU03014-381-197-1-B |
4,174 |
3,223 |
2,773 |
3,424 |
3,255 bcd |
2,880 |
|
9 |
RGDU03014-381-197-2-B |
4,173 |
3,255 |
3,315 |
3,401 |
3,665 a-d |
3,069 |
|
10 |
RGDU03009-5-46-1-B |
4,734 |
4,094 |
3,549 |
3,466 |
2,067 e |
3,065 |
|
11 |
RGDU03028-MS109-MS9-MS4-35-B-B |
4,369 |
3,171 |
3,184 |
3,283 |
3,676 a-d |
3,320 |
|
12 |
RGDU03028-MS109-MS9-MS4-36-B-B |
4,302 |
3,319 |
2,486 |
3,188 |
4,296 ab |
3,209 |
|
13 |
RGDU03029-MS721-M11-B-2-22 |
4,197 |
3,070 |
3,560 |
3,084 |
3,708 abc |
2,949 |
|
14 |
RGDURSC-6-14G08 |
3,764 |
2,870 |
2,362 |
3,175 |
4,418 a |
3,038 |
|
15 |
KDML105 |
4,608 |
2,958 |
3,317 |
3,532 |
3,026 cde |
2,863 |
|
|
Mean |
4,391 |
3,328 |
2,976 |
3,282 |
3,383 |
3,015 |
|
|
F-test |
ns |
ns |
ns |
ns |
* |
ns |
|
|
C.V. (%) |
10.4 |
11.99 |
22.15 |
9.51 |
18.53 |
14.67 |
Table 3: Grain yield comparison of 15 rice genotypes evaluated across six environments
Ns = not significant difference; * = significant at 95 %, KK 2019 = Khon Kaen 2019, NK 2019 = Nong Khai 2019, RE 2019 = Roi Et 2019, KK 2020 = Khon Kaen 2020, NK 2020 = Nong Khai 2020, RE 2020 = Roi Et 2020
Environmental Characterizations: Environmental condition of six environments were different for altitude, soil texture, and rainfall. Altitudes were slightly different across six environments, where Khon Kaen was highest, followed by Nong Kai and Roi Et, respectively. In Khon Kaen and Roi Et, soil texture was sandy loam soil but Nong Khai was clay soil (Table 4). Rainfall distribution during experiment, there was a different pattern of rainfall between 2019 and 2020. The rain in 2020 (July-November) distributed wider than 2019 (July-September) as number of rainy days (NRD) and number of rainy weeks (NRW) in 2020 was higher than in 2019 (Figures 1 a-c and Table 2). Although the rain in 2020 distributed wider than in 2019, the total rainfall accumulative (TRC) of three individual environments in 2019 were unanimous higher than in 2020 (Figures 1 d-f). Similarly, the TRC/NRD and TRC/NRW ratios of the three locations in 2019 were higher than in 2020 (Figure 1 and Table 2). This result indicated that there was a heavy rain on short-distributed period in 2019, while the wide-distributed rainfall period was found in 2020.
|
|
Altitude (m.) |
Rainfall |
|||||
|
Environment |
NRD |
TRC/ NRW |
NRW |
TRC/ NRD |
TRC |
Soil texture |
|
|
Khon Kaen 2019 |
220 |
28 |
66.02 |
9 |
21.22 |
594.2 |
Sandy loam |
|
Nong Khai 2019 |
200 |
29 |
95.36 |
7 |
23.02 |
667.5 |
Clay |
|
Roi Et 2019 |
120 |
33 |
105.79 |
7 |
22.44 |
740.5 |
Sandy loam |
|
Khon Kaen 2020 |
220 |
41 |
35.79 |
14 |
12.22 |
501.1 |
Sandy loam |
|
Nong Khai 2020 |
200 |
34 |
57.25 |
11 |
18.52 |
629.7 |
Clay |
|
Roi Et 2020 |
120 |
33 |
51.14 |
12 |
18.60 |
613.7 |
Sandy loam |
Table 4: Environmental data (rainfall during experiments, altitude, and soil texture) of six evaluated environments.
NRD = Number of rainy day (days), NRW = Number of rainy week (weeks), TRC = Total rainfall cumulative (mm.)
Diseaes Occurrence Period of Blast and BB diseases was mostly born after the continuous rainfall and depended on local pathogens. Blast disease occurrence period much found for first symptom and follows by BB (Figures 1 d-f) cause of blast pathogen was ditribution by airborn and BB disease was distribution by waterborn. The 2019 environments (Figures 1 a-c) were low disease infection which only Khon Kaen 2019 (Figure 1 a) was found blast disease occurrence after high rainfall with low severity symptom. On the contrary 2020 (Figures 1 d- f) environments found both blast and BB disease symptoms. Blast disease was high severity at about tillering stage to PI (Figures 1 d-f). BB disease was high severity about maxmum tillering to before flowering stage (Figures 1 d-f).
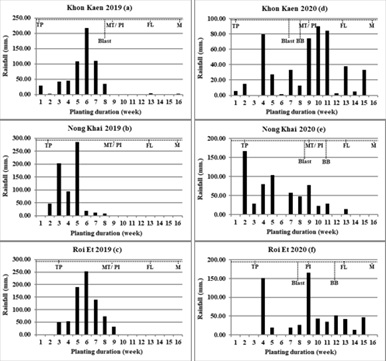
Figure 1: Rainfall (mm.) per week during experimaental planting of individual six environments including Khon Kaen 2019 (a), Nong Khai 2019 (b), Roi Et 2019 (c), Khon Kaen 2020 (d), Nong Khai 2020 (e), and Roi Et 2020 (f)
TP = Transplant, MT/ PI = Maximum tiller number/ Panicle primodia intiation, FL = Flowering, M = Maturity, Blast = Blast disease screening, BB = Bacterial blight disease screening
The environment characterization for grouping similar conditions into same groups and splitting the different environments into each group based on grain yield of genotypes interaction under each environments cause of the rice introgreesion lines were contained for various introgressed genes (Table 2).
Mean yield comparison showed highly significant difference ranging by higher mean yield in Khon Kaen 2019 followed by Nong Khai 2020, Nong Khai 2019, and Khon Kaen 2020 with the mean yield of 4,391 kg/ha, 3,383 kg/ha, 3,328 kg/ha, and 3,282 kg/ha, respectively. Meanwhile, the lower yield has two environments including Roi Et 2019 and Roi Et 2020 with the mean yield 2,976 kg/ha and 3,015 kg/ha, respectively (Table 5). In addition, environment characterization also focused on field disease resistance of those related with introgresses genes. Field disease resistance of this study observed disaese symptom affected by natural infection with local unknown disease isolates. In this study, blast and bacterial blight (BB) disease were found at experriment sites as the blast infection was found in four environments including Khon Kaen 2019, Khon Kaen 2020, Nong Khai 2020, and Roi Et 2020 with the maximum score ranging from 3.87 - 4.93. The severity of blast infection was highest at Khon Kaen 2020 (4.39). While BB infection was found in three environments of Khon Kaen 2020, Nong Khai 2020, and Roi Et 2020. The BB maximum score ranged from 2.89-6.60, in which Nong Khai 2020 showed the highest score (Table 5).
To summarize the enveironment characterization, Khon Kaen 2019 has higher grain yield condition with low disease infection, Khon Kaen 2020, Nong Khai 2019, Roi Et 2019 and Roi Et 2020 have ordinary condition with low disease infection, and Nong Khai 2020 has high grain yield deviation with severe bacterial blight infection.
|
|
|
Blast score |
BB score |
||
|
Environment |
Yield (kg./ ha) |
average |
maximum |
average |
maximum |
|
Khon Kaen 2019 |
4,391 a |
1.95 |
3.98 |
- |
- |
|
Nong Khai 2019 |
3,328 bc |
- |
- |
- |
- |
|
Roi Et 2019 |
2,976 d |
- |
- |
- |
- |
|
Khon Kaen 2020 |
3,282 bcd |
3.33 |
4.39 |
2.25 |
2.89 |
|
Nong Khai 2020 |
3,383 b |
2.04 |
3.93 |
4.68 |
6.60 |
|
Roi Et 2020 |
3,015 cd |
1.86 |
3.87 |
3.84 |
4.20 |
|
Mean |
3,396 |
|
|
|
|
|
CV (%) |
21.81 |
|
|
|
|
|
F-test |
** |
|
|
|
|
Table 5: Mean yield, average and maximum score of blast and BB of individual six environments
** = significant at 99 %
Yield Stability: Yield stability analysis is showing on GGE-biplot (Figure 2). The principal components explained 77.1% (PC1 = 63.3% and PC2 = 13.8%) of the total GGE variation. Yield stability of rice introgression lines were compared with KDML105 (15). KDML105 were found as the high stability genotype which close to the center of cross position. Likewise, three ILs, 4 (RGDU03009-11-107-13-B), 6 (RGDU03012-218-19-7-B), and 7 (RGDU03014-381-193-1-B). On the other hand, low stability ILs were found in 7 genotypes, 1 (RGD00002- MS83-3-B4-49), 2 (RGD00002-MS83-3-B4-88), 3 (RGDU03009-11-107-9-B), 4 (RGDU03009-11-107-13-B),
10 (RGDU03009-5-46-1-B), 12 (RGDU03028-MS109-MS9-MS4-36-B-B), and 14 (RGDURSC-6-14G08)
(Figure 2). Interestingly, the results also showed that some ILs were low stable but specifically adapted to some environments. Evidently, ILs 1 (RGD00002-MS83-3-B4-49), 12 (RGDU03028-MS109-MS9-MS4-36-B-B), and 14 (RGDURSC-6-14G08) specifically adapted to environment 5 Nong Khai 2020 with high yield but the yield was slightly low in other 5 environments, meanwhile, IL 10 (RGDU03009-5-46-1-B) adapted positively in environment Khon Kaen 2019, Nong Khai 2019, Roi Et 2019, Khon Kaen 2020, and Roi Et 2020 but negatively adapted in environment Nong Khai 2020 (Figure 2).
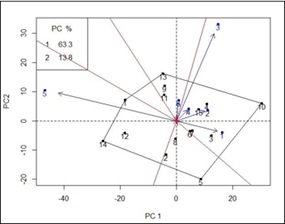 Figure 2: GGE-biplot for 15 rice genotypes evaluated across six environments.
The black numbers represent the genotypes (1-15). Each environment is indicated by a blue number and arrow (1-6). Environment number: 1 = Khon Kaen 2019, 2 = Nong Khai 2019,
3 = Roi Et 2019, 4 = Khon Kaen 2020, 5 = Nong Khai 2020, 6 = Roi Et 2020
Field Disease Resistance of the Introgression Lines: The field disease resistance of KDML105 introgression lines were evaluated in all environments with special focus on disease were related with introgressed genes. Rice disease of this experiment was found in two disease blast and bacterial blight in environments four and three respectively. Blast disease infection showing hihert severity at moderately (< 5 score) which blast symptom could classified the blast resistance ILs number 14 to show satisfying gene expression with low disease score at all observed sites. And BB disease infection at three sites showing highest severity at Nong Khai 2020 with maximum score 6.60 which classified the BB resistance ILs number 1, 2, 10, 11, 12, and 14 to show satisfying genes expression with lower scores than KDML105 and others ILs without BB resistance genes. In addition, BB disease infection at Nong Khai 2020 is showing most negative corelation for each grain yield (Table 6).
|
|
Blast and BB Gene/QTLs |
Blast disease score |
|
|
BB disease score |
|||
|
Entry |
KK 2019 |
KK 2020 |
NK 2020 |
RE 2020 |
KK 2020 |
NK 2020 |
RE 2020 |
|
|
1 |
Xa21 |
1.63 efg |
3.20 bcd |
1.13 g |
1.87 b-e |
2.24 a-e |
2.60 e |
3.67 a |
|
2 |
Xa21 |
1.86 def |
3.57 abc |
1.47 d-g |
1.40 def |
2.27 a-d |
2.60 e |
3.80 a |
|
3 |
Xa21 |
2.91 b |
3.22 bcd |
3.93 a |
2.73 abc |
2.27 a-d |
6.20 a |
3.80 a |
|
4 |
- |
2.23 cd |
3.45 bcd |
2.47 b-e |
3.00 ab |
2.84 a |
6.60 a |
3.93 a |
|
5 |
- |
2.63 bc |
3.34 bcd |
2.33 c-f |
2.87 ab |
2.56 abc |
6.60 a |
4.20 a |
|
6 |
- |
1.16 gh |
3.08 b-e |
1.02 g |
1.17 def |
1.73 c-e |
3.67 cde |
4.07 a |
|
7 |
- |
1.32 fgh |
2.55 de |
1.23 fg |
1.17 def |
1.64 de |
6.20 a |
4.07 a |
|
8 |
- |
1.14 gh |
2.73 cde |
1.87 c-g |
0.63 ef |
2.23 a-e |
4.87 bc |
3.80 a |
|
9 |
- |
1.18 gh |
3.39 bcd |
1.30 e-g |
1.40 def |
1.93 b-e |
4.60 bc |
3.67 a |
|
10 |
- |
2.52 bc |
3.73 ab |
3.60 ab |
2.80 abc |
2.89 a |
5.67 ab |
3.93 a |
|
11 |
Xa21 |
1.90 de |
3.85 ab |
1.52 d-g |
1.93 bcd |
2. 26 a-d |
3.27 de |
3.67 a |
|
12 |
Xa21 |
1.55 efg |
3.49 abc |
2.50 bcd |
1.03 def |
2.31 a-d |
3.67 cde |
3.93 a |
|
13 |
Xa21 |
2.33 cd |
4.39 a |
2.02 c-g |
1.53 c-f |
2.42 a-d |
4.47 bcd |
4.07 a |
|
14 |
QBL1&11, xa5&21 |
0.96 h |
2.22 e |
1.15 fg |
0.50 f |
1.41 e |
2.73 e |
2.87 b |
|
15 (KDML105) |
|
3.98 a |
3.70 ab |
3.00 abc |
3.87 a |
2.71 ab |
6.47 a |
4.20 a |
|
Mean |
|
1.95 |
3.33 |
2.04 |
1.86 |
2.25 |
4.68 |
3.84 |
|
F-test |
|
** |
** |
** |
** |
* |
** |
* |
|
C.V.% |
|
17.39 |
16.72 |
34.83 |
41.3 |
22.28 |
15.99 |
9.07 |
Table 6: Blast and bacterial blight scores of 15 rice genotypes.
*= significant at 95 %, ** = significant at 99 %, KK 2019 = Khon Kaen 2019, KK 2020 = Khon Kaen 2020, NK 2020 = Nong Khai 2020, RE 2020 = Roi Et 2020
Yield Response of Bb-Resistant Ils to Severe BB Environments: To evaluate yield response of genotypes under different environment, cluster analysis was applied to group environments. The test environments were divided into three groups, E1, E2 and E3, based on yield. E1 and E2 groups included one environment, which was KK 2019 and NK 2020, respectively. While the other four environments including NK 2019, RE 2019, KK 2020, and RE 2020 were grouped into E3 (Figure 3). For genotypes grouping based on BB-resistant genes contained (Table 1), the genotypes were also divided into three groups (G1, Xa21; G2, Xa21 + xa5; and G3, non BB-resistant gene) to compare with KDML105 (totalling four genotype groups) (Figure 3).
 Figure 3: Cluster dendrogram of 6 environments based on yield
Environment: KK 2019 = Khon Kaen 2019, NK 2019 = Nong Khai 2019, RE 2019 = Roi Et 2019, KK 2020 = Khon Kaen 2020,NK 2020= Nong Khai 2020, and RE 2020 = Roi Et 2020 Environment group: E1 = environment group 1, E2 = environment group 2, E3= environment group 3
The results of yield response showed that four-genotype groups containing different BB-resistant genes displayed difference in expression across three environment groups. In environment E1 and E3, grain yield of rice genotypes were not significant. However, based on the mean yield of each group, KDML105 was the highest yielding genotype, followed by non BB-resistant ILs, Xa21 ILs, and Xa21+xa5 ILs, respectively, in environment E1. While, in environment E3, the maximum yield was lower than environment E1 and E2, which non BB-resistant ILs and KDML105 showed the highest yield, followed by Xa21 ILs and Xa21+xa5 ILs, respectively. In contrast, there was a significant difference for grain yield among genotype groups in environment E2. Among genotype groups, Xa21+xa5 ILs was highest-yielding group, followed by Xa21 ILs, KDML105 and non BB-resistant ILs, respectively. Under condition E2 include NK2020 which BB severe occurrence, the BB resistance rice ILs were high yielding more than non BB resistance genotypes (Figure 4).
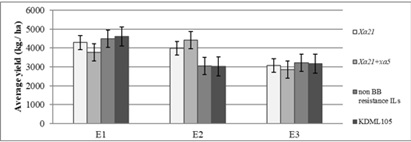 Figure 4: Average yield of rice genotype based on BB-resistant group responding to three environment groups.
Agronomic Traits of Rice Introgression Lines: Agronomic traits of rice 15 genotypes were derived from combined analysis. Analysis among lines were highly significant (p < 0.01) for day to flowering (DTF), plant height (PH), tiller number (TN), panicle number (PN), and 1,000 seed weight (SW) meanwhile harvest index (HI) was significant (p < 0.05). Day to flowering of mostly ILs were nearby KDML105 excluding number 13 was seven days later and number 14 is only one ILs earlier than KDML105. Plant height of all genotypes were divided into high plant type (>130 cm.) (IRRI, 2013). Plant height of ILs mostly were nearby KDML105 as number 2, 3, 4, 5, 6, 7, and 8 excepted number 11, 12, and 14 were shorter than KDML105 and number 1, 9, 10, and 13 were higher than KDML105. Tiller number of rice ILs number 11 and 12 were higher and others ILs were not inferior with KDML105. Panicle number of rice ILs number 11 and 12 were higher and others ILs mostly were not inferior with KDML105 but number 2 and 9 were lower than KDML105. Harvest index among genotypes were almost inferior with KDML105 excluding 5 ILs as number 1, 2, 5, 8, and 13 were lower harvest index. Seed weight of 1,000 seeds among genotypes showing 4 lines viz number 1, 2, 6, and 7 were higher seed weight and 2 ILs viz number 12, 13 were lower than KDML105, meanwhile others 8 ILs were nearby KDML105 (Table 7).
|
Entry |
DTF |
PH (cm.) |
TN |
PN |
HI |
SW |
|
1 |
107.4 def |
162 ab |
9.9 e-h |
9.7 def |
0.34 cde |
29.5 a |
|
2 |
106.8 ghi |
157 cd |
9.8 gh |
9.4 ef |
0.33 cde |
29.4 a |
|
3 |
107.4 def |
159 bcd |
10.3 d-g |
10.2 cde |
0.35 a-e |
27.2 bcd |
|
4 |
106.7 hi |
159 bcd |
10.6 c-f |
10.1 cde |
0.35 a-e |
26.9 cde |
|
5 |
107.3 efg |
157 cd |
10.7 cde |
10.2 cd |
0.33 cde |
26.1 efg |
|
6 |
109.9 b |
158 bcd |
10.7 cd |
10.3 cd |
0.35 a-d |
27.9 b |
|
7 |
106.2 j |
157 d |
10.5 c-g |
9.8 def |
0.34 a-e |
26.5 def |
|
8 |
107.8 de |
160 bcd |
10.0 d-h |
9.6 def |
0.33 de |
26.9 cd |
|
9 |
107.1 fgh |
161 abc |
9.5 h |
9.2 f |
0.34 b-e |
26.9 cd |
|
10 |
107.4 def |
161 abc |
11.1 bc |
10.7 bc |
0.36 abc |
27.5 bc |
|
11 |
107.9 d |
147 e |
11.8 ab |
11.4 ab |
0.37 a |
25.9 fgh |
|
12 |
108.5 c |
145 e |
11.9 a |
11.6 a |
0.35 a-d |
25.7 gh |
|
13 |
114.1 a |
165 a |
10.6 c-f |
10.2 cde |
0.33 e |
25.1 h |
|
14 |
104.4 k |
145 e |
9.9 fgh |
9.6 def |
0.34 b-e |
27.0 cd |
|
15 (KDML105) |
106.5 ij |
156 d |
10.5 c-g |
10.3 cd |
0.36 ab |
26.6 def |
|
F-test |
** |
** |
** |
** |
* |
** |
|
Grand Mean |
107.7 |
156 |
10.5 |
10.1 |
0.34 |
27.0 |
Table 7: Agronomic traits of of 15 rice genotypes combined across 6 environments
ns = not significant difference; * = significant at 95 %; ** = significant at 99 %, DTF = Days to 50% flowering, PH = Plant height, TN = Tiller number, PN = Panicle number, HI = Harvest index, SW = 1,000 Seeds weight
However, the rice selection for utilization in Northeastern Thailand under rainfed area much consider on flowering date that must not later than KDML105 cause of water management at maturity stage. Plant height is not to higher than KDML105 cause of risk early stage lodging (before grain filling) which affects crop photosynthesis and grain yield. Other traits about yield components such as tiller number, seed weight and HI much selction the lines not inferrior with KDML105.
Discussion
Yield Adaptation of Rice Introgression Lines (ILs): Yield stability of rice ILs carrying different genes combination (Table 1) was exclusively considered based on stability, mean yield and specific adaptation. According to our yield stability analysis results, yield stability were not significant for five environments, except for environment NK20 which variation in yield stability of ILs were observed (significant at p < 0.05) (Table 3). Variation in yield stability for environment Nong Khai 2020 was possibly caused by BB infection, which directly damaged rice grain yield [11]. These similar to Ansari [26] were estimated rice yield loss caused by bacterial blight. These study found severity effect on grain yield with the BB infection started at maximum tiller stage until Flowering Growt Stage (Table 6).
Based on stability analysis results, stability of high stable ILs, mostly non BB-resistant gene ILs, i.e., IL 4 (RGDU03009-11-107-13-B), 6 (RGDU03012-218-19-7-B), and 7 (RGDU03014-381-193-1-B) were close to a recurrent parent KDML105 as yield stability was not damaged [27]. In contrast, yield stability under high severe BB condition, the BB resistent ILs could differ in stability expression with recurrent parent and others BB susceptible varieties [28]. We found that four BB-resistant ILs (1, 10, 12, and 14) was low stable for yield, which was contrary with its recurrent parent KDML105. Nevertheless, these four ILs extremely adapted to particular environment (specific adaptation). Genotype 1, 12, and 14 carried BB-resistant gene Xa21 and/or xa5 were highest-yielding genotypes under severe BB infection environment (NK20). On the other hand, genotype 10 performed poor at severe BB infection environment (NK20) but was highest-yielding genotypes adapted to non-BB infection environments (KK19, NK19, RE19, KK20, and RE20) (Table 5). To solve the problem of genotype 10 needing to introgression BB resistance genes.
Yield Performance of Rice BB-Resistant Xa21 And Xa5 Genes Introgression Lines (Ils): In the present study, the different yield performance of four rice genotype groups, divided based on BB-resistant gene contained, across three environment groups (E1, E2 and E3) were found (Figure 4). At minimal BB infection environments, E1 and E3 were high- and low-yielding environments, respectively. Among the genotype groups evaluated in these two environments, KDML105 and non BB resistant ILs showing high mean yielding genotype groups, which were higher than Xa21 ILs and Xa21+xa5 ILs. However, the yields were not statistically different among groups (Figure 4). Whereas, at severe BB infection environment E2, a highly yield significant difference for genotype groups were archived, in which the yield of Xa21+xa5 ILs and Xa21 ILs were higher than KDML105 and non BB-resistant ILs (Figure 4, Table 3), [29]. The result resembling Ansari [11] were studied for yield loss asessesment of rice due to bacterial blight compared among resistance and susceptible variety at different growth stages with highest yield loss 47.4 % appeared in susceptible variety but resistance variety presented maximum yield loss 16.2 %. The result also reported by Reddy [30] BB disease infection could reduced the rice yield with high severity when early inoculation caused by less panicle fertilization which were affected by plant leaves photosynthesis reduced by BB severity index on source leaf [31]. Under severe BB occurent area as Nong Khai, rice variety containing BB resistance genes Xa21+xa5 or at least Xa21 should be practiced. In ordinary condition such as Khon Kaen and Roi Et environments those without severe disease occurrence should use the lines showing high yield, yield stability and greater agronomic traits when compare with KDML105.
Disease Resistance of Kdml105 Introgression Lines (Ils) Under Field Condition: Evaluation the disease resistance of ILs. The ILs were evaluated in six different environments that have been reported for the stresses related to gene introgressed. In this study, two stresses, blast and bacterial blight (BB) diseases were found. Interestingly, disease infection was mostly observed in 2020 which the rain distributed widely (Figure 1). In contrast, short rainfall distribution was observed in 2019, almost finished in September (Figure 1). Widely rainfall distribution was previously reported to be related to high relative humidity [32], which is the favorable condition for infection, growth and distribution of blast and BB [33] during vegetative to reproductive phases [11]. Moreover, Khan [33] have demonstrated that the rainfall positively correlated with severity of blast disease in five rice varieties. In addition, field management especially plant spacing also affected blast disease severity. This studied was low blast disease severity cause of conducted planting methods for hill and row spacing which lower leaf blast severity than broadcasted direct seeding [34]. Likewise, BB is waterborne disease distributed along with water [35] and damaged in the watering condition. Contrary, the short rainfall distribution likely leads to minimal disease severity.
According to disease observation results in the observed area, the opportunities of disease incidence caused by natural infection for blast was found in 4 from 6 environments forecast about 66.6 % and BB infected was found in 3 from 6 environments (Table 6). Blast disease infected found in 4 environments included 1 environment in 2019 and 3 environments in 2020 (Table 6), where the severity was minimal. Although blast severity was minimal, it could classify blast resistant ILs in this study. Among ILs evaluated, IL 14 (RGDURSC-6-14G08) is the one containing qBl1,11 blast resistance genes which showed effective gene expression with lower blast score (Table 6), these results were similar to the report of Vannavichit [15] has improved KDML105 by genes pyramiding which the improved lines were highly blast resistance more than original KDML105. While BB infection was more severe with the highest of score 6.60 at NK20 (Table 5), followed by RE20 and KK20, respectively. At NK20, the ILs contained BB-resistant gene Xa21 or xa5+Xa21 (ILs 1, 2, 11, 12 and 14) showed effective gene expression with lower score (Table 6). Of which, some ILs, such as 1, 12 and 14, could also maintain high grain yield. This is in accordance with the previous report of Singh [29] and Pradhan [36] which stated that the resistant level of rice pyramiding lines harboring multiple BB-resistant genes Xa21+xa13+xa5 was higher than those carried the genes combination of Xa21+xa13 and Xa21+xa5, xa13+xa5 and control variety (most susceptible), respectively.
In addition, to utilized these results, a suitable test environment for selecting superior genotype under blast and BB infection should be identified in this study. For BB screening, Nong Khai was suggested as the best environment as severe BB infection (Table 6). Whereas, Khon Kaen was suggested as the best environment for field blast screening because there was a blast infection in both two year experiments. Beside Khon Kaen, Nong Khai and Roi Et were also proposed to be suitable environments for field blast screening as only 1 of 2 environments were found for blast disease (Table 5).
Agronomic Traits Perfpormance of Rice Introgression Lines: Plant type of rice ILs through backcrossing methods mostly were similar to recurrence parent. Moreover, not a hundred percentage similarity cause of plant phenotype based on genes allell. Actually, after crossing of homodominace and homorecessive gene were expression on F2 generation were various. These ILs selection based on resistance trait by MABS was not selection for all agronomic traits. This result were similar to the study of Yamada [37], Rice Pyramiding Lines BC2F3 were developed for BB disease resistance and seletion by MAS. The selected ILs were used and compare with recurence parent and some donors parent under greenhouse and field condition in Nagoya, Japan. The result showed BB resistance actions of ILs not completely similar with recurenet parent. In addition, Agronomic traits of individual ILs showing some trait was follows recurent parent and other similar to donor parent.
Conclusion
Combined analysis revealed a significant difference (p < 0.01) for environment and G x E interaction (genotype was not significant). By applying the GGE biplot method for yield stability analysis, we successfully selected rice introgression lines (ILs) for two ideal types, high stability and specific adaptation, under BB and blast infection environments. Three rice ILs-genotype 4 (RGDU03009-11-107-13-B); 6 (RGDU03012-218-19- 7-B); and 7 (RGDU03014-381-193-1-B) were selected as high stable genotypes nearby its recurrent parent KDML105 (genotype no. 15). While another four rice ILs (1, 10, 12, and 14) were selected for specific-adapted type, which genotype 1, 12, and 14 were higher yield in severe BB infection environments, and genotype 10 seemed to be rather well adapted in non-BB infection environments. Moreover, Nong Khai and Khon Kaen were considered as the suitable test environments for IL selecting under BB and blast infection, respectively. Although BB disease was the main factor affecting yield stability in this study, further stability evaluation of these ILs under others stress related to the genes contained should be conducted in the future.
Acknowledgments
This research was supported by the Plant Breeding Research Centre for Sustainable Agriculture, Khon Kaen University, Khon Kaen, Thailand. We wish to express our thanks to Thailand Graduate Institute of Science and Technology (TGIST) for studies scholarship (Contract no. SCA-CO-2562-9717-TH). We are also thankful to the project "Breeding by Design to Improve Rainfed Rice Varieties for Resistance and Tolerance to Biotic and Abiotic stresses Using a Marker-Assisted Selection Approach" with project code P1950205 funded by Innovation for Sustainable Agriculture (ISA), NSTDA.
References
- Jairin J, Toojinda T, Tragoonrung S, Tayapat S, Vanavichit A (2005) Multiple genes determining brown planthopper (Nilaparvata lugens stal) resistance in backcross introgressed lines of Thai Jasmine rice ‘KDML105’. ScienceAsia 31: 129-135.
- Korinsak S, Siangliw M, Kotcharerk J, Jairin J, Siangliw JL, et al. (2016) Improve of the submergence tolerance and the brown planthopper resistance of the thai jasmine rice cultivar KDML105 by pyramiding Sub1 and Qbph12. Field crops research 188: 105-
- Simkhada K, Thapa R (2021) Rice blast, A major threat to the rice production and its various management techniques. Turkish Journal of Agriculture - Food Science and Technology 10: 147-157.
- Araujo LGD, Prabhu AS, Freire ADB (2000) Development of blast resistant somaclones of the upland rice cultivar araguaia. Pesqui 35: 357-367.
- Meybeck A (2012) Building resilience for adaptation to climate change in the agriculture FAO/OECD, Italy 23-24.
- Rice department of Thailand (2020) Blast Rice knowledge bank. Division of rice research and development. Rice department of Thailand, Thailand.
- Salih A, Sreewongchai T, Sripichitt P, Parinthawong N (2013) Identification of blast-resistant varieties from landrace, improved and wild species of rice. Agriculture and Natural Resources 47: 1-7.
- Sarkar RK, Reddy JN, Sharma SG, Ismail AM (2006) Physiological basis of submergence tolerance in rice and implications for crop improvement. Current Science 91: 899-906.
- Mackill DJ, Ismail AM, Singh US, Labios RV, Paris TR (2012) Development and rapid adoption of submergence-tolerant (Sub1) rice Advances in agronomy 115: 299-352.
- Rice department of Thailand (2020) Rice knowledge Division of rice research and development. Thailand.
- Ansari TH, Ahmed M, Ara A, Khan MAIK, Mian MS, et al. (2018) Yield loss assessment of rice due bacterial blight at different resistance Bangladesh Journal of plant pathol 34: 71-76.
- Win KM, Korinsak S, Jantaboon J, Siangliw M, Lanceras SJ, et al. (2012) Breeding the Thai jasmine rice variety KDML105 for non-age-related broad-spectrum resistance to bacterial blight disease based on combined marker-assisted and phenotypic selection. Field Crops Research 137: 186-194.
- Chumpol A, Chankaew S, Saepaisan S, Monkham T, Sanitchon J (2018) New sources of rice blast resistance obtained from Thai indigenous upland rice germplasm. Euphytica 214:
- Sogawa K, Cheng CH (1979) Economic thresholds, nature of damage, and losses caused by the brown planthopper. Brown Threat to rice production in Asia 125-142.
- Vanavichit A, Kamolsukyeunyong W, Siangliw M, Siangliw JL, Traprab S, et al. (2018) Thai Hom Mali Rice: Origin and breeding for subsistence rainfed lowland rice Rice 11.
- Jairin J, Teangdeerith S, Leelagud P, Kothcharerk J, Yi M, et al. (2009) Development of rice introgression lines with brown planthopper resistance and KDML105 grain quality characteristics through marker-assisted selection. Field Crops Research 110: 263-271.
- Siangliw M, Toojinda T, Tragoonrung S, Vanavichit A (2003) Thai Jasmine rice carrying QTLCh9 (Sub QTL) is submergence tolerant. Annals of Botany 91: 255-261.
- Toojinda T, Siangliw M, Tragoonrung S, Vanavichit A (2003) Molecular genetics of submergence tolerance in rice: QTL analysis of key traits. Annals of Botany 91: 243-253.
- Kong NK, Buaphan T, Tulaphitak D, Phuvongpha N, Wongpakonkul S, et al. (2011) Yield, yield components, soil minerals and aroma of KDML105 rice in Tungkularonghai, Roi-Et, Thailand. World Academy of Science, Engineering and Technology 52.
- Jason PA (2018) Soil Sampling Purdue Extension 1-6.
- International rice research institute (IRRI) (2013) Standard evaluation system for rice (SES) 5th International Rice Research Institute, Philippines.
- Banerjee A, Roya S, Bag MK, Bhagat S, Kar MK, et al. (2018) A survey of bacterial blight (Xanthomonas oryzae pv. oryzae) resistance in rice germplasm from eastern and northeastern India using molecular markers. Crop protection 112: 168-176.
- Gomez KA, Gomez AA (1984) Statistical Procedures for Agricultural John Wiley and Sons. New York, USA.
- Onofi A, Ciricfolo E (2007) Using R to perform the AMMI analysis on agriculture variety R Project for Statistical Computing 7.
- R Development Core Team (2012) R: A language and environment for statistical R foundation for statistical computing, Austria.
- Ansari TH, Ahmed M, Akter S, Mian MS, Latif MA, et al. (2019) Estimate of rice yield loss using a simple linear regression model for bacterial blight Bangladesh Rice Journal 23: 73-79.
- Balakrishnan D, Subrahmanyam D, Badri J, Raju AK, Rao YV, et al. (2016) Genotype × Environment interactions of yield traits in backcross introgression lines derived from Oryza sativa Swarna/Oryza nivara. Front. Plant Sci 7:1530.
- Živanovic T, Vracarevic M, Krstanovic S, Šurlan MG (2004) Selection on uniformity and yield stability in maize. Agricultural Sciences 49: 117-130.
- Singh S, Sidhu JS, Huang N, Vikal Y, Li Z, et al. (2001) Pyramiding three bacterial blight resistance genes (xa5, xa13 and Xa21) using marker-assisted selection into indica rice cultivar PR106. Theoretical and applied genetics 102: 1011-1015.
- Reddy APK, Mackenzie DR, Rouse DI, Roa AV (1979) Relationship of bacterial leaf blight severity to grain yield of rice. Disease detection and losses 69: 967-969.
- Elings A, Rossing WAH, Van WDW (1999) Virtual lesion extension: A measure to quantify the effects of bacterial blight on rice leaf CO2 exchange. Phytopathology 89: 789-795.
- Eyo JE, Onah IE, Ubachukwu PO, Ivoke N, Ekeh FN (2014) Effects of climatic conditions on the biting density and relative abundance of simuliumdamnosum complex in a rural nigerian farm settlement. Annals of Agricultural and Environmental Medicine 21: 699-702.
- Khan SMA, Khan NA, Mahmood Y (2011) Effect of epidemiological factors on the incidence of paddy blast (Pyricularia oryzae) disease. Pakistan Journal of Phytopathology 23: 108-111.
- Nugroho C, Raharjo D, Mustaha MA, Asaad M (2021) Assessing disease severity of rice blast under different rates of nitrogen fertilizer and planting system. EDP Science 306: 1-10.
- Huang JS, Cleene DM (1988) How rice plants are infected by Xanthomonas campestris Oryzae. Bacterial blight of rice 31-42.
- Pradhan KC, Barik SR, Mohapatra S, Nayak DK, Pandit E, et al. (2022) Incorparation of two bacterial blight resistance genes into the popular rice variety, ranidhan through marker-assisted Agriculture 12: 1289.
- Yamada S, Kurokawa Y, Nagai K, Angeles SRB, Yasui H, et al. (2020) Evaluation of backcrossed pyramiding lines of the yield-related gene and the bacterial leaf blight resistant genes. Journal of international cooperation for agricultural development 18: 18-28.
Citation: Jirawat S, Jirapong Y, Jonaliza LS, Tidarat M, Sompong C, et al. (2023) Yield Stability of KDML105 Rice Introgression Lines, Developed Through Marker- Assisted Selection, Under Blast and Bacterial Blight Infection in Northeasthern Thailand. J Agron Agri Sci 6: 053
Copyright: © 2023 Jirapong Yangklang, et al. This is an open-access article distributed under the terms of the Creative Commons Attribution License, which permits unrestricted use, distribution, and reproduction in any medium, provided the original author and source are credited.