The Predictive Value of the Central Eight Criminogenic Risk Factors: A Multi-Group Comparison of Dually Diagnosed Violent Offenders with other Subgroups of Violent Offenders
Abstract
Keywords
INTRODUCTION
The General Personality and Cognitive Social Learning (GPCSL) theory is a general theory of the onset and sustained criminal behavior [16]. In the GPCSL, specific criminogenic variables within the individual and his/her social learning environment are described that set this theory apart from mainstream criminological theories and clinical perspectives of criminal behaviour. For instance, the traditional clinical variables of anxiety, depression, mood, and major psychotic symptoms, are salient from a clinical perspective of criminal behaviour, however, in GPCSL, such variables are regarded as minor risk factors. A meta-analytic study conducted by Bonta, Blais, and Wilson [17] confirmed that, with the exception of antisocial personality, the clinical variables were not predictive of recidivism.
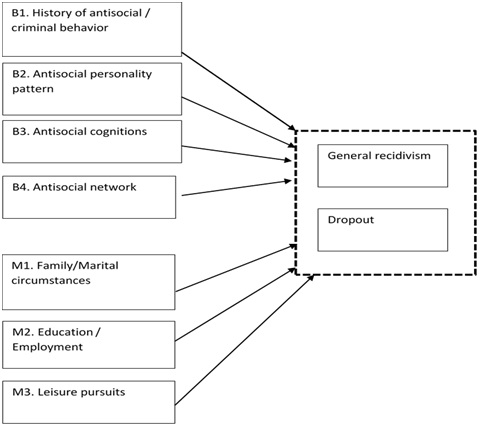
GPCSL recognizes that there are many routes to crime but some experiences in life are more influential than others. For example, the lack of employment, poor use of leisure time, substance abuse and having a criminal social network have a far greater impact on the likelihood of criminal behaviour relative to one’s socioeconomic conditions. Such situations limit exposure to rewards for prosocial behaviour and also diminish punishment for rule violating behaviour. The GPCSL theoretical perspective views the following predominantly individual variables as major determinants of criminality: History of antisocial/criminal behavior, Antisocial Personality Pattern, Antisocial Cognitions, and Antisocial network. They are referred to as the big four criminogenic risk factors and are assumed to facilitate the commission of a criminal act. Within GPCSL, another set of predominantly contextual domains are described as relevant in the development of criminal behaviour. These are: Education/Employment, Family/Marital, Substance Abuse, and Leisure pursuits and are referred as the moderate four criminogenic risk factors. Together, the big and moderate four criminogenic risk factors go under the name central eight criminogenic risk factors.
A number of meta-analytic reviews have found evidence for the predictive validity of the central eight criminogenic factors and for the primacy of the big four over the moderate four risk factors among general offenders [18-20]. Moreover, the central eight risk factors were found relevant across age [21,22] gender [23-25] ethnic groups [26] and offender types [27,28]. Although the evidence supports the central eight risk factors as being applicable to a range of offenders, results are inconsistent with regard to the primacy of the big four over the moderate four risk factors among these offender subgroups. Further research is needed to strengthen the applicability of the central eight to other offender subgroups in general and to find support for the greater importance of the big four criminogenic factors over the moderate four in particular to reduce the risk of reoffending through treatment [17].
One of the most influential models in guiding treatment interventions with offenders is the Risk-Need-Responsivity (RNR) model [29,30]. Of the 15 principles currently represented in the model [16], three of them have been at the core since 1990. These are: Risk-principle that specify that the intensity and duration of the treatment should match the offender’s risk of re-offending; need-principle dictates that treatment should target the dynamic (changeable) criminogenic risk factors; responsivity-principle that describes that treatment should be responsive to specific offender’s abilities (e.g., intellectual capacities and motivation) to maximize treatment engagement. In their most recent review Andrews and Bonta [16] found that non adherence to these principles was associated with a small increase in recidivism (r=-0.02), whereas larger decreases were observed with increased adherence to the RNR-principles (two principles, r=0.18; three principles, r=0.26). Since the main objective of forensic treatment is to minimize the risk of reoffending, it is of particular importance to investigate which central eight criminogenic risk factors play a significant role in recidivism among subgroups of violent offenders.
AIMS OF THE PRESENT STUDY
METHODS
Sample and study protocol
At intake, patients are informed by the therapist about the data collection from electronic patient files, questionnaires, and risk assessments during their treatment, as well as how these data will be used for scientific purposes and to match their treatment to their individual problems. Patients also receive a flyer detailing the data collection procedure and patients are asked to sign an informed consent letter when they agreed on the use of their data for scientific research. Participation in the study was voluntary. The procedure falls within the Dutch Data Protection Act (Dutch DPA) and other specific Dutch healthcare laws, which provides legal provisions on how to deal with the privacy of personal information within the context of, among others, mental health services. The Dutch DPA also includes that all patients have the right to withdraw their previous consent at all times during and after treatment.
The initial sample comprised 1,879 adult violent offenders. Excluded were detained offenders (n=424) since most of the criminogenic risk factors apply to offenders living in the community, offenders who did not consented to use their data for scientific purposes (n=22), and female offenders (n=156) since they represent a very small percentage (8%) compared to the male adults in the sample. The average age of the remaining group of 1,471 violent male offenders at treatment start was 30.93 years (SD=10.38, Range 18-72 years). The majority was born in the Netherlands (78%) and 22% abroad with the most frequently found percentages of offenders being born in Surinam (4.3%), the Caribbean (3%), Morocco (3.9%), and Turkey (2.5%), a little over half of the sample entered treatment on a voluntary basis (53.5%). The average treatment length was 39.37 weeks (SD=15.19, Range 0-130 weeks).
Subgroups based on DSM-IV-TR classification
SUDs were diagnosed in 56.4% of the sample. Clinical and personality disorders were present in 83.6% (including SUD) and 49.7% of the total group, respectively. The most common clinical disorders were developmental disorders (26.5%), impulse control disorders (19.9%), and mood disorders (11.9%). Cluster B personality disorders were the most frequently diagnosed disorders in the sample with an antisocial personality disorder (39.6%) and a borderline personality disorder (10.2%) being the most frequently diagnosed. Other clinical and personality disorders were diagnosed in less than 10 percent of the sample. This also accounted for the presence of intellectual disabilities among the offenders under investigation (7.8%). Blind to their criminal history and recidvism status, the first author categorized the violent offenders in four mutually exclusive subgroups:
1. Offenders without any clinical and/or personality disorder (No disorders group, n=142, 9.7%);
2. Offenders with a clinical disorder (SUD excluded) and/or personality disorder (Other disorders group, n=499, 33.9%);
3. Offenders with only a SUD disorder (SUD group, n=120, 8.2%);
4. Offenders with a dual diagnosis, that is SUD with co-occurring clinical and/or personality disorder (DD group, n=710, 48.3%)
Independent Variables (IVs)
Central eight criminogenic risk factors: Items of the Risk Assessment for outpatient Forensic Mental Health-adult version (RAF MH; [32]) were used to operationalize the big four and moderate three criminogenic risk factors. The substance use criminogenic factor was not operationalizing as an independent variable since the substance related disorders were used to classify offenders in one of the four subgroups described previously. The RAF MH is a generic Structured Professional Judgment (SPJ) risk assessment instrument with the aim of assessing recidivism risk of clients referred to forensic outpatient treatment, suitable for any type of index offense. The psychometric qualities of the youth version of the RAF MH (which is largely identical to the RAF MH for adults) were confirmed for inter-rater reliability (ICC=0.78) and predictive validity (AUC=0.77; [33]). The RAF MH consists of 65 risk factors tapping on several general risk domains such as previous and current offenses, substance use, family/marital circumstances, social network, attitude, and risk management. From these domains, 22 items (34%) were used to calculate the big four and moderate three criminogenic factors. These factors are described by, amongst others, Andrews and Bonta [16] and Andrews, Bonta, and Wormith [19] as follows:
• B1 History of antisocial/criminal behavior: Early onset of antisocial and criminal behavior, and continuing involvement in a number and variety of anti-social and criminal acts (α=0.68);
• B2 Antisocial personality pattern: Poor self-control, stimulation seeking, weak problem solving skills, hostility (α=0.70);
• B3 Antisocial cognitions: Attitudes, values and rationalizations supportive of crime, cognitive emotional states of anger, resentment and defiance (α=0.66);
• B4 Antisocial network: Association with friends and acquaintances who engage in criminal behavior and relative lack of prosocial friends and acquaintances (α=0.58);
• M1 Family/Marital circumstances: Low levels of affection, care, cohesiveness in family and romantic relationships (α=54);
• M2 Education/Employment: Low levels of performance and involvement resulting in dissatisfaction and avoidance of them (α=56);
• M3 Leisure pursuits: Lack of involvement in pro-social leisure and recreational pursuits (α=0.71).
Based on these descriptions, the big four (B1-B4) and the moderate three (M1-M3) criminogenic risk factors were operationalize using a summation of the RAF MH items. Table 1 presents a more detailed overview of how these factors were operationalized and what percentage of the information was missing.
|
Risk Factor |
Rating Scale |
% Missing |
|
B1. History of antisocial/criminal behavior |
||
|
Previous convictions |
Num |
0 |
|
Escalation in frequency and severity of committed offences |
0/1/2 |
0 |
|
Young age first antisocial behavior |
0/1/2 |
0 |
|
Ever been detained |
No/Yes |
0 |
|
Prior violations of conditions |
0/1/2 |
0 |
|
B2. Antisocial personality pattern |
||
|
Lack of self-insight |
0/1/2 |
0 |
|
Impulsivity |
0/1/2 |
0 |
|
Inadequate coping skills |
0/1/2 |
0 |
|
Anger management issues |
0/1/2 |
0 |
|
B3. Antisocial cognitions |
||
|
Cognitions supportive of crime |
0/1/2 |
0 |
|
Minimalizing offence behavior |
0/1/2 |
0 |
|
B4. Antisocial network |
||
|
Criminal friends/acquaintances |
No/Yes |
0.6 |
|
Non-criminal friends/acquaintances |
Yes/No |
0.9 |
|
M1. Family/Marital circumstances |
||
|
Unstable partner relationships |
0/1/2 |
0 |
|
Relationships with family members |
0/1/2 |
0 |
|
Relationship with children (not applicable=0) |
0/1/2 |
4.8 |
|
M2. Education/Employment |
||
|
Expelled from/dropped out of school |
No/Yes |
0 |
|
Employment instability |
0/1/2 |
0 |
|
Performance at work |
0/1/2 |
2.7 |
|
Work relationship with colleagues (no colleagues=0) |
0/1/2 |
3.1 |
|
Work relationship with manager (owner=0) |
0/1/2 |
2.7 |
|
M3. Leisure pursuits |
||
|
Individual leisure activities |
0/1/2 |
0 |
|
Leisure activities with others |
0/1/2 |
0 |
Table 1: Number-average Molecular weight (Mn), Molecular weight distribution (Mw/Mn), hydrodynamic radius (Rh), and ?-potential for the polymers.
Dependent Variables (DVs)
Dropout: Offenders were categorized as dropouts when treatment was unilateral terminated by the client or the therapist against the initial agreement. This information was retrieved from the electronic patient files.
Strategy for analyses
Mardia’s test of multivariate kurtosis showed that the data in the four subgroups met the assumption of multivariate normality with values below the threshold of 5 [36]: No-disorder group=1.77; Other disorders group=1.15; SUD-only group=-0.58; DD-group=-1.76. Since items differed in number of scoring categories, variables were standardized into z-scores.
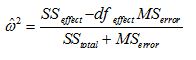
Multivariate Analysis of Variance (MANOVA) with Bonferroni post hoc test to adjust for type 1 errors, and chi-square analyses were conducted to assess the differences between subgroups in demographic, treatment and criminal characteristics. As suggested by Field [37], omega squared (ω2) effect sizes were reported for the MANOVA results, using the following formula. The effect size guidelines for omega squared are: Small=0.01; medium=0.06; large=0.14.
Point-biserial correlations (rpb) were calculated between the dependent and independent variables. Following the guidelines provided by Cohen [38], the strength of the correlation is interpreted as follows: r ≥ 0.10=weak, r ≥ 0.30=moderate, r ≥ 0.50=strong.
Recidivism rates were calculated using Kaplan-Meier survival analysis, which takes into account the individual differences in follow-up periods [39]. The survival analyses were performed with the dates of the first recidivism offense; all subsequent re-offenses were excluded. The log rank test was included to detect significant differences in cumulative recidivism percentages between the subgroups [40].
Multi-group path analysis
Fit indices and thresholds
A number of statistic cutoffs for the fit indices are suggested to discriminate between poor, acceptable, and optimal model fit. Although there is no consensus regarding an acceptable χ2/df ratio (CMIN/DF), recommendations range from smaller than 5.0 [44] to preferably around 2.0 [45]. Optimal chi-square values are non-signi?cant. However, signi?cant values do not necessarily indicate poor model at because the chi-square statistic is sensitive to sample size. Therefore, its role in CFA testing for model fit is more descriptive than inferential. For the additional absolute fit indices, a value ≤ 0.06 is needed for the RMSEA index and for SRMR a value close to 0.08 is considered best [43]. Regarding the SRMR, a value close to 0.08 is considered best [43]. Lastly, Kline [42] suggests that for the incremental fit indices CFI and NNFI, values above 0.90 are adequate, although values above 0.95 are more desirable [43].
RESULTS
Sample characteristics
|
DD Group (n=710) |
SUD Group |
Other Disorders Group (n=499) |
No Disorders Group (n=142) |
|||||
|
M |
SD |
M |
SD |
M |
SD |
M |
SD |
|
|
Age at start treatment |
30.97 |
9.67 |
29.37 |
10.68 |
32 |
11.12 |
28.31 |
10.32 |
|
Treatment length (months) |
40.25 |
14.8 |
38.25 |
16.17 |
39.93 |
15.23 |
33.93 |
15.11 |
|
#previous convictions |
9.22 |
11.2 |
7.99 |
12.11 |
6.11 |
7.99 |
4.34 |
4.7 |
|
n |
% |
n |
% |
n |
% |
n |
% |
|
|
Ethnicity |
||||||||
|
Dutch |
579 |
81.9 |
98 |
82.4 |
378 |
76.5 |
105 |
75.5 |
|
Non-dutch |
126 |
18.1 |
21 |
17.6 |
116 |
23.5 |
34 |
24.5 |
|
Treatment context |
||||||||
|
Voluntary |
394 |
55.5 |
47 |
39.2 |
310 |
62.1 |
36 |
25.4 |
|
Mandatory |
316 |
44.5 |
73 |
60.8 |
189 |
37.9 |
106 |
74.6 |
|
Education level* |
||||||||
|
Primary education or less |
231 |
41.6 |
35 |
37.2 |
154 |
39 |
32 |
29.4 |
|
Lower secondary |
298 |
53.7 |
50 |
53.2 |
205 |
51.9 |
67 |
61.5 |
|
Upper secondary or higher |
26 |
4.7 |
9 |
9.6 |
36 |
9.1 |
10 |
9.2 |
Note: Chi-square differences between groups were considered significant below a p-value of 0.005 due to Bonferroni correction.
Recidivism and dropout rates
|
DD Group (n=710) |
SUD Group (n=120) |
Other Disorders Group (n=499) |
No Disorders Group (n=142) |
|||||
|
n |
% |
n |
% |
n |
% |
n |
% |
|
|
Recidivism |
427 |
52.3 |
48 |
50.8 |
144 |
39 |
46 |
38.3 |
|
Dropout |
346 |
50.8 |
42 |
37.8 |
192 |
40.4 |
45 |
33.1 |
Correlations between IVs and DVs
|
Recidivism |
Dropout |
B1 |
B2 |
B3 |
B4 |
M1 |
M2 |
|
|
Dropout |
0.059* |
|||||||
|
B1 History of antisocial/criminal behavior |
0.226*** |
0.167*** |
||||||
|
B2 Antisocial personality pattern |
0.060* |
0.200*** |
0.200*** |
|||||
|
B3 Antisocial cognitions |
0.126*** |
0.101*** |
0.287*** |
0.265*** |
||||
|
B4 Antisocial network |
0.141*** |
0.099*** |
0.364*** |
0.198*** |
0.186*** |
|||
|
M1 Family/Marital circumstances |
0.03 |
0.155*** |
0.060* |
0.332*** |
0.102*** |
0.122*** |
||
|
M2 Education/ Employment |
0.005 |
0.098*** |
0.163*** |
0.232*** |
0.062* |
0.111*** |
0.101*** |
|
|
M3 Leisure pursuits |
0.017 |
0.124*** |
0.170*** |
0.260*** |
0.139*** |
0.153*** |
0.252*** |
0.142*** |
Table 4: Point-biserial correlations (rpb) between IVs and DVs.
Multi-group path analysis
Based on R2 values, the overall model for the DD-group accounted for 4.6% of the variance in general recidivism and 5.1% of the variance in dropout. Compared to the other subgroups these explained variances of recidivism and dropout were in the low range: Recidivism: R2SUD=7.5%; R2No disorders=19.7%; R2Other disorders=9.1%. Dropout: R2SUD=19.7%; R2No disorders=10.9%; R2Other disorders=6.4%).
Except for B1 History of criminal behaviour and M3 Leisure pursuits, different criminogenic factors seemed to contribute to recidivism and dropout in three out of four subgroups of violent offenders. Zooming in on the DD-offenders, recidivism was significantly affected by B1 history of antisocial/criminal behaviour (ß=0.158) and M2 Education/employment (ß=-0.081), indicating that an extended history of criminal behaviour elevated the risk of reoffending, whereas a lower education and/or employment instability decreased this risk. The criminogenic factors significantly related to dropouts in the DD-group were B2 Antisocial personality pattern (ß=0.110), M1 Family/Marital circumstance (ß=0.084), and M3 Leisure pursuits (ß=0.070).
|
DD (N=710) |
SUD (N=120) |
Other Disorders (N=499) |
No Disorders (N=142) |
|||||||||||||
|
Recidivism |
ß |
SE |
95%CI |
p |
ß |
SE |
95%CI |
p |
ß |
SE |
95%CI |
p |
ß |
SE |
95%CI |
p |
|
B1 History of antisocial/ |
0.158 |
0.041 |
0.069 |
0.002 |
0.130 |
0.093 |
-0.047 |
0.162 |
0.195 |
0.048 |
0.101 |
0.002 |
0.295 |
0.088 |
0.093 |
0.003 |
|
B2 Antisocial personality |
0.048 |
0.039 |
-0.031 |
0.271 |
-0.254 |
0.113 |
-0.476 |
0.029 |
0.018 |
0.049 |
-0.08 |
0.720 |
0.165 |
0.091 |
-0.017 |
0.083 |
|
B3 Antisocial cognitions |
0.055 |
0.040 |
-0.028 |
0.163 |
-0.063 |
0.089 |
-0.229 |
0.535 |
0.111 |
0.048 |
0.014 |
0.030 |
0.037 |
0.081 |
-0.121 |
0.573 |
|
B4 Antisocial network |
0.041 |
0.038 |
-0.036 |
0.292 |
0.086 |
0.088 |
-0.088 |
0.338 |
0.071 |
0.048 |
-0.025 |
0.137 |
0.105 |
0.088 |
-0.069 |
0.272 |
|
M1 Family/Marital circumstances |
-0.025 |
0.040 |
-0.105 |
0.531 |
0.016 |
0.107 |
-0.205 |
0.918 |
-0.055 |
0.045 |
-0.140 |
0.245 |
-0.265 |
0.075 |
-0.404 |
0.004 |
|
M2 Education /Employment |
-0.081 |
0.034 |
-0.147 |
0.026 |
0.116 |
0.099 |
-0.069 |
0.240 |
0.028 |
0.042 |
-0.051 |
0.485 |
0.027 |
0.079 |
-0.176 |
0.754 |
|
M3 Leisure pursuits |
0 |
0.039 |
-0.082 |
0.959 |
0.018 |
0.107 |
-0.196 |
0.856 |
-0.028 |
0.049 |
-0.120 |
0.546 |
-0.168 |
0.094 |
-0.370 |
0.059 |
|
Dropout |
||||||||||||||||
|
B1 History of antisocial/criminal behavior |
0.052 |
0.040 |
-0.027 |
0.163 |
0.147 |
0.090 |
-0.026 |
0.110 |
0.202 |
0.049 |
0.104 |
0.003 |
0.064 |
0.090 |
-0.114 |
0.524 |
|
B2 Antisocial personality pattern |
0.110 |
0.039 |
0.030 |
0.006 |
0.066 |
0.109 |
-0.158 |
0.603 |
0.092 |
0.048 |
-0.004 |
0.058 |
0.201 |
0.101 |
0.020 |
0.068 |
|
B3 Antisocial cognitions |
0.036 |
0.039 |
-0.044 |
0.418 |
0.028 |
0.095 |
-0.162 |
0.785 |
-0.001 |
0.050 |
-0.094 |
0.991 |
-0.015 |
0.088 |
-0.186 |
0.881 |
|
B4 Antisocial network |
0.031 |
0.039 |
-0.046 |
0.400 |
0.067 |
0.094 |
-0.245 |
0.457 |
-0.55 |
0.050 |
-0.147 |
0.311 |
0.070 |
0.087 |
-0.102 |
0.374 |
|
M1 Family/Marital circumstances |
0.084 |
0.040 |
0.003 |
0.040 |
0.200 |
0.116 |
0.039 |
0.104 |
0.093 |
0.050 |
-0.010 |
0.065 |
0.039 |
0.101 |
-0.152 |
0.706 |
|
M2 Education/ Employment |
0.038 |
0.037 |
-0.036 |
0.312 |
0.007 |
0.093 |
-0.197 |
0.996 |
0.021 |
0.047 |
-0.072 |
0.681 |
0.166 |
0.100 |
-0.048 |
0.115 |
|
M3 Leisure pursuits |
0.070 |
0.038 |
-0.001 |
0.052 |
0.242 |
0.100 |
0.043 |
0.022 |
0.012 |
0.049 |
-0.088 |
0.842 |
-0.249 |
0.094 |
-0.426 |
0.017 |
Table 5: Multi-group path analysis: bias-corrected bootstrap path estimates (ß), SEs and 95% CIs for IVs as predictors of recidivism and dropout for subgroups of violent offenders.
DISCUSSION
Based on the General Personality and Cognitive Social Learning (GPCSL) theory described by Andrews and Bonta [16], this study sought to identify which of the central eight criminogenic risk factors predicted general recidivism (and dropout) across adult violent offender subgroups. The central eight risk factors had a significant, but weak, correlation with recidivism and dropout, which in a more robust, comprehensive multi-group path analysis resulted in a few number of risk factors that were found predictive of recidivism and dropout. Additionally, no clear support emerged for the primacy of the big four criminogenic factors over the moderate four factors in subgroups of violent offenders in outpatient forensic care. In general, the only consistent big four risk factor predictive of general recidivism was a history of antisocial/criminal behavior. Previous studies on the predictive value of the central eight in several offender subsamples also resulted in inconsistent findings [22,25,26,28]. For instance, Hilton and Radatz [28] compared Intimate Partner Violent (IPV) offenders with general violent offenders and non-violent offenders on the prevalence of the RNR criminogenic needs and found that-compared to the other groups-IPV-offenders had the highest needs in all domains except education/employment. Criminogenic needs in the general violent offenders group were mostly present in the education/employment, substance use, domains. Taken together, our findings do not support the central eight risk factors as relevant predictors of general recidivism. However, since this was the first study to relate these factors to recidivism in subgroups of violent outpatient offenders, future research is needed to support this conclusion. Even more because counter-intuitive a decreased risk was found in the subgroup of DD-offenders from our study with Education/employment instability, indicating that offenders showing low levels of involvement in education and/or work had a lower risk of re-offending. In addition, it was found that the No disorder offenders had a higher risk of re-offending when problems in the Marital and Family domain were absent. These results should be interpreted with caution, however, since the reliability of this subscale was at an average level (α=56).
As for the predictors of dropout, leisure pursuits emerged as the only significant predictor in three out of four subgroups: Increased dropout rates were prevalent among offenders with a low involvement in pro-social leisure and recreational pursuits. Additionally, in the DD-group dropout was predicted by an antisocial personality pattern and poor family/marital circumstances. These findings corroborate with previous studies in which it was found that factors such as problematic interpersonal relationships are assumed to act as barriers for accessing and continuation of medical and social services [11-13].
Study limitations and future directions
A second limitation was that possible confounders, such as age at start of the treatment and treatment length, could have affected the results in terms of counter-intuitive findings and the unexpected absent of the big four criminogenic factors as predictors of general recidivism. However, differences between subgroups regarding these possible confounders were weak, which might indicate that other variables not included in the study could have influenced the current findings. One of which might be that that no distinction was made type of drugs and disorders. Based on the Hakansson and Berglund’s [50] study this distinction could be beneficial since their results gained from 4,152 prisoners indicated that, while controlling for psychiatric problems, and severity and type of crime, the use of heroin and amphetamine was found predictive of general recidivism rather than other substances. In addition, O’Driscoll, Larney, Indig, and Basson [51] showed that SUD and a Personality Disorder (PD) were the only mental illnesses associated with reoffending. Even when other mental illnesses comorbid with a personality disorder, substance use, or both, the risk of reoffending did not change. In our study, a dual diagnosis was defined as a SUD combined with one or more clinical and/or personality disorders without distinguishing between specific groups of disorders, for instance cluster B PDs. Future research could add to the results obtained from our study, when subgroups are categorized by disorder groups, in particular cluster B personality disorders. This aligns with the General Personality and Cognitive Social Learning (GPCSL) theory [16] in which the clinical disorders such as anxiety, depression, mood, and major psychotic symptoms, are regarded as minor risk factors for criminal behaviour. These clinical disorders, however, are important for identifying the individual symptomology and personal suffering that occurs and what needs to be addressed before targeting criminogenic needs in the treatment [17].
Finally, in the present study risk assessment scores at treatment admittance were used. The central eight risk factors are predominantly dynamic in nature and one of the strengths of these risk factors would be their sensitivity to change. Holliday, Heilbrun, and Fretz [52] conducted a research among 71 male residents from correctional prison facilities or half-way houses to determine whether change in dynamic risk factors (consistent with the principles of the RNR model) may occur in response to a relatively brief (60 days), targeted re-entry intervention. It was found that high-risk residents showed significant improvements in their overall risk and criminogenic needs such as family and marital relationships, their attitudes toward crime, and their antisocial patterns of behaviour. Moreover, it was demonstrated by Labreque, Smith, Lovins, and Latessa [53] that the percentage change in criminogenic need scores is the best predictive measure of reoffending. Further insights in this particular area could enhance our understanding of the treatment effect in particular among high-risk DD-offenders and SUD-offenders.
Implications for clinical practice
At this point it is too early to draw any conclusions about the relevance of the central eight criminogenic needs in the treatment of subgroups of violent offenders. Although the results suggest that the criminogenic needs (i.e., big four and moderate four) as outlined in the RNR-model, are not related to recidivism and, therefore, should not be targeted in treatment additional empirical studies are needed taking into account the limitations outlined above.
REFERENCES
- Hartwell S (2004) Triple stigma: Persons with mental illness and substance abuse problems in the criminal justice system. Criminal Justice Policy Review 15: 84-99.
- Soyka M (2000) Substance misuse, psychiatric disorder and violent and disturbed behaviour. Br J Psychiatry 176: 345-350.
- Janca A, Sartorius N (1995) The World Health Organization's recent work on the lexicography of mental disorders. Eur Psychiatry 10: 321-325.
- Baillargeon J, Binswanger IA, Penn JV, Williams BA, Murray OJ (2009) Psychiatric disorders and repeat incarcerations: The revolving prison door. Am J Psychiatry 166: 103-109.
- Lukasiewicz M, Blecha L, Falissard B, Neveu X, Benyamina A, et al. (2009) Dual diagnosis: Prevalence, risk factors, and relationship with suicide risk in a nationwide sample of French prisoners. Alcohol Clin Exp Res 33: 160-168.
- Piselli M, Elisei S, Murgia N, Quartesan R, Abram KM (2009) Co-occurring psychiatric and substance use disorders among male detainees in Italy. Int J Law Psychiatry 32: 101-107.
- Lund C, Hofvander B, Forsman A, Anckarsäter H, Nilsson T (2013) Violent criminal recidivism in mentally disordered offenders: A follow-up study of 13-20 years through different sanctions. Int J Law Psychiatry 36: 250-257.
- Walker ER, McGee RE, Druss BG (2015) Mortality in mental disorders and global disease burden implications: A systematic review and meta-analysis. JAMA Psychiatry 72: 334-341.
- Nordentoft M, Wahlbeck K, Hällgren J, Westman J, Osby U, et al. (2013) Excess mortality, causes of death and life expectancy in 270,770 patients with recent onset of mental disorders in Denmark, Finland and Sweden. PLoS One 8: 55176.
- Toftdahl NG, Nordentoft M, Hjorthøj C (2016) Prevalence of substance use disorders in psychiatric patients: A nationwide danish population-based study. Soc Psychiatry Psychiatr Epidemiol 51: 129-140.
- Donald M, Dower J, Kavanagh D (2005) Integrated versus non-integrated management and care for clients with co-occurring mental health and substance use disorders: A qualitative systematic review of randomized controlled trials. Soc Sci Med 60: 1371-1383.
- Messina N, Burdon W, Hagopian G, Prendergast M (2004) One year return to custody rates among co-disordered offenders. Behav Sci Law 22: 503-518.
- Anderson S, Berg JE (2001) The use of a sense of coherence test to predict drop-out and mortality after residential treatment of substance abuse. Addiction Research & Theory 9: 239-251.
- Dobkin PL, De Civita M, Paraherakis A, Gill K (2002) The role of functional social support in treatment retention and outcomes among outpatient adult substance abusers. Addiction 97: 347-356.
- Andrews DA, Bonta J (2010) The psychology of criminal conduct, (5th edn). Lexis Nexis/Anderson Pub, California, USA.
- Bonta J, Blais J, Wilson HA (2013) The prediction of risk for mentally disordered offenders: A quantitative Public Safety Canada, Ottawa, Canada.
- Andrews DA, Bonta J (2010) Rehabilitating criminal justice policy and practice. Psychology, Public Policy and Law 16: 39-55.
- Andrews DA, Bonta J, Wormith SJ (2006) The recent past and near future of risk/need assessment. Crime and Delinquency 52: 7-27.
- Gendreau P, Little T, Goggin C (1996) A meta-analysis of the predictors of adult offender recidivism: What works! Criminology 34: 575 -607.
- Grieger L, Hosser D (2013) Which risk factors are really predictive? An analysis of Andrews and Bonta’s “central eight” risk factors for recidivism in German youth correctional facility inmates. Criminal Justice and Behavior 41: 613-634.
- Schwalbe SJ (2008) Risk assessment for juveniles on probation: A focus on gender. Criminal Justice and Behavior 26: 44-68.
- Andrews DA, Guzzo L, Raynor P, Rowe R, Rettinger LJ, et al. (2012) Are the major risk/need factors predictive of both female and male reoffending? A test with the eight domains of the level of service/case management inventory. Int J Offender Ther Comp Criminol 56: 113-133.
- Rettinger JL, Andrews DA (2010) General risk and need, gender specificity, and the recidivism of female offenders. Criminal Justice and Behavior 37: 29-46.
- Smith P, Cullen F, Latessa E (2009) Can 14,737 women be wrong? A meta-analysis of LSI-R and recidivism for female offenders. Criminology and Public Policy 8: 183-208.
- Gutierrez L, Wilson HA, Rugge T, Bonta J (2013) The prediction of recidivism with aboriginal offenders: A theoretically informed meta-analysis. Canadian Journal of Criminology and Criminal Justice 55: 55-99.
- Hanson RK (2009) The psychological assessment of risk for crime and violence. Canadian Psychology 50: 172-182.
- Hilton NZ, Radatz DL (2017) The Criminogenic and noncriminogenic treatment needs of intimate partner violence offenders. Int J Offender Ther Comp Criminol.
- Blanchette K, Brown SL (2006) The assessment and treatment of women offenders: An integrative perspective. John Wiley & Sons, Hoboken, USA.
- Ward T, Mesler J, Yates P (2007) Reconstructing the risk-need-responsivity model: A theoretical elaboration and evaluation. Aggression and Violent Behavior 12: 208-228.
- American Psychiatric Association (2000) Diagnostic and statistical manual of mental disorders, (4thedn). American Psychiatric Association, Washington DC, USA.
- Horn J van, Wilpert J, Scholing A, Mulder J (2008) Handleiding Risicotaxatievolwassenen cliënten. [Manual Risk Assessment for Forensic outpatient Mental Health - RAF MH]. De Forensische Zorgspecialisten, Utrecht, The Netherlands.
- Horn J van, Wilpert J, Bos MGN, Eisenberg M, Mulder J (2009) Waagschaal jeugd-De psychometrische kwaliteit van een gestructureerd klinisch risicotaxatie-instrument voor de ambulante forensische psychiatrie. Tijdschrift voor Strafrecht, Criminologie en Forensisch Welzijnswerk 30: 23-34.
- O’Brien RM (2007) A caution regarding rules of thumb for variance inflation factors. Quality & Quantity 41: 673-690.
- Schafer JL, Graham JW (2002) Missing data: Our view of the state of the art. Psychol Methods 7: 147-177.
- Byrne BM (2010) Structural equation modelling with AMOS, (2nd edn). Routledge, New York, USA.
- Field AP (2005) Discovering statistics using SPSS. Sage, London, UK.
- Parker RI, Hagan Burke S (2007) Useful effect size interpretations for single case research. Behav Ther 38: 95-105.
- Wartna B (2000) Recidive-onderzoek en survival-analyse: Over het meten van de duur van de misdrijfvrije periode. Tijdschrift voor Criminologie 42: 2-20.
- Hosmer DW, Lemeshow S, May S (2011) Applied survival analysis: Regression modeling of time to event data, (2nd edn). John Wiley & Sons,Hoboken, USA.
- Cheung GW, Lau RS (2008) Testing mediation and suppression effects of latent variables: Bootstrapping with structural equation models. Organizational Research Methods 11: 296-325.
- Kline RB (2010) Principles and practice of structural equation modelling, (3rd edn). Guilford Publications, New York, USA.
- Hu L, Bentler PM (1999) Cutoff criteria for fit indexes in covariance structure analysis: Conventional criteria versus new alternatives. Structural Equation Modeling 6: 1-55.
- Wheaton B, Muthen B, Alwin DF, Summers G (1977) Assessing reliability and stability in panel models. Sociological Methodology 8: 84-136.
- Tabachnick BG, Fidell LS (2013) Using multivariate statistics, (6th edn). Pearson, Boston, USA.
- Walter M, Wiesbeck GA, Dittmann V, Graf M (2011) Criminal recidivism in offenders with personality disorders and substance use disorders over 8 years of time at risk. Psychiatric Research 186: 443-445.
- Bennett T, Holloway K, Farrington D (2008) The statistical association between drug misuse and crime: A meta-analysis. Aggression and Violent Behavior 13: 107-118.
- First MB, Spitzer RL, Gibbon M, Williams JBW (1997) Structured clinical interview for DSM-IV Axis I disorders SCID-I. American Psychiatric Press, Washington DC, USA.
- First MB (1997) User's Guide for the Structured clinical interview for DSM-IV Axis II personality disorders (SCID-II). American Psychiatric Press, Washington DC, USA.
- com (2015) DSM V codes. PsyWeb.com.
- Håkansson A, Berglund M (2012) Risk factors for criminal recidivism-A prospective follow-up study in prisoners with substance abuse. BMC Psychiatry 12: 111.
- O’Driscoll C, Larney S, Indig D, Basson J (2012) The impact of personality disorders, substance use and other mental illness on re-offending. The Journal of Forensic Psychiatry & Psychology 23: 382-391.
- Holliday SB, Heilbrun K, Fretz R (2012) Examining improvements in criminogenic needs: The risk reduction potential of a structured re-entry program. Behav Sci Law 30: 431-447.
- Labreque RM, Smith P, Lovins BK, Latessa EJ (2014) The Importance of reassessment: How changes in the LSI-R risk score can improve the prediction of recidivism. Journal of Offender Rehabilitation 53: 116-128.
- King AC, Canada SA (2004) Client-related predictors of early treatment drop-out in a substance abuse clinic exclusively employing individual therapy. J Subst Abuse Treat 26: 189-195.
- Palmer RS, Murphy MK, Piselli A, Ball SA (2009) Substance user treatment dropout from client and clinician perspective: A pilot study. Subst Use Misus 44: 1021-1038.
Citation: van Horn JE, Eisenberg M, Souverein FA, Kraanen F (2018) The predictive Value of the Central Eight Criminogenic Risk Factors: A Multi-Group Comparison of Dually Diagnosed Violent Offenders with other Subgroups of Violent Offenders. J Addict Addictv Disord 5: 014.
Copyright: © 2018 Joan E van Horn, et al. This is an open-access article distributed under the terms of the Creative Commons Attribution License, which permits unrestricted use, distribution, and reproduction in any medium, provided the original author and source are credited.