Introduction
Rice, as one of the major food crops, ranks only second to wheat among the most cultivated cereals in the world. Its production is becoming an important component of the agricultural sector in Rwanda. The area under rice cultivation in Rwanda has tripled in the last 10 years resulting in a substantial production increase, from less than 20,000 tons to around 70,000 tones, involving about 62,000 small scale farmers [1]. Despite this steep production increase, the country still imports about 40% of the rice it consumes [2].With evolving rice farming systems and changing farmers and consumer preferences, rice breeding programs in Rwanda have received significant attention with respect to improvement of yield with best grain quality. In spite of thousands of rice accessions available in Rwanda rice germplasm collections, little is known about the genetic variability, and consequently few of elite rice varieties have been released for suitability to different agro-climatic conditions [3].Agro-morphological variability characterization of local germplasm is very important to better understand existing diversity, attain targeted genetic broadening of breeding populations, and potentially link this knowledge to genotypic information [4]. It also exposes the genetic variability in diverse populations and provides justification for introgressions of desired genes to enhance performance.One of methods to analysis genetic variability in a given population is the Principal Component Analysis (PCA). According to Sanni et al., the PCA is a measure of how important impact a certain trait has in explaining a total variability and each coefficient of proper vectors indicates the degree of contribution of every original variable with which each principal component is associated [5]. PCA based biplots contain a lot of information and can be helpful in interpreting relationships between experimental groups and features [6]. It is therefore a reliable guiding tool in the process of parental selection in various breeding programs.In this study, 64 rice accessions were evaluated in 3 different locations with the aim to (i) assess genetic variability of these accession across different agro-ecological conditions; (ii) evaluate the possibility to assign different accessions into relationship groups and (iii) derive conclusions regarding the potential use of this rice germplasm in different breeding programs in Rwanda.
Materials and Methods
Experimental location and design
Field experiment was conducted in three different sites representing diverse agro-ecological conditions of rice growing marshlands in Rwanda, all of them being irrigated ecosystems. The locations include Cyili in Gisagara District, of Southern Province (2027’16.25’’, 29o50’19.99’’and 1398 masl); Rurambi in Bugesera District of the Eastern Province (2o04’16.55’’), 30o13’07.50’’ and 1336ftml) and Cyabayaga of Nyagatare District of Eastern Province (1o24’31.15’’, 30o’16’43.52’’, and 1358 masl).Trials were conducted from January to June, 2014 and were laid out in a balanced 8 x 8 lattice design with 2 replications on each site.
Planting materials
Planting materials consisted of 64 rice accessions kindly provided by the rice research program of Rwanda Agriculture Board (RAB). Hence a number of them have already been released and others are still in the multipurpose evaluation process prior to release (Table 1).Sun-dried seeds from each genotype were pre-germinated in plastic bags, and raised in a nursery to increase the germination rate. Seedlings were transplanted 21 days later as per recommendations. The experimental plots were 2m wide and 2m long. One seedling per hill was transplanted maintaining 20 cm × 20 cm inter - and intra -row spacing respectively. Except for the fact that the crop was raised under aerobic condition by providing irrigation once in every 3 days interval, the rest of the cultural practices and crop protection measures applied thus, ensuring uniform and healthy crop growth.
Data collection
Agro-morphological traits were observed on randomly selected plants in each single plot at 50% flowering (where applicable) and at the maturity stages.These traits included, number of days to 50% Flowering (DFF, no ), Plant Height at 50% flowering (PHT50 in cm), Number of Tillers at 50% flowering (NT50, no), Flag Leaf Length at 50 % flowering (FLL50, cm), Days to Maturity (DM, no), Plant Height (PH, cm), Number of Tillers (NT), Number of Productive Tillers (NPT, no), Flag Leaf Area (FLA, cm2), Panicle Length (PL, cm), number of Branches per Panicle (BrP), number of Grains per Panicle (GP, no), Single Panicle Weight (SPW, gr), Total number of Panicles per Plot (TPP, no), Weight of 1000 grains (W1000G in g), Grain Length (GL in mm), and Grain Yield per plot (GY in g/plot).
Data analysis
Statistical analysis of data on each character was carried out using mean values of five randomly selected plants from each genotype in each replication. Genetic variability across sites for assessed accessions was obtained through the analysis of variance performed on data of different traits. This was performed using REML procedure of Genstat 17th edition, to fit the following model as described by Atlin:Yijklm = µ+Ei+R(E)j(i)+ Ei+B(RE)m(ji)+Gk+GEik+eijklm, Yijklm = response of kth genotype grown in ith environment, jth replication and mth block; µ= general mean; Ei= effect of ith environment; R(E)j(i) = effect of jth replication within ith environment; Ei+B(RE)m(ji) = effect of mth block within jth replication and ith environment; Gk = effect of kth genotype; effect of interaction between kth genotype and ith environment; eijklm = term or plot residual [7,8]. Significant differences were decided at 5 and 1% significance levels.From the obtained means squares estimates, values were used to identify the role played by each trait in overall variability through the Principal Component Analysis (PCA). The Principal Component Analysis (PCA), clearly indicates the genetic variation of the accessions and measures the important characters with a greater impact to the total variability. This PCA was performed on the mean values recorded on 18 phenotypic traits from 3 trial sites. From this PCA, a bioplot graph was drawn in a bid to classify accessions into similarity groups. Both PC and bioplot analysis were computed with SPSS 16th edition (SPSS 2006).
Results
Determination of genetic variability parameters
Results from the analysis of variance in table 2, revealed a wide range of variability among 64 rice accessions for 18 studied traits, as indicated by the significant differences (P<0.05 and P<0.01) for the genotype component of variation.Significant differences were also evident for the effect of sites (locations) on varietal performance for most of the traits considered except for a few of them, including flag leaf length at 50% flowering and days to maturity. There were significant interactions between genotypes and sites for few traits. These include growth traits (plant height at 50% flowering and maturity, number of tillers, productive tillers, branches per panicle), and yield traits (grains per panicle, panicles per plot and single panicle weight).
Individual trait contribution to total germplasm variability
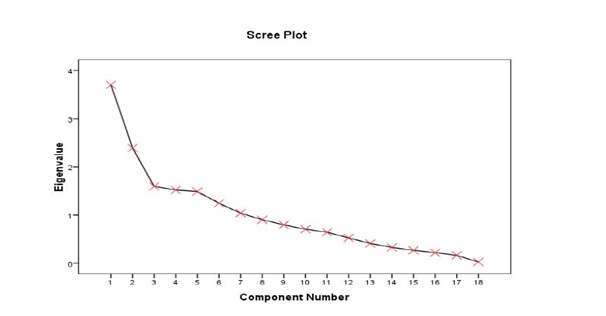
Subsequent to analysis of variance, a further step was needed to demonstrate the contribution of each trait in the germplasm variability through PCA. The scree plot (Figure 1) revealed 5 principal components.However, the extracted sums of squared loadings and component correlation matrix revealed actually 7 principal components which are correlated to 18 traits (Table 3) accounting for 72.165% of the total variation. Individual contribution for each of 7 components was: 20.568%; 13.302%; 8.864%; 8.454%; 8.272%; 6.922% and 5.783% in respective order (Table 3).Analysis of the factor loadings of the characters in the retained PCs showed that phenotypic traits that contributed to yield showed high positive loadings in PC1, PC2 and PC3 (Table 3). PC1 was strongly associated with plant height attributes (0.887 and 0.902). PC2 was associated with harvested plant parts related characters such as number of branches per panicle (0.714), number of grains per panicle (0.634) and grain yield (0.807) and single panicle weight (0.452). Tillering ability characters were found in association with PC3: number of tillers (0.642), number of productive tillers (0.823) as well as total number of panicles per plot (0.832).Elsewhere, PC4 was associated with panicle length, (0.735) and flag leaf length (0.888), PC5 linked to days to maturity (0.755) and negatively related to weight of 1000 grains, PC6 with flag leaf area (0.633) and finally PC7 associated with days to 50% flowering.
Classification of accessions into relationship groups
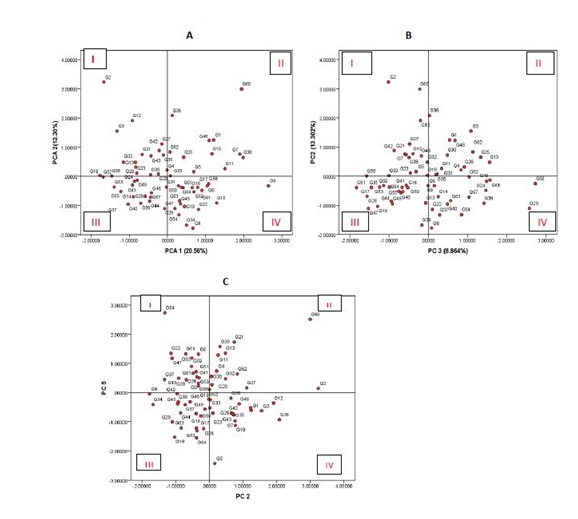
The scree plots based on the morphological traits revealed the exact proportion of each component and its contribution to the total variation without any further information. Consequently, an attempt was made to visualize the clustering pattern using principal components.Plotting PC1 against PC2 resulted in clustering different accessions as shown in figure 2(A-C). As the most compelling results, biplot showing the distribution of accessions based on both PCs was focused on 4 groups of genotypes. Quadrant I and II groups accessions that are characterized by a high yielding potential. Genotypes in quadrant I recorded highest scores of panicle and yield related characteristics such as panicle length, grains per panicle, single panicle weight and most importantly grain yield. Quadrant II gathers genotypes characterized by highest records of vegetative growth especially tall varieties with long panicle sheaths. Quadrant III encloses genotypes which are characterized by dwarf and semi dwarf plant stature as well as low yielding potential, while quadrant IV contains tall and low yielding accessions.
Discussions
Significant differences observed among these genotypes indicate the existence of considerable genetic variability among the evaluated germplasm with regard to the 18 quantitative traits considered in this study. This was expected given that, evaluated accessions were developed from a diverse gene pool in different programs with different breeding objectives; a suggestion also shared with Oladosu et al., [9].The results from the present study are in general agreement with a number of findings obtained elsewhere. For instance, Pandey et al., reported highly significant differences among 40 rice accessions involving 12 quantitative characters [10]. Similarly, Tuhina-Khatun et al., found a wide range and significant variation among 43 upland rice cultivars for the 22 quantitative agro-morphological characters [11]. These results provide useful information that can be applied by rice breeders in Rwanda. This is because, effective evaluation of varietal diversity provides, a considerable scope of choice of parents prior hybridization [10]. However, variability in terms of genetic divergence for agronomic traits is not sufficient as stand alone, but also requires reliable estimates of heritability to plan an efficient hybridization programme [12].The principal component analysis method has been widely used on rice for various objectives. The cumulative variance of 72.165% by the first 7 axes (Table 3), indicates the identified traits within the axes exhibited great influence on the phenotype of the accessions, and could effectively be used for selection. According to various reports quoted by Sanni et al., and Sinha and PK Mishra the first 3 components (PC1, PCR2 and PC3) and associated traits are the most reliable to explain variation patterns among different genotypes [5,13]. Findings in table 3, suggest a common trend such that, in some circumstances, traits within a component contribute only one-sidedly, either reproductively (PC2) or vegetatively (PC1 and PC3), same remark has also been formulated by Chakravorty et al., [14]. Rabara et al., also observed 18 independent PC7 of which were responsible for 74.95%, of total variation among 307 rice landraces using 57 characters in Philippines [15]. Gana et al., observed 5 components strongly correlated with 12 traits among 39 genotypes and explaining 68.9% of total variation [16].Remarkably, findings by these authors corroborate with results of the present study. In fact, a number of traits are commonly found positively correlated with the first three components. These include plant height, number of tillers, number of panicle per plot, panicle ramification, weight of 1000 grains, panicle length and grain yield. Therefore, this may be taken into consideration during utilization of these traits in breeding programs.As rice farming systems in Rwanda aim mainly grain yield and quality, the biplot in figure 2A, exhibits only two clusters of accessions, of most interest. Quadrant I gather a group of accessions that are dwarf or semi-dwarf and high yielding potential, whereas quadrant II harbors a group of tall and high yielding varieties. This can be explained by the fact that grain yield has been found to be mostly directly determined by three yield components: number of panicles per unit land area, the average number of grain produced per panicle and the average weight of the individual grains [17]. Short and high yielding varieties have been reported elsewhere. Mishra et al., and Pandey described a list of high yielding and short statured Indian varieties [18,19]. In Rwanda, Ndikumana and ER Gasore characterized a number of short statured varieties that can potentially yield more than 6 tons per hectare, with very good quality characteristics [3].As far as relationship between rice tillering ability and yield are concerned, interesting information is found in figure 2B. Observations are centered on 4 scenarios. Quadrant I groups high yielding and low tillering ability accessions while quadrant II groups accessions combining high yielding and high tillering ability. On the other hand, quadrant III assembles low yielding and low tillering ability accessions and finally quadrant IV clusters low yielding and high tillering ability accessions.Normally, tillering ability should be in direct relationship with grain yield [20]. However, situations like the ones in quadrant I and II, is not a special case for this study but happens quite often. The reason is that number of tillers per hill for some varieties had negative impact on other traits by creating a sort of bushy stand. It is evident that there should be an optimum number of tillers per hill for a given crop spacing and for a specific variety. This should permit adequate resource use efficiency, at the most sensitive physiological and growth stages [21]. On this issue, Dingkuhn et al., explained that growth and limiting properties of the canopy at flowering indicated that tillers and leaf area production was excessive while foliar nitrogen concentration was suboptimal during reproductive and ripening phase [22]. According to De Datta in some areas of rice growing, especially in temperate climate, high tillering capacity of rice is not essential, but low tillering capacity is compensated by higher number of seedlings per plot [23].Yield is the most noticeable characteristic to farmers but when the product of the crop reaches the market, quality becomes the key determinant of its marketability. If consumers do not accept the taste, texture, aroma, or appearance of a newly developed variety, its usefulness is greatly questionable. The length and width of a rice grain are important attributes that determine quality of rice. Once grain length is concerned, PC5 (positively and highly correlated with grain length) and PC2 (correlated with grain yield) explains more in figure 2C. This biplotresulted in quadrant I exhibiting long grain and low yielding genotypes whereas quadrant II contains high yielding and long grain genotypes. Quadrant IV is made of high yielding and short grain genotypes and finally quadrant III gathers short grain and low yielding genotypes.Logically quadrant I and II are more interesting from the breeding point of view because of number of reasons. Grain yield and quality have largely been reported negatively correlated as far as grain quality parameters, except length and width, are concerned
(http:/irri.org/about-us/our-organization/grain-quality-and-nutrition-center). This depends on the meaning attached to high yields for different rice producers. For instance, in Thailand like in the Rwandan rice market, good quality rice is defined as that with a long, slender, translucent grain with a length of more than 7 mm [23,24]. According to the same author, in developed countries and in other rice exporting countries, physical appearance of the grain is often more important than grain yield.For rice breeding purpose involving traits considered in this study, accessions appearing in quadrant II of figure 2A are suitable for breeding objectives involving improved yield and tall or intermediate stature. These include the likes of G60, G36, G48, G1, G4 etc. Quality for this group is doubtful as generally tall varieties have short grain and subsequent quality characteristics.Accessions appearing in quadrant I of figure 2A are potentially interesting for breeding programs aimed at grain yield and improved quality with short stature. Generally, dwarf genotypes are Asian imported for their quality characteristics and dwarf stature and long grain are widespread in these rice growing regions. Yield is associated with their greater resource use efficiency in terms of less foliar growth and enhanced assimilate export from leaves to stems along with sustained high nitrogen concentration [21]. Accessions in this group include the likes of G2, G12, G3, G32, G42 etc.Breeding programmes involving tillering ability and improved yield are suggested to consider accessions in quadrant II and IV of figure 2B. These include high yielding and tillering ability accessions (G36, G3, G1, G62, G25 etc.,) on one hand, and high yielding and low tillering ability (G2, G60, G12, G27, G42, etc.,) on the other hand.Breeding investigations aimed at physical quality of the grain (length for instance), accessions in quadrants I and II of figure 2C are more suitable for parental selection prior to hybridization. These include, respectively G55, G22, G14, G47, G55 and G60, G21, G28, G13, G11.
Conclusion
This study highlighted existence of high level of genetic variability among 64 rice accessions available in Rwanda’s rice germplasm collection. Much of the variability was found to be due to genetic component of variation with little influence from environmental factors within the sites.Principal components analysis extracted 8 most polymorphic traits mostly responsible for genetic variability. These traits are plant height at both growth stages, number of branches per panicle, number of grains per panicle, single panicle weight, grain yield, number of tillers and total panicle per plot. These traits should therefore be given special emphasis during parental selection in hybridization process. Based on these traits, biplot analysis proposed clusters of accessions to be considered in varietal improvement strategies involving grain yield, on one hand, and vegetative characteristics (plant stature, tillering ability) and physical quality of grains (length) on the other hand. Hence these results are expected to be of significant importance in identifying potential parental materials for improving various morphological traits considered in this study.
Acknowledgement
The Alliance for Green Revolution in Africa (AGRA), African Center for Crop Improvement (ACCI) and University of KwaZulu-Natal are gratefully acknowledged for funding and supervising this study. Special thanks go also Rwanda Agriculture Board (RAB) for facilitating this study in one way or another.