| First author, journal, year of publication, reference, grade of recommendation | Type of the studies, setting | Effect of parity and/or lactation on fracture | Sample size, menopausal status, age in years (mean ± DS or median) | Follow-up (years) | Compared groups | Studied outcome | Results: [incidence, (HR or OR or RR (95% CI), p value] | Conclusion |
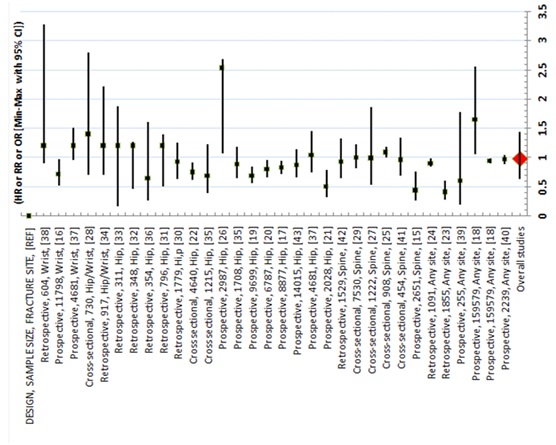
| Mori et al., Bone, [16]Grade B | Prospective, (The Study of Women's Health Across the Nation), United-State | All fracture | 2239, (1210 premenopausal and 1017 postmenopausal), (46.0±2.0) | 15.7 | - 2239 parous for 1 to 3 children | - Incidence of fractures on the whole studied population- Adjusted1 HR in compared groups for fracture risk | - 15.9%- Parity per additional childbirth:0.97(0.89-1.05),p = nd | Parity is not associated with fracture risk |
| Cauley et al., J Bone Miner Res, [17]Grade B | Prospective, (Women’s Health Initiative study), United-State | All fracture | 159579, postmenopausal, (50-79) | 8±2.6 | 144094 parous vs. 15485 nulliparous* | Adjusted2 HR for fractures risk across ethnicity (White, Black, Hispanic, Asian and American Indian) | 2-4 children: 0.94(0.90-0.99), 1.10(0.82-1.46), 0.85(0.60-1.20), 1.25(0.84-1.87), 1.09(0.35-3.42), p = nd≥5 children: 0.95(0.90-1.00), 1.13(0.84-1.54), 0.81(0.56-1.16), 1.65(1.06-2.56), 1.43(0.44-4.61), p = nd | Parity is associated to a lower risk for fracture in white parous with 2-4 children and a higher risk for fracture in asian parous with ≥5 children |
| Paganini-Hill et al., J Womens Health, [18]Grade B | Prospective, (The Leisure World Cohort Study), United-State | Hip, wrist and spine fractures | 8877, postmenopausal, (73±7.4) | 20 | 6549 parous vs. 2308 nulliparous | - Incidence of hip, wrist, spine fracture on whole studied population- Adjusted3 HR in compared groups for hip, wrist, spine fracture risk | 0.83(0.72-0.95), 0.91(nd), 0.98(nd),p = nd | Parity is associated to a significant lower risk for hip fracture |
| Taylor et al., J Am Geriatr Soc, [19]Grade B | Prospective, (Study of Osteoporotic Fractures), United State | Hip fracture | 6787, postmenopausal, (73.3±4.9) | 10.1±3.2 | 5558 parous* vs. 1229 nulliparous | - Incidence of hip fracture on whole studied population-Adjusted4 HR in compared groups (with and without BMD) for hip fracture risk | 8.9%With BMD: 1.28(1.06-1.55)Without BMD : 1.25(1.04-1.51) p = nd | Nulliparity is associated to a significant higher risk for hip fracture |
| Hillier et al., J Bone Miner Res, [20]Grade B | Prospective, (Study of Osteoporotic Fractures), United-State | Non traumatic hip, spine, and wrist fractures | 9699, postmenopausal, (72.9±5.6 for nulliparous and 71±5.2 for parous) | 3 | 7864 parous* vs. 1835 nulliparous | - Incident of hip, spine and wrist fracture on whole studied population- Adjusted5 HR in compared groups (with and without BMD) for hip, spine and wrist fracture risk | 6.1%, 4%, 6.5%With BMD : 1.44(1.17-1.78), 1.14(0.85-1.52) and 0.86(0.69-1.09)Without BMD : 1.44(1.17-1.78), 1.09(0.82-1.45) and 0.87(0.69-1.09),p = nd | Nulliparity is associated to a significant higher risk for hip fracture |
| Bjørnerem et al., J Bone Miner Res, [21]Grade B | Prospective, (Tromsø Study), Norway | Hip and wrist fractures | 4681, postmenopausal, (63.9) | 14.5 | - 4230 parous vs. 451 nulliparous* | - Incidence of hip, fragility and wrist fractures on the whole studied population- Adjusted6 HR in compared groups for hip and wrist fracture risk | 9.4%, 13.2%1.04(0.75-1.46),p = 0.89;and 1.20(0.96-1.51),p = 0.80 | -Parity is notassociated to the risk for hip and wrist fracture |
| Kauppi et al., Osteoporosis Int, [22]Grade B | Prospective, (Mini-Finland Health Survey study), Finland | Hip fracture | 2028, postmenopausal, (63.2±9.2) | 17 | 1633 parous vs. 395 nulliparous* | - Incidence of hip fracture on the whole studied population- Adjusted7 RR in compared groups for hip fracture risk | 6.5%1-2 children: 0.85(0.55-1.32)≥3 children: 0.5(0.32-0.79)p = nd | Only parity ≥3 birth is associated to a significant lower risk of hip fracture |
| Trémollieres et al., J Bone Miner Res, [23]Grade B | Prospective, (Menopause et Os Cohort Study), French | Spine and hip fractures | 2651, (756 premenopausal and 1895 postmenopausal, (54±4) | 13.4 | 2416 parous vs. 235 nulliparous* | -Incidence of fracture on the whole studied population- BMD adjusted8 HR in compared groups for spine and hip fracture risk | 15.6%2 children: 0.68(0.42-1.11) and 0.66(0.36-1.22),≥3 children: 0.44(0.26-0.76) and 0.52(0.27-1.00),p = nd | Only parity ≥3 birth is associated to a significant lower risk for spine fracture |
| Hundrup et al., Eur J Epidemiol, [24]Grade B | Prospective, Denmark, The Danish Nurse Cohort Study | Hip fracture | 14015 postmenopausal, (≥50) | 6 | 11120 parous vs 2762 nulliparous* | - Non adjusted HR in compared groups for hip fracture risk | 0.87 (0.66-1.15),p = 0.323 | Parity is notassociated to the risk for hip and wrist fracture |
| Naves et al., Osteoporosis Int, [25]Grade B | Prospective, (European Vertebral Osteoporosis Study), Spain | Vertebral and no vertebral osteoporotic fractures | 255, postmenopausal, (65±9) | 8 | - 212 Parous vs. 38 nulliparous* | - Incident of osteoporotic fracture on the whole studied population- Adjusted9 OR in compared groups for osteoporotic fracture risk | 12.1%0.60(0.20-1.78) | Parity is not associated with the risk for osteoporotic fracture |
| Petersen et al., Ann Epidemiol, [15]Grade B | Prospective, (The Danish Twin Survey Study), Denmark | Hip fracture | 1708, postmenopausal, 75 (66-99) | 29.11 | - 523 parous 1-2 birth* vs. 293 nulliparous and vs. 352 parous 3-4 birth | -Incidence of hip fracture on whole studied population- Non adjusted HR in compared groups for hip fracture risk | 18.7%Nulliparity: 1.28(0.98-1.68)3-4 children: 0.88(0.65-1.19)p = nd | Parity is not associated to the risk for hip fracture |
| Honkanen et al., Osteoporosis Int, [26]Grade B | Prospective, (Kuopio Osteoporosis Risk Factor and Prevention Study), Finland | Distal forearm fracture | 11798, (3775 premenopausal and 8023 postmenopausal), (52.3±2.9) | 5 | 10488 parous vs. 1310 nulliparous* | -Incidence of forearm fracture on whole studied population- Adjusted10 HR in compared groups for distal forearm fracture risk | 3.1%0.71(0.52-0.97),p = 0.031 | Parity is associated to a significant lower risk for distal forearm fracture |
| Fujiwara et al., J Bone Miner Res, [27]Grade B | Prospective, (Adult Health Study), Japan | Hip fracture | 2987, postmenopausal, (58.6±11.6) | 14 | 1353 parous 1-2 children* vs. 254 nulliparous and vs. 923 parous 3-4 children and vs. 403 parous ≥5 children | Adjusted11 RR in compared groups for hip fracture risk | Nulliparity: 2.31(0.60-7.76)3-4 children: 1.26(0.51-3.39)≥5 children: 2.53(1.07-6.68)p = nd | Parity ≥5 children is associated to a higher risk for hip fracture |
| Hwang et al., Osteoporos Int, [28]Grade C | Cross-sectional, (Korea National Health and NutritionExamination Survey) South Korea | Vertebral fracture | 1222 postmenopausal, (62.8±8.8) | 2 | 444 parous <3 births* vs 778 parous ≥3 births | Adjusted12 OR in compared groups for hip fracture risk | 0.999 (0.537-1.861) | Parity is not associated with a risk of vertebral fracture |
| Lambrinoudaki et al., Spine J, [29]Grade C | Cross-sectional study, Greece | Vertebral fracture | 454, postmenopausal,(56.8±7.1) | 5 | 378 parous vs. 68 nulliparous | Non adjusted OR in compared groups for vertebral fracture risk | Parity per one extra child : 0.968(0.69-1.34),p = 0.847 | Parity is not associated to the risk for vertebral fracture |
| Maghraoui et al., Bone, [30]Grade C | Cross-sectional study, Marocco | Vertebral fracture | 908, postmenopausal, (60.9±7.7) | 3 | (nd) parous vs. (nd) nulliparous* | - Percentage of vertebral fracture on the whole studied population- Non adjusted OR in compared groups for vertebral fracture risk | 42%1.093(1.008-1.186),p = 0.031 | Parity is associated to a significant higher risk for vertebral fracture |
| Allali et al., Maturitas, [31]Grade C | Cross-sectional, Marocco | Osteoporotic peripheral fracture | 730, postmenopausal, (59.4±7.6) | nd | 663 parous vs 67 nulliparous* | Adjusted13 OR in compared groups for osteoporotic peripheral fracture risk | 1-3 children: 1.40(0.70-2.80), p = 0.34-5 children: 1.10(0.53-2.28), p=0.7≥6 children: 0.85(0.39-1.80), p = 0.6 | Parity is not associated to the risk for peripheral fracture |
| Petersen et al., Ann Epidemiol, [15]Grade C | Cross sectional, (The Longitudinal Study of Aging Danish Twins 1995), Denmark | Hip fracture | 1215, postmenopausal, 80 (75-98) | 18 | -531 parous 1-2 birth* vs. 226 nulliparous and vs. 355 parous 3-4 birth | - Percentage of hip fracture on whole studied population- Non adjusted OR in compared groups for hip fracture risk | 77.3%Nulliparity: 1.18(0.69-2.02)3-4 children: 0.69(0.39-1.23)p = nd | Parity is not associated to the risk for hip fracture |
| Michaelsson et al., Am J Epidemiol, [32]Grade C | Cross sectional, case-control study,Sweden | Hip fracture | 4640, postmenopausal, (72.5±6.8 in cases and 70.5±7.7 in controls) | 3 | -3848 parous vs. 792 nulliparous* | - Percentage of hip fracture on whole studied population- Adjusted14 OR in compared groups for hip fracture risk | 28.6%1 child: 0.90(0.73-1.12),2 children: 0.75(0.62-0.91),3 children: 0.80(0.66-0.98), p = nd | Parity ≥2 children is protective for hip fracture |
| O'Neill et al., Osteoporos Int, [33]Grade C | Cross-sectional, (European Vertebral Osteoporosis Study), United-Kingdom | Vertebral deformity | 7530, postmenopausal, (67.3±7.9 in cases and 62.6±7.9 in controls) | Nd | - 6398 parous vs. 1132 nulliparous* | Adjusted15 OR in compared groups for vertebral deformity | 1.00(0.82-1.23),p = nd | Parity is not associated to the risk for vertebral deformity |
| Shin et al., J Bone Miner Metab, [34]Grade C | Retrospective, (Ansung community cohort study), Korea | Vertebral fracture | 1529, (314 premenopausal and 1215 postmenopausal), (59.1±8.7) | 2 | 687 parous ≥4 births vs. 809 parous <4 births* | - Percentage of vertebral fracture on the whole studied population- Age adjusted OR in compared groups for vertebral fracture risk | 14.8%0.93(0.65-1.32),p = nd | Parity is not associated to the risk for vertebral fracture |
| Wengreen et al., Osteoporos Int, [35]Grade C | Retrospective,Case control study,(Utah Study of Nutrition and Bone Health), United State | Hip fracture | 1779, postmenopausal, (76.7±9.1) | 5 | 1624 parous vs.155 nulliparous* | - Percentage of hip fracture on whole studied population- Adjusted16 OR in compared groups for hip fracture risk | 49.5%0.93(0.63-1.25),p = nd | Parity is not associated to the risk for hip fracture |
| Huo et al., Osteoporos Int, [36]Grade C | Retrospective,Case control study,China | Hip fracture | 354, postmenopausal, (67.1±8.3) | 2 | - 115 parous 1-2 birth* vs. 83 parous ≥5 birth and vs. 18 nulliparous | - Percentage of hip fracture on whole studied population- Adjusted17 OR in compared groups for hip fracture risk | 33.3%Nulliparity: 0.79(0.19 -3.25)≥5 children: 0.64(0.26-1.61)p = 0.49 | Parity is not associated to the risk of fracture |
| Cure-Cure et al., Int J Gynaecol Obstet, [37]Grade C | Retrospective, Columbia | All fracture | 1855, postmenopausal, (61.3±-8.3) | 5 | 1612 parous vs. 243 nulliparous* | - Percentage of fracture on whole studied population- Non adjusted OR in compared groups for all fracture risk | 22.9%0.41(0.28-0.61),p<0.000002 | Parity is associated with a significant lower risk for fracture |
| Parazzini et al., J Epidemiol Community Health, [38]Grade C | Retrospective,Cross sectional, (Italian case control study), Italia | Hip fracture | 796, postmenopausal, (66) | 10 | 632 Parous vs. 164 nulliparous* | Adjusted18 OR in compared groups for hip fracture risk | 0.8(0.5-1.4),p = 0.22 | Parity is not associated to a risk for hip fracture |
| Hoffman et al., Osteoporosis Int, [39]Grade C | Retrospective,case-control study, United-State | Hip fracture | 348, postmenopausal, (≥50) | 3 | - 233 parous vs. 115 nulliparous* | - Percentage of hip fracture on whole studied population- Adjusted19 OR in compared groups for hip fracture risk | 50%0.76(0.46-1.27),p = nd | Parity is not associated to the risk for hip fracture |
| Nguyen et al., J Clin Endocrinol Metab, [40]Grade C | Retrospective, (Dubbo Osteoporosis Epidemiology Study), Australia | Atraumatic fracture | 1091, postmenopausal, (70±7.2) | 5 | 990 parous* vs. 101 nulliparous | Adjusted20 OR in compared groups for no traumatic fracture risk | 1.10(1.01-1.19),p<0.01 | Nulliparity is associated to a significant higher risk for atraumatic fracture |
| Mallmin et al., Osteoporosis Int, [41]Grade C | Retrospective,case-control study, Sweden | Distal forearm fracture | 604, (94 premenopausal and 510 postmenopausal), (62.8±10.1) | 1 | - 515 parous vs. 89 nulliparous* | Adjusted21 OR in compared group for distal forearm fracture | 1.72(0.90-3.28),p = nd | -Parity is not associated to the risk for forearm fracture |
| Cumming et al., Int J Epidemiol, [42]Grade C | Retrospective,case-control study, Australia | Hip fracture | 311, postmenopausal, (≥65) | 2 | - 246 parous vs. 65 nulliparous* | - Percentage of hip fracture on whole studied population- Adjusted22 OR in compared groups for hip fracture risk | 55.9%0.56(0.17-1.88),p = nd | Parity is not associated to the risk for hip fracture |
| Alderman et al., Am J Epidemiol, [43]Grade C | Retrospective,case-control study, United-State | Hip and forearm fractures | 917, postmenopausal, (50-74) | 5 | - 734 parous vs. 183 nulliparous* | - Percentage of fracture on whole studied population- Adjusted23 OR in compared groups for hip and forearm fracture risk | 38.7%1.2(0.7-2.22),p = nd | Parity is not associated to the risk for hip and forearm fractures |