Correlation and Path Coefficient Analysis in Mid-Altitude Sesame (Sesamum indicum L.) Germplasm Collection of Ethiopia
*Corresponding Author(s):
Mohammed AbateCollege Of Dry Land Agriculture, Samara University, Samara, Ethiopia
Tel:+ 251 911815564,
Email:muhabate@gmail.com
Abstract
Keywords
INTRODUCTION
In Ethiopia, sesame is used as cash crop, export commodity, raw materials for oil industries and as source of employment opportunity. Now-a-days, it becomes the primary export oil crop playing a role in the agricultural Gross Domestic Product (GDP) of the country. A sizable proportion of the population, therefore, generates income from oil seed farming, trade and processing [4]. However, sesame production and extension in Ethiopia is quite limited, particularly because of its low yield. One of the major problems facing sesame production in Ethiopia has been growing of inferior varieties with low yield and poor quality. To overcome problems of the low productivity of sesame, there must be a sound procedure for selection of high yielding varieties adapted to the local environment [5].
Seed yield in sesame like other field crops is a multi facet character and direct selection or this trait may often be misleading. The components that determine the yield are best indices for selection. Therefore, knowledge of relationship between important yield traits and seed yield may help the researchers to identify suitable donors for a potential and successful breeding program [6]. Estimation of character associations could identify the relative importance of independent traits contributing to dependent ones and suggest up on the traits that may be useful as indicator for other traits. In other words, character associations between yield components can be used as the best guide for successful yield improvement by indirect selection. Achievement of such success depends upon sort and accuracy of estimated correlation coefficient, plant materials, environmental conditions and their interaction. Among several factors, yield related traits highly influence the amount of grain yield that can be obtained [7]. Some of the yield related traits in sesame include: days to flower, days to maturity, plant height, number of branches, capsules per plant, capsule length, number of seeds per capsule, thousand-seed weight and seed yield per plant. These traits affect yield positively and/or negatively and their effect on yield depends on the influence of environment on them.
The knowledge of nature and magnitude of genetic variability is of immense value for planning efficient breeding programme to improve the yield potential of crop species. Likewise, information on genetic association of plant traits with seed yield has great importance to breeder in selecting desirable genotypes [8]. Phenotypic selection of parents based on their performance alone may not always be reliable procedure since phenotypic expression is highly influenced by environmental factors, which are non-heritable. It is therefore essential to select genotypes on the basis of their genetic worth [7]. Thus, correlation helps in selection of superior genotype from diverse genetic populations [9]. However, in correlation studies indirect associations become more complex and confusing but path analysis can avoid this complication by measuring the direct influence of one trait on other as well as permits the partitioning of a given correlation coefficients into its components of direct and indirect effects [9,10]. The path coefficient analysis is an effective means of analyzing direct and indirect causes of association and permits critical examination of the specific traits that produce a given correlation. It provides information about magnitude and direction of direct and indirect effect of the yield components [11,12].
However, lack of information (particularly agro-ecological based) on character association of yield and its contributing traits, believed to limit the genetic improvement of sesame in Ethiopia. Hence, the present investigation was focused to gather adequate information on genetic association of yield and yield related traits in sesame accessions collected from mid-altitude areas of Ethiopia.
MATERIALS AND METHODS
Description of the study site
Experimental materials and design
|
No. |
Genotype |
Altitude |
Region |
No. |
Genotype |
Altitude |
Region |
|
1. |
Am-NSh-1 |
1395 |
Amhara North Shoa |
42. |
SNNP-2 |
1300 |
North Omo |
|
2. |
Oromia-1 |
1500 |
East Wollega |
43. |
SNNP-3 |
1290 |
Bench-Maji |
|
3. |
Oromia-2 |
1395 |
East Wollega |
44. |
SNNP-4 |
1310 |
North Omo |
|
4. |
Oromia-3 |
1640 |
West Wellega |
45. |
Am-NG-2 |
1460 |
Amhara North Gonder |
|
5. |
Oromia-4 |
1520 |
West Wellega |
46. |
Oromia-13 |
1610 |
Bale Zone |
|
6. |
Am-NG-1 |
1635 |
Amhara North Gonder |
47. |
Oromia-14 |
1560 |
Jimma Zone |
|
7. |
Am-SW-1 |
1590 |
Amhara South Wollo |
48. |
Oromia-15 |
1500 |
Jimma Zone |
|
8. |
Oromia-5 |
1580 |
Bale |
49. |
Am-NG-3 |
1440 |
Amhara North Gondr GG Gonder |
|
9. |
Oromia-6 |
1680 |
Bale |
50. |
Am-NG-4 |
1440 |
Amhara North Gondr GG Gonder |
|
10. |
Oromia-7 |
1565 |
Arsi |
51. |
Am-NW-16 |
1630 |
Amhara North Wollo |
|
11. |
Oromia-8 |
1560 |
Arsi |
52. |
Tigray-1 |
1400 |
Debubawit |
|
12. |
Am-SW-2 |
1673 |
Amhara South Wollo |
53. |
Am-SW-9 |
1570 |
Amhara South Wollo |
|
13. |
Am-SW-3 |
1565 |
Amhara South Wollo |
54. |
Am-NG-5 |
1530 |
Amhara North Gonder |
|
14. |
Am-SW-4 |
1440 |
Amhara South Wollo |
55. |
Oromia-16 |
1600 |
East Wollega |
|
15. |
Am-SW-5 |
1462 |
Amhara South Wollo |
56. |
Oromia-17 |
1690 |
Arsi Zone |
|
16. |
Am-SW-6 |
1624 |
Amhara South Wollo |
57. |
Oromia-18 |
1700 |
East Harrarge |
|
17. |
Am-NW-1 |
1522 |
Amhara North Wollo |
58. |
Oromia-19 |
1630 |
East Harrarge |
|
18. |
Am-NW-2 |
1270 |
Amhara North Wollo |
59. |
Tigray-2 |
1650 |
Debubawit |
|
19. |
Am-NW-3 |
1400 |
Amhara North Wollo |
60. |
Tigray-3 |
1640 |
Debubawit |
|
20. |
Am-NW-4 |
1450 |
Amhara North Wollo |
61. |
Oromia-20 |
1560 |
East Wollega |
|
21. |
Am-NW-5 |
1430 |
Amhara North Wollo |
62. |
Am-SW-10 |
1540 |
Amhara South Wollo |
|
22. |
Am-NW-6 |
1700 |
Amhara North Wollo |
63. |
Am-SW-11 |
1500 |
Amhara South Wollo |
|
23. |
Am-NW-7 |
1550 |
Amhara North Wollo |
64. |
Am-SW-12 |
1660 |
Amhara South Wollo |
|
24. |
Am-NW-8 |
1580 |
Amhara North Wollo |
65. |
Oromia-21 |
1570 |
West Wellega |
|
25. |
Am-NW-9 |
1645 |
Amhara North Wollo |
66. |
Oromia-22 |
1435 |
West Harrarge |
|
26. |
Am-NW-10 |
1555 |
Amhara North Wollo |
67. |
Oromia-23 |
1450 |
West Harrarge |
|
27. |
Am-NW-11 |
1490 |
Amhara North Wollo |
68. |
Oromia-24 |
1500 |
West Harrarge |
|
28. |
Am-NW-12 |
1460 |
Amhara North Wollo |
69. |
Oromia-25 |
1380 |
Illubabor |
|
29. |
Am-NW-13 |
1500 |
Amhara North Wollo |
70. |
Oromia-26 |
1380 |
Illubabor |
|
30. |
Am-NSh-2 |
1395 |
Amhara North Shoa |
71. |
Oromia-27 |
1462 |
Illubabor |
|
31. |
Am-NW-14 |
1640 |
Amhara North Wollo |
72. |
Am-NG-6 |
1335 |
Amhara North Gonder |
|
32. |
SNNP-1 |
1520 |
Gurage Zone |
73. |
Am-NG-7 |
1360 |
Amhara North Gonder |
|
33. |
Oromia-9 |
1635 |
Jimma |
74. |
Am-NG-8 |
1360 |
Amhara North Gonder |
|
34. |
Oromia-10 |
1590 |
East Wollega |
75. |
Am-NG-9 |
1445 |
Amhara North Gonder |
|
35. |
Oromia-11 |
1680 |
East Harrarge |
76. |
Am-NG-10 |
1470 |
Amhara North Gonder |
|
36. |
Oromia-12 |
1580 |
East Wollega |
77. |
Tigray-4 |
1534 |
Mirabawit |
|
37. |
Am-NSh-3 |
1565 |
Amhara North Shoa |
78. |
Tigray-5 |
1545 |
Mirabawit |
|
38. |
Am-NSh-4 |
1560 |
Amhara North Shoa |
79. |
T-85 |
- |
Standard Check |
|
39. |
Am-SW-7 |
1673 |
AmharaSouth Wollo |
80. |
E |
- |
Standard Check |
|
40. |
Am-SW-8 |
1565 |
AmharaSouth Wollo |
81. |
Tate |
- |
Standard Check |
|
41. |
Am-NW-15 |
1440 |
Amhara North Wollo |
|
|
|
|
Experimental materials and design
Data collection
DATA ANALYSIS
Analysis of variance was carried out for the data with SAS statistical software (9.2); to test for significant differences among the genotypes according to the standard statistical procedure described by Gomez & Gomez [13].
Phenotypic and genotypic correlations between agro-morphological traits were estimated using the method described by Miller et al. [14], as follows:
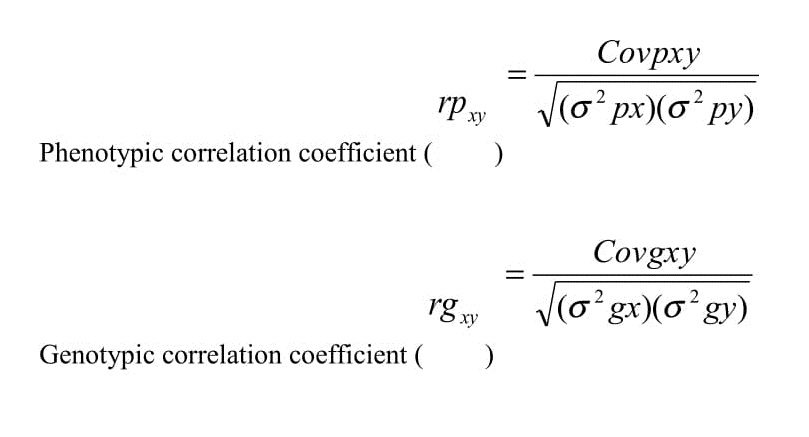
The correlation coefficient was analyzed based on the tabulated data, using META-R version-6.01 [15]. The path coefficient analysis was computed for 12 yield related traits using the phenotypic and genotypic correlation results following the procedure suggested by Dewey and Lu [16]. Seed yield per plant was used as dependent character in path coefficient analysis and the remaining traits were used as independent variables.
Rij = Pij + ΣrikPkj
Where, rij is mutual association between the independent character (i) and dependent traits (j) as measured by correlation coefficients, pij is components of direct effects of the independent traits (i) on the dependent traits (j), ?rikPkj = summation of components of indirect effect of a given independent character (i) on the dependent traits (j) via all other independent traits (k).
The residual effect (R) was computed using the formula suggested by Dewey and Lu [16] as:
R = √1-R2 Where, R2 = Σrijpij
RESULTS AND DISCUSSION
Analysis of variance and mean performance of genotypes
|
Trait |
Rep (1) |
Block (8) |
Gen (72) |
Error (72) |
CV (%) |
SE |
|
Days to flowering |
4.17 |
19.88 |
17.57* |
7.87 |
2.76 |
2.03 |
|
Days to maturity |
1.04 |
14.7 |
12.72* |
5.83 |
1.57 |
1.91 |
|
No. of Pr. branches |
3.56 |
4.17 |
8.53* |
5.27 |
25.25 |
2.29 |
|
No. of capsules/plant |
0.01 |
79.53 |
428.83* |
184.03 |
13.74 |
10.55 |
|
No. of seeds/capsule |
111.5 |
18.44 |
17.46* |
6.98 |
6.5 |
2.08 |
|
Capsule length (cm) |
0.04 |
0.1 |
0.08* |
0.07 |
10.6 |
0.27 |
|
Plant height (cm) |
1063.12 |
262.38 |
242.88** |
115.17 |
8.78 |
10.73 |
|
Biomass/plant (g) |
9.18 |
1.05 |
3.12** |
1.51 |
19.67 |
1.17 |
|
Harvest index (%) |
235.45 |
41.34 |
83.26** |
29.96 |
6.29 |
4.77 |
|
1000 seed weight (g) |
0.57 |
0.07 |
0.13* |
0.06 |
11.29 |
0.21 |
|
Seed yield/plant (g) |
9.98 |
1.05 |
3.13** |
1.46 |
24.63 |
1.14 |
|
Seed yield/ha (kg) |
24545.89 |
2575.81 |
7846.69** |
3651.85 |
24.65 |
57.06 |
|
Oil content (%) |
0.83 |
11.71 |
8.11* |
3.35 |
2.54 |
1.2 |
Mean performance of 81 sesame genotypes for 13 traits (data not shown) showed that seed yield per plant was ranged from (2.6g) for Oromia-9 to (8.6g) for Oromia-22 with over all mean of 5.33g/plant. Generally, 44% of the genotypes had greater mean seed yield than the overall mean of genotypes. The highest mean seed yield/plant was recorded for Oromia-22 (8.66g) followed by Am-NW-13 (8.41g), Am-SW-5 (8.23), Oromia-25 (7.62g), Am-NW-14 (7.60g), Am-SW-10 (7.53) and Oromia-1 (7.51g). These genotypes were found to be superior even to the local checks. The highest and lowest mean oil content was recorded for Oromia-13 (52.15%) and Am-SW-7 (43.35%) genotypes, respectively, with overall genotypes mean of 47.1%. The genotype Oromia-13 (52.15%) and Am-NSh-2 (51.20%) had the highest mean oil content and was found to be superior as compared to the standard checks. A high variation in number of capsules/plant, primary branches/plant and plant height was found among the studied genotypes. Similarly, high variation in number of primary branches, plant height and 1000 seed weight was reported by Gidey et al. [17].
CORRELATION COEFFICIENT
|
Trait |
DF |
DM |
PBPL |
CPPL |
SDCP |
CL |
PH |
BMPL |
HIPL |
TSW |
SYPL |
SYH |
OC |
|
DF |
0.69*** |
0.05 |
-0.02 |
-0.04 |
-0.13* |
-0.03 |
-0.01 |
0.01 |
0.09 |
-0.01 |
-0.01 |
-0.05 |
|
|
DM |
0.70*** |
0.05 |
0.03 |
0 |
-0.09 |
0.02 |
0.02 |
0.03 |
0.04 |
0.02 |
0.02 |
-0.02 |
|
|
PBPL |
0.06 |
0.1 |
0.35*** |
-0.04 |
0.01 |
0.25*** |
0.27*** |
0.21*** |
0.06 |
0.27*** |
0.27*** |
-0.04 |
|
|
CPPL |
-0.02 |
0.04 |
0.42*** |
0.13* |
0.15** |
0.33*** |
0.79*** |
0.73*** |
0.11 |
0.79*** |
0.79*** |
0.01 |
|
|
SDCP |
0 |
0.08 |
-0.01 |
0.24* |
0 |
0.08 |
0.48*** |
0.53*** |
0.22*** |
0.48*** |
0.48*** |
-0.07 |
|
|
CL |
-0.08 |
-0.09 |
0.04 |
0.22 |
0.03 |
0 |
0.13* |
0.16** |
-0.01 |
0.13* |
0.13* |
-0.04 |
|
|
PH |
0.01 |
0.03 |
0.38** |
0.46*** |
0.30* |
0 |
0.28*** |
0.22*** |
0.03 |
0.28*** |
0.28*** |
0 |
|
|
BMPL |
0.02 |
0.05 |
0.31* |
0.83*** |
0.53*** |
0.21 |
0.43*** |
0.94*** |
0.60*** |
1.00*** |
1.00*** |
-0.11* |
|
|
HIPL |
0.05 |
0.05 |
0.25* |
0.78*** |
0.57*** |
0.24 |
0.37** |
0.96*** |
0.62*** |
0.94*** |
0.94*** |
-0.13* |
|
|
TSW |
0.17 |
0.06 |
0.07 |
0.21 |
0.24* |
-0.01 |
0.06 |
0.65*** |
0.62*** |
0.60*** |
0.60*** |
-0.21* |
|
|
SYPL |
0.02 |
0.05 |
0.31* |
0.83*** |
0.53*** |
0.21 |
0.43*** |
0.99*** |
0.96*** |
0.65*** |
1.00*** |
-0.11* |
|
|
SYP |
0.02 |
0.05 |
0.31* |
0.83*** |
0.52*** |
0.22 |
0.42*** |
0.98*** |
0.96*** |
0.65*** |
1.00*** |
-0.11* |
|
|
OC |
-0.02 |
-0.01 |
0.06 |
0.16 |
-0.06 |
-0.02 |
0.03 |
-0.08 |
-0.12 |
-0.06 |
-0.08 |
-0.08 |
Generally, correlation analysis revealed the presence of highly significant positive association between seed yield and the yield related traits such as number of capsules, biomass/plant, harvest index, 1000 seed weight and number of seeds/capsule. This finding is in line with [18,19,22,24] who reported significant positive correlations between yield traits and final seed yield in sesame.
Path coefficient analyses
The result of phenotypic path analysis (Table 4) revealed that biomass/plant (1.08) had maximum positive direct effect on seed yield/plant followed by harvest index (0.75) and capsules/plant (0.53). Similarly, at genotypic level (Table 5), biomass/plant (0.64), capsules/plant (0.60) and harvest index (0.34) imposed highest direct effect on seed yield/plant. These traits also had strong positive correlation with seed yield at both phenotypic and genotypic level. Therefore, these traits can be considered as the principal traits while selecting for seed yield. In other words, selection indices may be formed by considering all these traits for improvement of seed yield. This result was in agreement with previous studies on association of traits in sesame accessions of different countries [26-29]. The traits viz., 1000 seed weight (0.90), capsules/plant (0.85), harvest index (0.80) and number of seeds/capsule (0.73) showed maximum indirect effects on seed yield at phenol typiclevel. Thousand seed weight and seeds/capsule also showed high indirect effect at genotypic level (Table 5). Therefore, this finding strongly emphasized that these two traits (1000 seed weight and seeds/capsule) made the greatest indirect contribution to seed yield. However, both these traits had negative direct effect to seed yield/plant at phenotypic level, suggesting that direct selection in favor of these traits can affect seed yield. This result agreed with those of [29,30].
|
Trait |
DF |
DM |
PBPL |
CPPL |
SDCP |
CL |
PH |
BMPL |
HIPL |
TSW |
OC |
PR |
|
DF |
0.02 |
0 |
0 |
0.01 |
0 |
0 |
0 |
0.03 |
0.01 |
-0.04 |
0 |
0.02 |
|
DM |
0.01 |
0 |
0 |
-0.02 |
-0.01 |
0 |
0 |
0.07 |
0.01 |
-0.02 |
0 |
0.05 |
|
PBPL |
0 |
0 |
0.01 |
-0.17 |
0 |
0 |
0 |
0.43 |
0.05 |
-0.02 |
0.01 |
0.31 |
|
CPPL |
0 |
0 |
0 |
0.53 |
-0.1 |
-0.02 |
-0.37 |
0.85 |
0.17 |
-0.25 |
0.02 |
0.83 |
|
SDCP |
0 |
0 |
0 |
-0.1 |
-0.16 |
0 |
0 |
0.73 |
0.12 |
-0.06 |
-0.01 |
0.53 |
|
CL |
0 |
0 |
0 |
-0.09 |
0 |
-0.04 |
0 |
0.29 |
0.05 |
0 |
0 |
0.21 |
|
PH |
0 |
0 |
0 |
-0.19 |
-0.05 |
0 |
0 |
0.59 |
0.08 |
-0.02 |
0 |
0.43 |
|
BMPL |
0 |
0 |
0 |
-0.04 |
-0.09 |
-0.01 |
0 |
1.08 |
0.21 |
-0.17 |
-0.01 |
0.99 |
|
HIPL |
0 |
0 |
0 |
-0.31 |
-0.09 |
-0.01 |
0 |
0.8 |
0.75 |
-0.16 |
-0.01 |
0.96 |
|
TSW |
0 |
0 |
0 |
-0.08 |
-0.04 |
0 |
0 |
0.9 |
0.13 |
-0.26 |
-0.01 |
0.65 |
|
OC |
0 |
0 |
0 |
-0.06 |
0.01 |
0 |
0 |
-0.11 |
-0.03 |
0.02 |
0.1 |
-0.1 |
Table 4: Direct (diagonal) and indirect effect (off diagonal) of quantitative traits on seed yield/plant at phenoltypic level in 81 sesame genotypes.
Note: Residual = 0.15
|
Trait |
DF |
DM |
PBPL |
CPPL |
SDCP |
CL |
PH |
BMPL |
HIPL |
TSW |
OC |
GR |
|
DF |
-0.01 |
0 |
0 |
-0.01 |
-0.01 |
0 |
0 |
-0.01 |
0 |
0.02 |
0 |
-0.01 |
|
DM |
0 |
0 |
0 |
0.01 |
0 |
0 |
0 |
0.01 |
0 |
0.01 |
0 |
0.02 |
|
PBPL |
0 |
0 |
0 |
0.1 |
-0.01 |
0 |
0 |
0.17 |
-0.02 |
0.01 |
0 |
0.27 |
|
CPPL |
0 |
0 |
0 |
0.6 |
0.02 |
0 |
0 |
0.2 |
-0.05 |
0.02 |
0 |
0.79 |
|
SDCP |
0 |
0 |
0 |
0.04 |
0.13 |
0 |
0 |
0.31 |
-0.04 |
0.04 |
0 |
0.48 |
|
CL |
0 |
0 |
0 |
0.04 |
0 |
0.02 |
0 |
0.08 |
-0.01 |
0 |
0 |
0.13 |
|
PH |
0 |
0 |
0 |
0.1 |
0.01 |
0 |
0 |
0.18 |
-0.02 |
0.01 |
0 |
0.28 |
|
BMPL |
0 |
0 |
0 |
0.23 |
0.06 |
0 |
0 |
0.64 |
-0.07 |
0.12 |
0 |
0.99 |
|
HIPL |
0 |
0 |
0 |
0.22 |
0.07 |
0 |
0 |
0.2 |
0.34 |
0.12 |
0 |
0.94 |
|
TSW |
0 |
0 |
0 |
0.03 |
0.03 |
0 |
0 |
0.27 |
-0.05 |
0.31 |
0 |
0.6 |
|
OC |
0 |
0 |
0 |
0 |
-0.01 |
0 |
0 |
-0.07 |
0.01 |
-0.04 |
0 |
-0.11 |
Table 5:Direct (diagonal) and indirect effect (off diagonal) of quantitative traits on seed yield/plant at genotypic level in 81 sesame genotypes.
Note: Residual = 0.13DF = Days to Flowering, DM = Days to Maturity, PBPL = Number of Primary Branches/ Plant, CPPL = Number of Capsules/Plant, SDPC = Number of Seeds/Capsule, CL = Capsules Length, PH = Plant Height, BMPL = Biomass/Plant, HIPL = Harvest Index/Plant, TSW = 1000 Seed Weight, SYPL = Seed Yield/Plant and OC = Oil Content.
CONCLUSION
ACKNOWLEDGMENT
REFERENCES
- Sharma E, Islam TS, Khan F (2014) A review enlightening genetic divergence in Sesamum indicumbased on morphological and molecular studies. Int J Agric Crop Sci 7: 1-9.
- Pham TD, Geleta M, Bui TM, Bui TC, Merker A, et al. (2011) Comparative analysis of genetic diversity of sesame (Sesamum indicum L.) from Vietnam and Cambodia using agro-morphological and molecular markers. Hereditas 148: 28-35.
- Bradley JM (2002) Food, industrial, nutraceutical, and pharmaceutical uses of sesame genetic resources. In: Trends in New Crops and New Uses. Janick J, Whipkey A. (eds.). ASHS Press, Alexandria, Virginia, USA.
- Abate M, Mekbib F, Ayana A, Negussie M (2015) Genetic variability and association of traits in mid-altitude sesame (Sesamum indicum L.) germplasm of Ethiopia. American J E A 9: 1-14.
- Tadele A (2005) Sesame (Sesamum indicum L.) Research in Ethiopia: A review of past work and potential and future prospects. Sesame and Safflower Newsletter 20.
- Kumaresan D, Nadrajan N (2002) Association of yield with some biometrical and physiology characters over different environments in sesame (Sesamum indicum L.). Sesame and Safflower Newsletter 17: 13-16.
- Salah B, Ahmed M, Abubakri FA (2013) Variability of yield and some morphological traits in some sesame (Sesamum indicum L.) genotypes under rain-fed conditions. Int J Agri Sci Res 2: 54-59.
- Parameshwarappa SG, Palakshappa MG, Salimath PM, Parameshwarappa KG (2009) Studies on genetic variability and character association in germplasm collection of sesame (Sesamum indicumL.). Karnataka J Agric Sci 22: 252-254.
- Jogdhande S, Vijay SK, Nagre K (2017) Correlation and Path Analysis Study in cowpea [Vigna unguiculata (L.) Walp.] genotypes. Int J Cur Micr Appl Sci 6: 3305-3313.
- Manisha RP, Vijay SK, Madhavi BB, Jadhav RD (2018) Correlation and path analysis study in F5 generation of cowpea. Int J Cur Micr Appl Sci 6: 1529-1537.
- Chaudhary RR, Joshi BK (2005) Correlation and path coefficient analyses in sugar cane. Nepal Agriculture Research Journal 6: 24-28.
- Bizeti HS, de Carvalho CGP, de Souza JRP, Destro D (2004) Path analysis under multicollinearity in soybean. Braz Arch Biol Technol 47.
- Gomez KA, Gomez AA (1984) Statistical procedure for agricultural research (2nd edn). John Wiley & Sons, New York, USA.
- Miller PA, Williams JC, Robinson HF, Comstock RF (1958) Estimates of genotypic and environmental variances and covariances in upland cotton and their implications in selection. Agronomy Journal 50: 126-131.
- Alvarado G, Lopez M, Vargas M, Pacheco A, Rodríguez F, et al. (2017) META-R (Multi Environment Trail Analysis with R for Windows) Version 6.01. CIMMYT, Mexico.
- Dewey DR, Lu KH (1959) A correlation and path-coefficient analysis of components of crested wheat grass seed production. Agronomy Journal 51: 515-518.
- Gidey YT, Kebede SA, Gashawbeza GT (2013) Assessment of genetic variability, genetic advance, correlation and path analysis for morphological traits in sesame genotypes. Int J Pl Breeding and Genetics 7: 21-34.
- Muhamman MA, Mohammed SG, Lado A, Belel MD (2010) Interrelationship and path coefficient analysis of some growth and yield characteristics in sesame (Sesamum indicum L.). J Agric Sci 2: 100-105.
- Haruna IM, Aliyu L, Olufajo OO, Odion EC (2012) Contributions of some growth characters to seed yield of sesame (Sesamum indicum L.). ISABB J Food and Agric Sci 2: 9-14.
- Sumathi P, Muralidharan V, Manivannan N (2007) Trait association and path coefficient analysis for yield and yield attributing traits in sesame (Sesamum indicum L). Madras Agric J 94: 174-178.
- Sumathi P, Murlidharan V (2010) Analysis of genetic variability, association and path analysis in the hybrids of sesame (Sesamum indicum L.). Tropical Agric Res Ext 13: 63-67.
- Daniya E, Dadari SA, Ndahi WB, Kuchinda NC, Babaji BA (2013) Correlation and path analysis between seed yield and some weed and quantitative components in two sesame (Sesamum indicumL.) varieties as influenced by seed rate and nitrogen fertilizer. Biology Agriculture and Healthcare 3.
- Onginjo EO, Ayiecho PO (2009) Genotypic variability in sesame mutant lines in Kenya. African Crop Science Journal 17: 101-107.
- Tamina B, Tapash D (2011) Effect of mutagenes on character association in sesame (Sesamum indicum L.). Pakistan J Bot 43: 243-251.
- Bhatt GM (1973) Significance of path coefficient analysis in determining the nature of character association. Euphytica 22: 383-393.
- Mothilal A (2005) Correlation and path analysis in sesame (Sesamum indicum L.). Environmental Eco.
- Ahadu M (2008) Genetic variability and association of characters in sesame (Sesamum indicum L.) Genotypes. Thesis Submitted to the Department of Plant Sciences, Haramaya University, Ethiopia. Pg no: 20-43.
- Goudappagoudra R, Lokesha R, Ranganatha ARG (2011) Trait association and path coefficient analysis for yield and yield attributing traits in sesame (Sesamum indicum L.). Elect J Plant Breeding, 2: 448-452.
- Ibrahim SE, Khidir MO (2012) Genotypic correlation and path coefficient analysis of yield and some yield components in sesame (Sesamum indicum L.). Int J Agric Sci 2: 664-670.
- Azeez MA, Morakinyo J A (2011) Path analysis of the relationships between single plant seed yield and some morphological traits in sesame. Int J Pl Breeding and Genetics 5: 358-368.
Citation: Abate M (2018) Correlation and Path Coefficient Analysis in Mid-Altitude Sesame (Sesamum indicum L.) Germplasm Collection of Ethiopia. J Plant Sci Curr Res 2: 006.
Copyright: © 2018 Mohammed Abate, et al. This is an open-access article distributed under the terms of the Creative Commons Attribution License, which permits unrestricted use, distribution, and reproduction in any medium, provided the original author and source are credited.