A Framework for Solving the Optimal Screening Interval for Tuberculosis
*Corresponding Author(s):
Rui PengDonlinks School Of Economics And Management, University Of Science And Technology, Beijing, China
Tel:+86 13051540519,
Email:pengrui1988@ustb.edu.cn
Abstract
Tuberculosis is one of the major threats to human health. Regular screening is helpful for early detection of the infection, which can make treatment easier and also prevent from unintended infection to others. A model is constructed to depict the infection of tuberculosis and solve the optimal screening interval which minimizes a cost function. Illustrative examples are presented.
Keywords
INTRODUCTION
In this paper, we construct a model to depict the infection of tuberculosis and calculate the total cost associated with a specific screening interval. The total costs include the following three components: 1) the cost of screening, 2) the cost associated with treatment if an individual is infected and 3) the cost associated with onward transmission between the time of infection and the time of treatment. Optimal screening which minimizes the cost function is solved for illustrative examples.
The remainder of the paper is written as follows. Section 2 outlines the assumptions and notations used in our models. Section 3 features the main description of the models. Numerical examples are given in section 4. Finally, section 5 concludes the paper.
NOTATIONS AND ASSUMPTIONS
Notations
She had been regularly attending the antenatal consultations with no risk factors identified. Her prenatal laboratory results were unremarkable except for GBS-unknown. She had three normal obstetric ultrasounds (one of each trimester); her blood type was A+. Pregnancy was uneventful with no history of vomiting, blood loss or abdominal trauma.
On admission at the delivery unit, the obstetric ultrasound revealed no fetal movements with the presence of heart beat. The Cardiotocograph (CTG) was not tranquilizing as it showed prolonged deceleration and reduced variability with pathological trace that suggested a sinusoidal pattern and, as a result, an emergent caesarean section was performed (Figure 1).A baby boy was born weighing 2610g. The newborn had a circular of the umbilical cord around the arms. On examination at birth, he was markedly pale and hypotonic with respiratory depression. Orothracheal intubation and connection to mechanical ventilation was immediately performed. He responded well and was extubated 4 minutes after and transferred to the neonatal unit with oxygen directly to his face, for further evaluation and management. The Apgar score was 5/8/8.
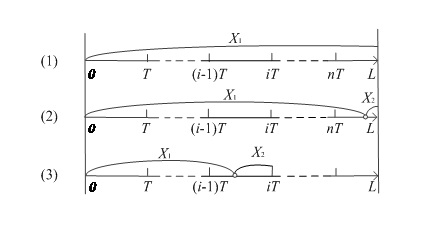
Figure 1: Three scenarios considered under the perfect inspection assumption.
Initial blood gas from the umbilical cord revealed pH 7.27, pCO2 50.6 mm Hg, Hemoglobin 4.4, g/dL, bicarbonate 21.9 mmol/L and lactates 5.8 mmol/L. Laboratory exams revealed 4.0 g/dL of hemoglobin, white blood cell count of 47.700/10 EXP 9/L with 22.7% neutrophils (10.800), platelets count 183.000/10 EXP 9/L, DHL 680 UI/L, CK 190 UI/L. Further laboratory evaluation was unchanged (bilirubin, cardiac enzymes and C reactive protein). Coombs test and viral serology for Parvovirus B19 and Cytomegalovirus were negative. Hemoglobin electrophoresis showed a presence of 5% fetal hemoglobin on mother’s blood. Kleihauer-Betke test was performed, since it is a more specific exam and quantifies the amount of blood transfusion. It revealed 17.8% of fetal red cells in maternal circulation, which corresponds to a volume of approximately 890 mL of fetal blood based on the formula: (% of fetal cells determined by Kleihauer-Betke test/100) X 5000 mL = volume of FMH (in mL) [3] and also according to the fact that 1% of fetal erythrocytes in maternal circulation is equivalent to a fetal hemorrhage of 50mL [4].
Two red blood cell transfusions were made and at 12 hours of life his hemoglobin was 13.3 g/dL, white blood cells count of 10.100/uL (Neutrophils: 64.4%), platelets count of 219.000/uL and erythroblasts 87/100 leucocytes.
The outcome was favorable with hemodynamic and respiratory stability and absence of abnormal movements. Cranial ultrasonography showed, in the 3rd day of life, frontal bilateral parenchymal hyperechogenicity, was not present on 11th day of life as the ultrasounds were made by two different physicians. The authors admit that the hyperechogenicity have not been valorized by the second physician.
Follow-up at 2 and 4 months revealed a normal physical and neurological examination. L - The random variable for the exposure period
h(L) The probability density function of the exposure period
H(L) The cumulative density function of the exposure period
M - The upper limit of the exposure period
T - The periodic screening interval
n - The maximum number of screenings per person
&lamda; - The rate of meeting people
N - Expected number of people in a crowded area
r - The proportion of infected people in the population
p - The probability of infection
Cs - The cost of each screening
Cc - The treatment cost as a function as the infection time and delay time between infection to detection
Co - The cost associated with onward transmission
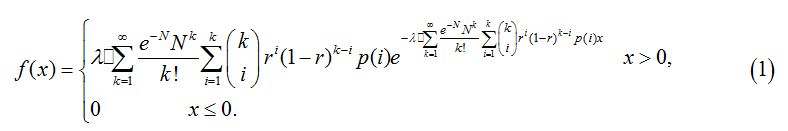
X - The random variable for the time of infection
f(X) - The probability density function of the time of infection
F(X) - The cumulative density function of the time of infection
Assumptions
• The exposure period follows a distribution in a given interval
• A person meets others with rate per unit time. The number of people it meets is poisson distributed with parameter N. The infection probability p is an increasing function of the number of infected people in the area
• The proportion of infected people in the population is . For simplicity, it is assumed that all and only the infected people are in bacilliferous state
• A screening occurs every time units, costs units and requires negligible time
• A person can only be infected at most once throughout the exposure period
• Once a person is identified as being infected, screening stops for him (or her) and treatment is initiated. Also, the person will not infect others, as it either not meet others or it meets others with a mask
MODELS
Based on assumptions, it can be concluded that the infection rate for a healthy person is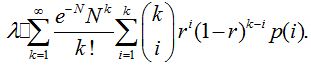
If X is the time of infection, the probability density function of X is
The length of the exposure period has a truncated distribution derived from life tables established by the China life insurance industry. This distribution is an approximation of the real age distribution of the population from birth to a given age. It can be converted to other forms to match different populations.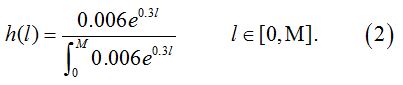
As shown in figure 1, we consider three scenarios in this model and n=[l/T] is a variable representing the maximum number of screenings per person. The expected cost of every scenario is specified as follows.
1. Scenario (1): Never infected throughout the exposure period
As shown in figure 1, there is a probability p(X>L) that an individual never gets infected throughout the exposure period. The only cost for such an individual is the cost of screening, which is written as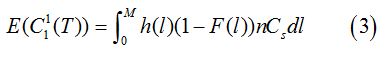
2. Scenario (2): Infected after the last screeningIf a person is infected at some time later than the last screening received, then the infection cannot be detected. Therefore, the costs incurred include the cost of screening and the cost of onward transmission, but no treatment cost. The probability of this scenario is P(nT<x<l) hence,="" the="" expected="" cost="" is<br="">
Where, Co is the burden to society if one more person is infected with tuberculosis.
3. Scenario (3): Infected before the last screening
Based on the assumption of perfect inspection, if an infection occurs before the last screening, it will be detected at the first screening following infection. The number of screenings is [x/T]+1 since screening stops after treatment. The costs in this scenario include the cost of screening, the cost of treatment and the cost of onward transmission from the time of infection to the time of detection. The expected cost is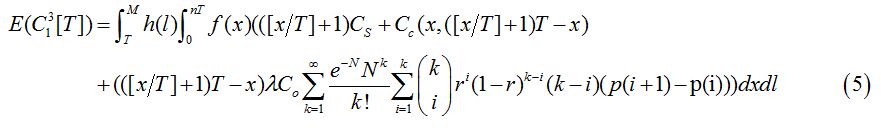
Overall, we combine the costs of the three scenarios to get the expected total cost function:
The optimal screening interval can be determined by minimizing the total cost.
CONCLUSION
In this paper, a framework is proposed to solve the optimal screening interval for tuberculosis. The total cost associated with a specific screening interval include screening cost, treatment cost and the burden to the society if one gets infected and further infect others. In the future, the forms of the functions involved in this model need to be figured out and their parameters need to be estimated. In addition, it is interesting to consider not only tuberculosis, but all the major types of infectious and non-infectious diseases to solve the optimal interval for body checking.
ACKNOWLEDGEMENT
This work was partially supported by the NSFC under Grant 71231001, 71301009, 71420107023.
REFERENCES
- Famewo EB, Clarke AM, Afolayan AJ (2017) Ethno-medicinal documentation of polyherbal medicines used for the treatment of tuberculosis in Amathole District Municipality of the Eastern Cape Province, South Africa. Pharm Biol 55: 696-700.
- Kim J, Lee KS, Kim EB, Paik S, Chang CL, et al. (2017) Early detection of the growth of Mycobacterium tuberculosis using magnetophoretic immunoassay in liquid culture. Biosens Bioelectron 96: 68-76.
- Engels EA, Shen M, Chapman RS, Pfeiffer RM, Yu Y-Y, et al. (2009) Tuberculosis and subsequent risk of lung cancer in Xuanwei, China. Int J Cancer 124: 1183-1187.
- Peng R, Liu B, Zhai Q, Wang W (2017) Optimal maintenance strategy for systems with two failure modes. Reliab Eng Syst Safe. In Press.
- Li P, Wang W, Peng R, (2015) Age-based Replacement Policy with Consideration of Production Wait Time. IEEE T Reliab 65: 235-247.
- Wang H, Wang W, Peng R (2017) A two-phase inspection model for a single component system with three-stage degradation. Reliab Eng Syst Safe 158: 31-40.
- Liu X, Wang W, Peng R (2015) An integrated production, inventory and preventive maintenance model for a multi-product production system. Reliab Eng Syst Safe 137: 76-86.
Citation: Ma X, Zhang X, Peng R (2017) A Framework for Solving the Optimal Screening Interval for Tuberculosis. J Infect Non Infect Dis 3: 025.
Copyright: © 2017 Rui Peng, et al. This is an open-access article distributed under the terms of the Creative Commons Attribution License, which permits unrestricted use, distribution, and reproduction in any medium, provided the original author and source are credited.