Altitudinal Variation in Soil Microbial Population and Associated Soil Properties in Long Term Soil Fertility
*Corresponding Author(s):
Khuma Kumari BhusalGokuleshwor Agriculture And Animal Science College, Tribhuvan University, Baitadi, Nepal
Tel:+9779811195928,
Email:bhusalkhuma2@gmail.com
Abstract
The purpose of this research was to analyze soil samples from different altitudes of Nepal to know about their physical, chemical and biological properties; including the content of N, P, K, O, C, pH and population of bacteria, fungus and Azotobacter.
Materials and Methods
Soil sample assessment on “Altitudinal Variation in Soil Microbial Population and Associated Soil Properties in Long Term Soil Fertility Trial” was carried out on 3 different altitudes; Terai (Agriculture Research Station, Parwanipur, Bara), Mid-hills (Regional Agriculture Research Station, Pakhribas, Dhankuta) and High-hills (Agriculture Research Station, Bijaynagar Jumla). There were 7 treatments in Jumla, 7 treatments in Pakhribas and 12 treatments in Parwanipur which were replicated thrice. Soil samples were taken after harvesting rice and the soil was subjected to determination of microbial population such as (Azotobacter, fungus and bacteria) along with soil chemical properties.
Results and Discussion
The highest pH (6.49) was obtained from T4 (130:50:50NPK + 6FYM) at Jumla and the least in case of Pakhribas treatments. The organic matter content in Jumla (high-hills) was very low except in T2 (70:10:10NPK + 6FYM) and T5 (160:70:70NPK + 6FYM) which was 1.005%. The nitrogen was very high (0.803%) in Jumla having T4 (130:50:50NPK + 6FYM), medium to high in Pakhribas and very low 0.035% in T6 (100:0:30NPK) to high 0.385% in T9 (10 mt FYM) at Parwanipur. The highest amount of K obtained from control condition at Jumla was 136.36 kg/ha from T7. Potassium content was very low in Parwanipur i.e. < 20 kg/ha K2O in all treatments. Fungus and bacteria was present in every altitude but the Azotobacter was only found on lower altitude.
Conclusion
The overall microbial population was highest in Parwanipur but decreased with increase in altitude. Among soil microbe’s Bacterial population was highest in all altitudes. Maintainance of Azotobacter in higher altitude is necessary to sustain food production.
Keywords
Altitude; Microbial population; NPK; Soil properties; Treatments.
Introduction
Agriculture is both the foundation of the Nepalese economy and the people's primary means of income. Almost 66% of total population still depends on agriculture and contributes about 31.2% in GDP but the annual growth rate is only 1.1% during the year 2073/074. It is clear that development of agriculture has an immense role in reducing poverty, uplifting living standard with ensuring food security of a country. Nepal is a country with vast geographic diversity. It raises from 59 masl plain/Terai, to world highest 8845masl Mount Everest. The three regions of Nepal Terai, Mid-hill and Mountain covered 23%, 42% and 35% land area of Nepal. The climate, topography, vegetation and soil can differ in each region and altitude. The diversity in nature provides an opportunity for agriculture diversification [1].
Soil is the lower surface material of the earth that consists of organic and inorganic components. The importance of soil and the role it serves is undeniable. Soil is a living entity that has to be handled and sustained in a long-term approach. Soils are highly complex systems in terms of vast range of constituents with very high heterogeneity [2].Soils with different physical, chemical and biological composition are available to a particular place. The yield of plant depends upon the types of soil and properties of soil to fully nourish the plant. Soil is home for all organisms prevalent in earth.
Soil fertility and its importance
Soil fertility is the component of soil productivity that is concerned with status of available nutrients, and its capacity to supply nutrients from its reserve source of its own and through supplement from other sources for crop production. Soil fertility is manageable soil property and its management is very important for optimizing plant nutrition on short-term and long-term basis to accomplish sustainable crop production. In contrast, soil fertility is complex soil property. The good natural and improved soil fertility is utmost importance for successful cropping. It is the basic ground wall on which all input based high production systems can be created.
Soil productive capacity depends on often complicated and sometimes little understood interaction between the physical, chemical and biological properties of soil. The crop yield can be optimized by good farm management practice to improve various components along with these soil properties in some eco-friendly ways. The management of required nutrients in a soil is a best practice of soil management that considers soil organic matter, soil structure, and improvement of thriving soil microbes [3].
Nutrients are essential for crop production and the soil is regarded as fertile if required amounts of nutrients for plants are available in soil. All plants require nutrients to grow and a significant portion of the nutrients are removed and exported when a crop is harvested. The depleted nutrients are replaced with synthetic fertilizers, manures, compost, etc. basically 16 essential elements are required for plant growth. These nutrients are divided into 2 categories: macro-nutrients and micro-nutrients. Plant can get macro-nutrients C, H, O from water and atmosphere and are not regarded as limiting for crop production. The remaining macro-nutrients absorbed in large quantities derived from soil and external applications are N, P, K, Ca, S, and Mg. The micro-nutrients such as Mo, B, Cl, Cu, Zn, Mn, and Fe are absorbed in small amount but have every important role in soil fertility. Whether the required nutrient is small or large quantity, if plant does not have a sufficient supply the growth of plant will be retarded [4].
Soil fertility status in Nepal
The depletion of soil fertility is a major problem of low crop productivity. The loss of soil fertility is mainly due to inappropriate cultivation practices, slope land agriculture, haphazard use of chemical fertilizers and low organic amendments. Soil fertility in Nepal is not that much poor but have some options to improve fertility to increase crop production.
The samples collected from 9827 farm land soil samples and analyzed by 5-regional soil testing laboratories and the soil testing and service action of the department of agriculture in 1988/1999, revealed that 48.2% of the samples were medium in N content [5] Similarly, 7520 samples were analyzed and found that 64% had low organic matter content. As nitrogen and OM are required for plant growth, these figures reveal a serious soil infertility problem in Nepal. The K content however was at medium to high level, and only 35% of the samples analyzed for phosphorus showed low levels [6]. The recent data revealed by Soil Management Directorate 2017 showed that soil pH of Nepal was 41.9% slightly acidic, 30.4% nearly neutral, 15.4% acidic, 10.8% alkaline and 1.5% highly acidic. Similarly, the test of soil from different places of Nepal revealed that 54% of the soil samples have very low organic matter content, 44% of the soil contains low amount of organic matter and 5% of soil contains medium amount of organic matter. Nitrogen content in soil of Nepal showed that 1% of soil with high Nitrogen, but 50% soil contains very low Nitrogen, 37% soil contains low amount of Nitrogen and 13% soil contains medium percent of Nitrogen.
Similarly, phosphorus and potassium content was very low to very high in Nepal. 26% of soil contains very high phosphorus, 22% of soil contains high phosphorus and 10%, 26%, 16% of soil was very low, low and medium phosphorus content respectively. Potassium content in soil of Nepal showed that 8% soil was very high and 12% of soil was high in potassium and 12% 24% and 43% of soil was very low, low and medium amount of potassium [7].
Role of microbial population in soil fertility
Soil is the place where billions of organism inhabiting during part or all of its life. Soil organism which are present in the pores of soil are size of sub-microscopic and microscopic, plays important role in making a soil as living and dynamic system. The physical and chemical characteristics of soil determine the nature of the environment in which vast number of the organism especially soil microorganism are found. Soil organisms include both macro (Rodents, earthworm, termites, etc.) and microorganism (Bacteria, fungi, actinomycetes, protozoa, etc.). Soil organism helps in decomposition of organic residues, mixing soil organic matter minerals by churning, carry out number of nutrient transformation, making nutrient available to plants such as N, P, S etc., degradation of toxic substances and other different biological reaction such as biological nitrogen fixation helps to make fertile and productive soil. Therefore, there is a great role of soil microorganism in making lively ecosystem [8].
Soil microorganisms are the group of microorganism for which the soil is natural habitat. They play an important role in the cycle of organic matter, soil formation and soil fertility. Soil microorganism are present in high number in highly fertile soil that poorly fertile soil. In a fertile soil microorganism constitute a large part of the on this planet i.e. 1g of soil contain billion or more living organisms. Soil microorganism may be either prokaryotes (Bacteria, actinomycetes, blue green algae) and eukaryotes (Fungi, protozoa, microscopic algae) can be seen with the help of microscope. Also, they may be heterotrophs, autotrophs, aerobes and anaerobes. The presence of soil microorganism varies with change [9-12] in soil pH, temperature, and osmotic pressure, presence of organic matter and use of organic and inorganic substances. They have their own requirement to exist in type and nature and soil. Consequently, the soil organism and their population differs in season such as summer and winter, differs in horizons such as A- horizon and B-horizon, and presence of host or vegetation. By knowing the nature and behavior of soil some of the microorganisms can be used as bio-fertilizers, bio-pesticides therefore they can act on availability of nutrients, synthesis of antibiotics, vitamins, enzymes etc. that can increase the soil fertility and then soil productivity [9].
Attitudinal definition of climatic condition provide specific types of vegetation and soil environment that could influence soil microbial population, which in turn may affect mineralization, availability of plant nutrients or affect in microbial residues. However, there is a limited information and data about variation in microbial population in different altitudes. As we know that, both biotic and abiotic factors such as temperature, vegetation type, water content, pH, soil type, soil depth, organic carbon and microbial composition influence microbial communities but the influence of altitude variation is still insufficiently investigated. Some studies in different parts of the world shows that altitude induces environmental conditions have been reported to influence soil microbial communities in mountains. Fungal biomass decreased with increase in altitudes. In cold temperature negative correlation between bacterial population and altitude was [10] reported. There is a significant increase in the abundance of fungi and bacteria on lower altitudes
Materials And Methods
In this research, soil samples were collected from different altitude of Nepal and analyze their physical, chemical and biological properties. N, P, K, OC, pH and population of Bacteria, Fungus and Azotobacter were analyzed by standard and commonly used lab technique. Lab work was conducted in HICAST Laboratory Kalanki, Kathmandu.
Experimental detail
Description of study area
The field research was conducted in 3 Regional Agriculture Research Stations under NARC with different altitudes having different climatic variation from 2016/17.
Agro meteorological features
Agriculture research station bijaynagar, jumla (2514 masl)
Bijaynagar, Jumla is the high hill Agriculture Research Station located at 2514 Masl. Jumla lies in 280 58" to 290 30" N latitude and 810 51" to 820 35" E longitude with an area of 2,531 sq km, altitude varies from 2,134 to 6,424 m, annual average rainfall of 800 mm, maximum temperature of 30° c in June and minimum temperature of up to -14° c in January and relative humidity of 51 to 73% during the year. Total land area in Jumla is 2, 54,365 ha of which 16% is cultivable whereas rice occupies about 19% of the cultivated land.
Regional agriculture research station pakhribas dhankuta (1200 masl)
Pakhribas Dhankuta is the mid-hill Regional agriculture research station. Its altitude ranges from 1100-2000 m above from sea level. The station occupies 1840 Ropani (92 ha) and has average rainfall of 1600 mm annually, minimum temperature ranges 21 from 4.9-9.6 degree Celsius and maximum temperature ranges from 14.3-27 degree Celsius.
Regional agriculture research station (RARS), parwanipur, bara (115 Masl)
RARS, Parwanipur is situated in the tropical region of Nepal. The average maximum temperature ranges from 22.7oC to 34.52oC and minimum temperature ranges from 8.54oC to 25.9oC with an average annual rainfall of 1550mm. RARS extended over a land area of 60 ha. It is located near Birgunj city at 27o 2’ North latitude, 84o 53’ east longitude and 115 masl elevations.
Treatments
Treatment combinations of 3 different altitudes are as follows (table 1):
|
Treatment No.
|
Vijaynagar, Jumla
|
Pakhribas, Dhankuta
|
Parwanipur, Bara
|
|
T1 |
40:0:0NPK (kg/ha) +6 -ton FYM
|
Full control |
Control |
|
T2 |
70:10:10NPK (kg/ha) +6 - ton FYM
|
50:15:15 NPK (kg/ha)
|
100:0:0NPK (kg/ha)
|
|
T3 |
100:30:30NPK (kg/ha) +6 -ton FYM
|
9 ton compost |
100:30:0NPK (kg/ha)
|
|
T4 |
130:50:50NPK (kg/ha) +6 -ton FYM
|
25:7.5:7.5 NPK (kg/ha)+4.5 ton compost
|
100:0:30NPK (kg/ha)
|
|
T5 |
160:70:70NPK (kg/ha) +6 -ton FYM
|
25:7.5:7.5 NPK (kg/ha) |
100:30:30NPK (kg/ha)
|
|
T6 |
30 -ton FYM
|
4.5 ton compost
|
100:0:30NPK (kg/ha)
|
|
T7 |
Control |
12.5:3.75:3.75 NPK (kg/ha) |
50:0:0NPK (kg/ha)
|
|
T8 |
- |
- |
50:20:0 NPK (kg/ha)
|
|
T9 |
- |
- |
10 –ton FYM
|
|
T10 |
- |
- |
100:30:30NPK (kg/ha),ZnSO4 25 (kg/ha) - |
|
T11 |
- |
- |
50:0:0NPK (kg/ha),10 – ton FYM
|
|
T12 |
- |
- |
50:0:0NPK (kg/ha)10 ton Compost
|
Table 1: Treatments used in Jumla, Dhankuta and Bara.
Field layout
Field was laid out in a Randomized Complete Block Design (RCBD).
Soil sample collection
- soil samples were collected from three locations representing three different Composite altitudes.
- The soil sample was taken with the help of augur.
- The sampled soil was made free from stone, plant debris, weed seed and any other inert materials.
- Finally, the required volume of air dried soil sample was kept in a plastic bag and tagged.
- For microbial analysis the soil was kept in a refrigerator.
Soil analysis
The soil sample collected from different altitude of Regional Agricultural Research Stations was analyzed by performing different lab techniques. Soil chemical and microbial properties were analyzed. 7 treatments were taken from Pakhribas, Dhankuta and Jumla research stations and 12 treatments were taken from parwanipur, Bara reaearch station. The soil sample was air dried and then grinded and sieved with 232mm of mesh wire net and then the prepared soil was used for lab analysis. For microbial analysis the soil sample was collected and stored in refrigerator.
Analysis of soil chemical properties
Soil pH
The most common technique for determining pH is with a pH meter, using glass rod and reference electrodes. Buffer of pH 4.0 and 9.2 was used to calibrate pH meter. The ratio of soil and water for determination of pH was 1:2.
Organic matter (%)
Oxidizable organic matter in the soil in oxidized by chromic acid in the presence of sulphuric acid, the reaction being facilitated by the heat of dilution when 2 volumes of concentrated H2SO4 are mixed with 1 volume of 1N K2Cr2O7 solution. The excess chromic acid is determined [13-15] by titration with ferrous ammonium sulphate solution and the quantity of the substance oxidized is calculated from the amount of dichromate reduced. Walkley-black method used for determining soil organic matter (SOM).
Total nitrogen (N)
The standard Kjeldahl method is used for determining total N in soils involves the digestion of soil sample with a catalyst in concentrated sulphuric acid, converting the organic N to NH4+ , and then determining the concentration of NH4+.
Available phosphorus (P)
The phosphorus present in the soil was analyzed through Modified Olsen’s bicarbonate method. This method uses 0.5 NaHCO3 solution of pH 8.5 as an extractant which controls the activity of Ca, Al and Fe by precipitating calcium as carbonate and aluminium and iron as hydroxides. The soil available phosphorus
Content in the sample was chlorostanous reduced by Molybdophosphoric blue color 24 method. The blue color was measured by spectrophotometer at 690 nm. Firstly, standard curve was prepared by the help of working standard and through the help of standard curve the available phosphorus content of the sample was determined.
Total potassium (K)
Exchangeable K or Soil available potassium is determined by extracting 1N neutral ammonium acetate and detected by flame photometer method by using the reagents such as Molar neutral ammonium acetate solution, Standard potassium solution, Working standard solution as shown in (figure 1).
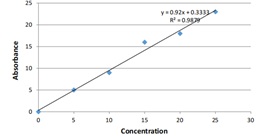 Figure 1: Standard Curve of Potassium.
Analysis of soil microbial population
Media preparation
It is important to prepare media for the culture of microorganisms. 3 different media were prepared to grow Bacteria, fungus and azotobacter.
a) 39.10 gram of Nutrient agar (NA) was dissolved in 1000 ml of distilled water used to culture bacteria.
b) 44.0 gram of Potato Dextrose agar (PDA) was dissolved in 1000 ml distilled water used to culture fungus.
c) 28.0 gram of Jenson’s Media was dissolved in 1000 ml distilled water used to culture azotobacter.
All these media were autoclaved at 121°C for 15 minutes and left it to cool.
Dilution series
Serial dilution method of counting the microorganism is the most reliable technique of counting the viable microorganism in any given sample. In this method sample are diluted to various concentrations and are plated on media that supports the growth of the micro-organisms. This method is somewhat more time consuming, but provides statistically accurate results. This method is also the ideal method for enumerating microorganisms in a given population because it only identifies the living organisms in that population. A gram of soil contains thousands of microorganisms therefore it is difficult to determine microbial population of soil without serial dilution or lowering the population of microorganisms by serial dilution method.
Serial dilution was done in 6 test tubes; 1st test tube contains 9ml distilled water and 1 g soil, then carefully drawn 1ml of solution using sterile pipette from 10-1 and will be add to the test tube leveled with 10-2 and up to 10-6as shown in (figure 2).
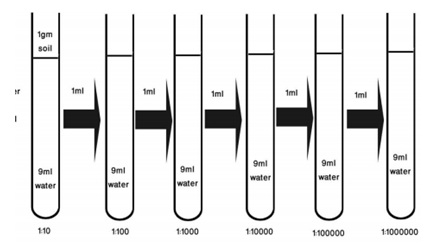 Figure 2: Serial dilution of soil for determination of soil microbes.
Inoculation and incubation
Incubation is the important step in microbial population determination from which the microbes starts to grow. For inoculation sterile test tubes, sterile distil water, sterile pipette, sample 1 gm are required.
- For bacteria 0.5 ml serial diluted solution from 10-5 was poured in a petri-plate and 1/3 part of the petri-plate was filled with nutrient agar.
- For fungus 0.5 ml serial diluted solution from 10-4 was poured in a petri-plate and 1/3 part of the petri-plate was filled with PDA.
- For azotobacter 0.5 ml serial diluted solution from 10-2 was poured in a Petri-plate and 1/3 part of the Petri-plate was filled with Jenson’s media.
- The inoculums were spreaded all over the Petri dish using inoculums rod or loop. Replicating 2-4 times gives accurate result.
- Each of the Petri dish was tagged with corresponding dilution factor. Tagging was done on the bottom of the Petri dish.
- Petri dish was covered with lid and sealed with parafilm tape.
- Petri dish was incubated on upside down position. The temperature of incubation differs from microorganism to microorganism. Generally, most of the microorganism grows well in 28 – 35°C.
- After 2-3 days of microbial growth, colony was counted. The colonies are formed only by viable microorganism. Thus it is called Colony forming unit (CFU).
- Reading was taken from 2nd, 3rd and 4th day.
Microbial count
After completion of colony counting average of microbial colony was made and colony was calculated to get microbial population. To calculate the number of microorganisms per ml of diluted sample uses the following equation:
Number of CFU / (Volume plated (ml) x dilution factor)
Statistical analysis
The data were recorded, tabulated in MS-Excel. The tabulated data was analyzed by using GenStat. Treatment means were compared using least significant difference (LSD) test at P < 0.05. Means of each other within the parameter were compared by Duncan’s Multiple Range Test at 5% Level of significance. Apart from this Correlation Coefficient and regression analysis was done.
Results And Discussion
Soil properties from 3 different altitudes were observed. The observed data was interpreted with different research papers related to it and discussed further.
Soil chemical properties
Soil pH
Soil pH is determined by the concentration of hydrogen ions. It is a measure of the soil solution acidity and alkalinity, on a scale from 0 – 14. Acidic solution has a pH less than 7, while alkaline solutions have a pH greater than 7. The effect of pH is on nutrient availability and aluminum and manganese toxicity, individual plants and soil organisms vary in their tolerance to basic and acid soil condition .The pH value of soil of different altitude having different treatments area as follows (table 2).
|
Treatment No. |
Treatment |
pH Value |
|
T1 |
40:0:0NPK (kg/ha) + 6-ton FYM |
6.36 |
|
T2 |
70:10:10NPK (kg/ha) + 6-ton FYM |
6.16 |
|
T3 |
100:30:30NPK (kg/ha) + 6-ton FYM |
6.33 |
|
T4 |
130:50:50NPK (kg/ha) + 6-ton FYM |
6.49 |
|
T5 |
160:70:70NPK (kg/ha) + 6-ton FYM |
6.34 |
|
T6 |
30 ton FYM
|
6.4 |
|
T7 |
Control |
6.36 |
|
Grand Mean |
6.35 |
|
Table 2: Effect of Different Treatments on Soil pH at Jumla (2514masl).
The pH was slightly acidic in all treatments of Jumla The pH value of treatment T4 (130:50:50NPK (kg/ha) + 6-ton FYM) and T6 (30-ton FYM) was found 29 to be higher i.e. 6.4 and lower in case of T2 (70:10:10NPK (kg/ha) + 6-ton FYM) i.e. 6.16. The pH value was almost similar (6.3) in T1 (40:0:0NPK (kg/ha) + 6-ton FYM), T3 (100:30:30NPK (kg/ha) + 6-ton FYM), T5 (160:70:70NPK (kg/ha) + 6-ton FYM) and T7 (Control condition) as shown in (table 3)
|
Treatment No. |
Treatment |
pH Value |
|
T1 |
Full Control |
4.4 |
|
T2 |
50:15:15 NPK (kg/ha) |
4.5 |
|
T3 |
9 ton compost |
4.76 |
|
T4 |
25:7.5:7.5 NPK (kg/ha) +4.5ton compost |
4.55 |
|
T5 |
25:7.5:7.5NPK (kg/ha) |
4.49 |
|
T6 |
4.5ton compost |
4.98 |
|
T7 |
12.5:3.75:3.75 NPK (kg/ha) |
4.55 |
|
Grand Mean |
4.6 |
|
Table 3: Effect of Different Treatments on Soil pH at Pakhribas (1200masl).
The pH value of Pakhribas soil was found acidic. The pH value of treatment T1 (Full control) and T5 (25:7.5:7.5NPK (kg/ha)) was found highly acidic i.e. 4.4. The pH value of T6 (4.5ton compost) was 4.98. The pH value of T2 (50:15:15 NPK (kg/ha)), T4 (130:50:50NPK (kg/ha) +6-ton FYM), and T7 (12.5:3.75:3.75 NPK (kg/ha)) was almost same i.e. 4.5. And pH value of T3 (9ton compost) was 4.76. The soil pH was slightly acidic to acidic (Table 5) in Parwanipur. The pH of treatments T1 (control), T9 (10-ton FYM) and T10 (100:30:30NPK (kg/ha), ZnSO425 (kg/ha)) was found slightly acidic i.e. 6.06, 6.05, and 6.4 respectively. The pH values of other treatments T2(100:0:0NPK (kg/ha)), T3(100:30:0NPK (kg/ha)), T4(100:0:30NPK (kg/ha)), T5(100:30:30NPK (kg/ha)), T6(100:0:30NPK (kg/ha)), T7(50:0:0NPK (kg/ha)), T8(50:20:0NPK (kg/ha)), T11(50:0:0NPK (kg/ha),10 FYM) and T12(50:0:0NPK (kg/ha) 10-ton Compost) was found in the range of 5.3 – 5.9 as shown in (Figure 4)
|
Treatment No. |
Treatment |
pH Value |
|
T1 |
Control |
6.06 |
|
T2 |
100:0:0NPK (kg/ha) |
5.8 |
|
T3 |
100:30:0NPK (kg/ha |
5.9 |
|
T4 |
100:0:30NPK (kg/ha) |
5.8 |
|
T5 |
100:30:30NPK (kg/ha) |
5.8 |
|
T6 |
100:0:30NPK (kg/ha) |
5.3 |
|
T7 |
50:0:0NPK (kg/ha) |
5.9 |
|
T8 |
50:20:0NPK (kg/ha) |
6.05 |
|
T9 |
10-ton FYM |
6.4 |
|
T10 |
100:30:30NPK (kg/ha), ZnSO4 25 (kg/ha) |
5.8 |
|
T11 |
50:0:0NPK (kg/ha), 10-ton FYM |
5.9 |
|
T12 |
50:0:0NPK (kg/ha), 10-ton CWS |
5.6 |
|
Grand Mean |
|
5.85 |
Table 4: Effect of Different Treatments on Soil pH at Parwanipur (115masl)
The data of 3 different ecological regions showed that the pH was decreasing in order from higher altitude to lower. There was not a big change in soil pH in all altitudes. The overall pH value of Jumla (high-hill) was around 6 but the pH was decreased to 4 in Pakhribas (mid-hill) condition and the pH was slightly raised in Parwanipur (Terai) i.e. around 5-6. Similar type of research was conducted by NARC in different altitude of western Nepal showed that the pH was increasing in order of higher to lower altitude. The pH was observed from 40 samples from each altitude collected randomly at 0-20cm depth as shown in (table 4).
Soil organic matter content
The highest percentage of organic matter (1.005) in soil was found from T2 (70:10:10NPK (kg/ha) +6-ton FYM) and T5 (160:70:70NPK (kg/ha)) followed by T3 (100:30:30NPK (kg/ha) +6-ton FYM) was 0.9715%. Similar OM% i.e. 0.938 in case of T1 (40:0:0NPK (kg/ha) +6 FYM), T4 (130:50:50NPK (kg/ha) +6-ton FYM) and T6 (30FYM). Least (0. 9045%) organic matter was obtained at T7 (Control condition) (table 5)
|
Treatment No. |
Treatment |
pH Value |
|
T1 |
40:0:0NPK (kg/ha) +6 -ton FYM |
0.938 |
|
T2 |
70:10:10NPK (kg/ha) + 6-ton FYM |
1.005 |
|
T3 |
100:30:30NPK (kg/ha) +6-ton FYM |
0.9715 |
|
T4 |
130:50:50NPK (kg/ha) + 6-ton FYM |
0.938 |
|
T5 |
160:70:70NPK (kg/ha) + 6-ton FYM |
1.005 |
|
T6 |
30-ton FYM |
0.938 |
|
T7 |
Control |
0.9045 |
|
Grand Mean |
0.96 |
|
Table 5: Effect of Different Level of Treatments on Soil organic matter (OM %) at Jumla (2514masl).
The OM% was decrease in Pakhribas than that of Jumla soil condition. The OM was found to be highest in Treatments containing 25:7.5:7.5NPK (kg/ha) (T5) and of 4.5ton compost (T6) followed by T2 (50:15:15 NPK (kg/ha)) and T4 (25:7.5:7.5 NPK (kg/ha) + 4.5ton compost). Treatments T1 (Control), and T7 (12.5:3.75:3.75 NPK (kg/ha)) contain 0.2345% organic matter. 0.268% of organic matter was found in T3 (9ton compost).32 as shown in (table 6)
|
Treatment No. |
Treatment |
OM% |
|
T1 |
Full control |
0.2345 |
|
T2 |
50:15:15 NPK (kg/ha) |
0.402 |
|
T3 |
9 ton compost |
0.268 |
|
T4 |
25:7.5:7.5 NPK (kg/ha) +4.5ton compost |
0.402 |
|
T5 |
25:7.5:7.5NPK (kg/ha) |
0.4355 |
|
T6 |
4.5 ton compost |
0.4355 |
|
T7 |
12.5:3.75:3.75 NPK (kg/ha) |
0.2345 |
|
Grand Mean |
|
0.34 |
Table 6: Effect of Different Level of Treatments on Soil Organic Matter (OM %) at Pakhribas (1200masl).
The data regarding organic matter percentage in Parwanipur soil was very low. The least % of OM was found in control condition or no application of treatments (T1). The highest percent of OM was found from T6 with the application of 100:0:30NPK (kg/ha) followed by T11 with the application of 50:0:0NPK (kg/ha) and 10-ton FYM and lowest in case of treatment T2 (only N). T4 (100:0:30NPK (kg/ha)), T5 (100:30:30NPK (kg/ha)), T8 (50:20:0NPK (kg/ha)) don’t differ significantly. The organic matter obtained from T9 (10 t FYM) was 0.469%. T3 (100:30:0NPK (kg/ha)) and T12 (50:0:0NPK (kg/ha) 10-ton compost) treatment combination shows almost similar organic matter content (0.5695) (table 7).
|
Treatment No. |
Treatment |
OM% |
|
T1 |
Control |
0.0335 |
|
T2 |
100:0:0NPK (kg/ha) |
0.402 |
|
T3 |
100:30:0NPK (kg/ha) |
0.5025 |
|
T4 |
100:0:30NPK (kg/ha) |
0.536 |
|
T5 |
100:30:30NPK (kg/ha) |
0.536 |
|
T6 |
100:0:30NPK (kg/ha) |
0.603 |
|
T7 |
50:0:0NPK (kg/ha) |
0.4355 |
|
T8 |
50:20:0NPK (kg/ha) |
0.536 |
|
T9 |
10 ton FYM |
0.469 |
|
T10 |
100:30:30NPK (kg/ha), ZnSO425 (kg/ha) |
0.535 |
|
T11 |
50:0:0NPK (kg/ha), 10 ton FYM |
0.603 |
|
T12 |
50:0:0NPK (kg/ha), 10 ton CWS |
0.5695 |
|
Grand Mean |
|
0.48 |
Table 7: Effect of Different Level of Treatments on Soil Organic Matter (OM %) at Parwanipur (115masl).
Similar type of research article showed that increasing trend of soil organic matter from lower to higher altitude. The SOM content (%) was increasing with altitude in this investigation. Atmospheric temperature is the main climatic variable which control SOC at cold region. Higher precipitation in the form of snow at high altitude than lower altitude and subzero temperature causes hyper aridity of soil at high altitude and suppression of microbial and enzymatic activities which results least soil organic matter decomposition that make higher accumulation of SOC [16]. Hence, increasing trends of SOM content (%) with increasing altitude may be due to the constant carbon inputs and decrease rate of carbon loss at different altitude. The OM% was in increasing order from lower to higher altitude. The decreasing from lower to higher altitude might be the cause of this trend of OM% [17-20].
Soil nitrogen content
The nitrogen percentage of soil of Jumla as influenced by different level of treatments (figure 3) ranges from very low to high. The highest percent of nitrogen was 0.803% found in T4 (130:50:50NPK (kg/ha) + 6-ton FYM) and lowest 0.035% in case of T6 that only contain 30FYM. The nitrogen percent was 5 times lesser than T4 in treatment T1 (40:0:0 NPK + 6 -ton FYM) and T3 (100:30:30 + 6 -ton FYM). The N% less than 0.1 i.e. very low in treatments T2 (70:10:10 + 6 -ton FYM) and T6. T5 (160:70:70 + 6 -ton FYM) have 0.266% of N and followed by 0.182% N in control condition.
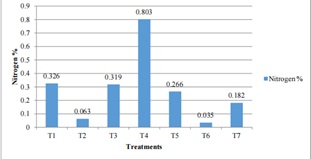 Figure 3: Effect of Different Treatments Combination on Soil of Jumla (2514masl).
Nitrogen content was in a range of medium to high in soil treated with various treatments in Pakhribas. The N% of treatments T2 (50:15:15 NPK (kg/ha)), T3 (9-ton compost), T4 (25:7.5:7.5 NPK (kg/ha) + 4.5ton compost), T5 (25:7.5:7.5NPK (kg/ha)) was found statistically similar that are in little more than 0.3%. The N% of these treatments was > 0.3 to < 0.4. Nitrogen content in [21-24] treatment 1 with control condition was 0.409% which was highest among all treatments. The nitrogen content in T6 (4.5-5 ton compost) was 0.206% followed by 0.102% in T7 (12.5:3.75:3.75 + 5NPK (kg/ha)) was lower than that of other treatments.
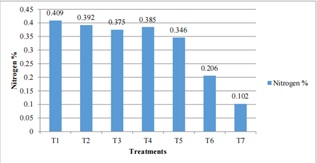 Figure 4: Effect of Different Treatments Combination on Soil of Pakhribas (1200masl).
In lower altitude the highest N% was found in T9 (10 FYM) followed by T3 (100:30:0NPK (kg/ha)) and least in case of T6 having combination of 100:0:30NPK (kg/ha). In control condition (T1) the N% was 0.091. Nitrogen content in T4 (100:0:30NPK (kg/ha)), T7 (50:0:0NPK (kg/ha)) and T10 (100:30:30NPK (kg/ha), ZnSO425 (kg/ha)) was 2 times lesser than T3. Other treatments contain very [25] low amount of N%. T1 T2 T5 T11 T12 was < 0.1% of N as shown in (figure 4).
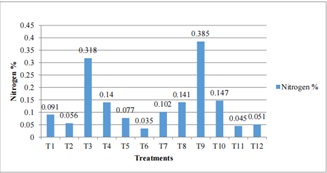 Figure 5: Effect of Different Treatments Combination on Soil of Parwanipur (115masl).
From the above results we found that the nitrogen content as showed (figure 5) was vary among treatments in each altitude. Among three altitudes N% was higher in Pakhribas in all treatments. The nitrogen was least in case of Parwanipur soil but medium in Jumla soil except T5. Research article published in global soil biology volume 22 shows that total N contents of soils significantly increased with altitude, but decreased with soil depth. Carbon and N were similarly correlated with altitude and temperature, and temperature [26] was seemingly the main driver of soil C along the altitudinal gradient. Altitude accounted for 73% of the variation in C and 47% of the variation in N stocks.
The findings of our data were similar to the findings of NARC which conclude that nitrogen content was decrease with decreasing altitude. Lower altitude possesses higher temperature that may be the cause of low N%. [15]
Soil potassium content
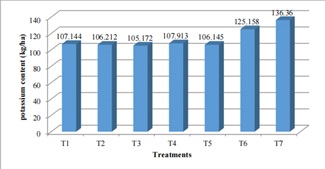 Figure 6: Effect of Different Treatment Combination on Soil available Potassium at Jumla (2514masl).
Different treatments combination in soil of Jumla showed (figure 6) that potassium content was in a medium range [27] in case of T6 and T7 i.e. 125(kg/ha) and 136 (kg/ha) with the [28-30] application of 30 FYM and in control condition. The data regarding T1-T5 have statistically significant data. Similar amount of K (107 kg) was obtained from T1 40:0:0NPK (kg/ha) +6 -ton FYM and T4 130:50:50NPK (kg/ha) + 6 -ton FYM that was 26 kg less K than T7. T6 contain 125 kg K which was 19 kg more than in T2 70:10:10NPK (kg/ha) +6 -ton FYM and T5 160:70:70NPK (kg/ha) +6 -ton FYM. The K obtained least that is 105.172 (kg/ha) in T3.
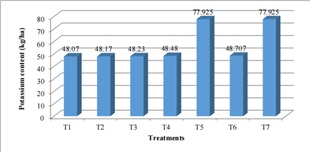 Figure 7: Effect of Different Treatment Combination on Soil Potassium at Pakhribas (1200masl).
The K content (kg/ha) was low that is < 110 kg/ha (figure 7). Among the 7 treatments T5 (25:7.5:7.5NPK (kg/ha)) and T7 (12.5:3.75:3.75 NPK (kg/ha)) was highest (77.925 kg/ha) K content that is almost double than that of all treatments. T1, T2, T3, T4, T5 have almost similar findings that is 48 (kg/ha) k2o.
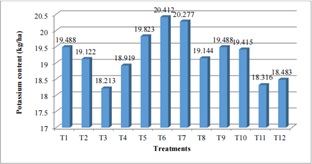 Figure 8: Effect of Different Treatment Combination on Soil Available Potassium at Parwanipur (115masl).
The data regarding lower altitude shows the lower content of potassium (figure 8) the highest K content was found in T6 (100:0:30NPK (kg/ha)) followed by T7 (50:0:0NPK (kg/ha) and lest in case of T3 (100:30:0NPK (kg/ha) followed by T11 (50:0:0NPK (kg/ha), 10ton FYM). Treatment 1 (control condition) contain 19.488 (kg/ha) in Parwanipur. Remaining treatments contain similar amount of K with respect to applied treatments. Similar type of result was found at western Nepal by the research impact of altitudinal variation on soil chemical properties [31]. The potassium content in high, medium and low altitude was 164, 113 and 113 (kg/ha) respectively. But reverse result was found from case study from Langtang national park; altitudinal variation of soil fertility. The report shows that the percentage of available Potassium content in the soil is decreasing with the increase in altitude. The rate of correlation coefficient in between the altitude and the available Potassium content is -0.7927 which indicates that the potassium content is highly negatively correlated to the altitude.
Soil microbial population
|
Treatment No. |
Treatment |
Azotobacter (1×10²) |
Fungus (1×10⁴) |
Bacteria (1×10⁵) |
|
T1 |
40:0:0NPK (kg/ha) + 6 -ton FYM |
0 |
6.333 d |
38.00 c |
|
T2 |
70:10:10NPK (kg/ha) + 6 -ton FYM |
0 |
9.333 d |
23.00 de
|
|
T3 |
100:30:30NPK (kg/ha) + 6 -ton FYM
|
0 |
11.67 cd
|
18.67 de
|
|
T4 |
130:50:50NPK (kg/ha) +6 -ton FYM |
0 |
19.67 c
|
67.33 b
|
|
T5 |
160:70:70NPK (kg/ha) + 6 -ton FYM |
0 |
12.67 cd
|
153.3 a
|
|
T6 |
30 ton FYM |
0 |
23.67 b
|
16.33 e
|
|
T7 |
Control |
0 |
45.33 a |
28.33 d |
|
P-Value |
|
|
< 0.01 |
< 0.01 |
Table 8: Response of Treatments on Soil Microbial Diversity and Abundance at Jumla (2514 masl).
The data of microorganism’s population in Jumla showed the mixed results in terms of superiority in fungi and bacteria diversity and abundance. Fungi population was highest in control condition (as usual soil) but the bacterial population was low. Bacterial population was highly abundant in T5 followed by T4, T1, T 7 respectively. The bacterial population of T2 and T6 insignificant with T3. In terms of fungi population, natural soil (Control) was the best, followed respectively by T6, T4, T5 (insignificant with T3) and T2 (insignificant with T1) as shown in (table 9)
|
Treatment No. |
Treatment |
Azotobacter (1×10²) |
Fungus (1×10⁴) |
Bacteria (1×10⁵) |
|
T1 |
Full Control |
0 |
90.67 a |
35.00 c |
|
T2 |
50:15:15 NPK (kg/ha) |
0 |
16.67 d |
18.33 d |
|
T3 |
9ton compost |
0 |
29.33 c |
30.33 cd |
|
T4 |
25:7.5:7.5 NPK (kg/ha) +4.5ton compost |
0 |
74.00 b |
146.3 a |
|
T5 |
25:7.5:7.5NPK (kg/ha) |
0 |
41.00 c |
40.33 bc |
|
T6 |
4.5ton compost |
0 |
30.67 c |
48.67 b |
|
T7 |
12.5:3.75:3.75 NPK (kg/ha) |
0 |
38.00 c |
34.00 c |
|
P-value |
|
|
< 0.01 |
< 0.01 |
Table 9: Response of Treatments on Soil Microbial Diversity and Abundance at Pakhribas, Dhankuta (1200masl).
The abundance of microbial population in Pakhribas showed similar type of data the most abundant fungal population was obtained in T1 but the bacterial population was obtained in T4 followed by T4 in fungi and T6 in bacteria. T1 showed significant bacterial population. The bacterial population of T5 and T6 insignificant with T7. Control condition bacterial population was insignificant with T7 and T3 insignificant with T2. The least microbial population was obtained in T2. Similarly, the abundance of fungal population showed significant data treatment T1, T2, T4. The highest fungal population was found in T1 (control condition) as usual soil followed by T4. Fungi population of T3, T5, T6 and T7 insignificant with each other. Least fungi population was obtained T3 with application 9-ton compost as shown in (table 10).
|
Treatment No. |
Treatment |
Azotobacter (1x10²) |
Fungus (1x10⁴)
|
Bacteria (1x10⁵)
|
|
T1 |
Control |
3.43 d |
39.33 d |
64.00 e |
|
T2 |
100:0:0NPK (kg/ha) |
5.42 c |
18.67 e |
44.33 f |
|
T3 |
100:30:0NPK (kg/ha) |
4.69 c |
15.33 e |
65.67 e |
|
T4 |
100:0:30NPK (kg/ha) |
8.31 a |
89.33 b |
41.00 f |
|
T5 |
100:30:30NPK (kg/ha) |
5.01 c |
40.33 d |
201.7 a |
|
T6 |
100:0:30NPK (kg/ha) |
2.88 d |
8.667 e |
99.67 c |
|
T7 |
50:0:0NPK (kg/ha)
|
6.86 b |
96.33 ab |
67.00 e |
|
T8 |
50:20:0NPK (kg/ha)
|
0.70 e |
101.0 a |
75.33 de |
|
T9 |
10 ton FYM |
5.52 c |
37.67 d |
79.67 de |
|
T10 |
100:30:30NPK (kg/ha), ZnSO425 (kg/ha) |
4.73 c |
17.67 e |
93.33 cd |
|
T11 |
50:0:0NPK (kg/ha), 10 ton FYM |
0.70 e |
62.67 c |
148.7 b |
|
T12 |
50:0:0NPK (kg/ha), 10 ton compost |
5.11 c |
10.67 e |
153.0 b |
|
P-value |
|
< 0.01 |
< 0.01 |
< 0.01 |
Table 10: Response of Treatments on Soil Microbial Diversity and Abundance at Parwanipur, Bara (115masl).
The presence of all three microbial communities in Parwanipur. The highest bacterial population was obtained in T5 followed by T12 and T11 (T12 insignificant with T11). Bacterial population in T10 insignificant with T6. The bacterial population of T8 and T9 was found insignificant with T7 with application of 50 kg NPK. Soil of control condition (T1) showed lower bacterial population and T3 insignificant with T1, T2 insignificant with T4 (least bacterial population. Similarly, the fungal abundance was at its highest in T8 with the application of (50:20:0 NPK) and least at T12. T7 was [32] insignificant with T4 but the fungal population was significant in T11. T1, T5 and T9 insignificant with each other and remaining treatments T2, T3, T10 and T12 insignificant with each other. Finally, the azotobacter was present in Parwanipur region in all treatments but the population was lower. The highest azotobacter population was obtained in T4 followed by T7. Significant azotobacter population was found in these two treatments (T4 and T7). There was 6 treatments T2, T3, T5, T9, T10 and T12 which showed insignificant Azotobacter population. Similarly, T1 (control condition) insignificant with T6 and T8 insignificant with T11, and that was the least azotobacter population of Parwanipur. Large number of microbial [33-37] populations was obtained from lower altitude (Parwanipur) with compared to Jumla and Pakhribas. The presence of Azotobacter shows the good fertility status of soil for plant, which was present in Parwanipur but in small number. Azotobacter was absent in both Jumla and Pakhribas region (table 10)
Conclusion
Different treatment combinations were used in lower altitude, medium altitude and high altitude and soil sample was taken and analyzed in a laboratory. The pH was less than neutral in all regions. The highest soil pH (6.49) was found on higher altitude that contains the treatment combination of T4 (130:50:50NPK + 6ton FYM). The soil of Pakhribas was found to be acidic. The highest soil pH among 12 treatments in Parwanipur was 6.4 in T9 (10 -ton FYM) and least 5.3 at T6 (50:0:30 NPK). The organic matter content in high altitude was very low except in T2 (70:10:10NPK+ 6ton FYM) and T5 (160:70:70NPK+6ton FYM) which was 1.005%. The organic matter content in medium altitude was 0.4355 in T5 (25:7.5:7.5NPK) and T6 (4.5-ton compost). As well as the OM% in Parwanipur was also lower in all treatments that is less than 1%. The soil properties such as NPK also differ from altitude to altitude. The nitrogen was very high (0.803%) in high altitude T4 (130:50:50NPK+ 6ton FYM), medium to high in Pakhribas and very low 0.035% in T6 (100:0:30NPK) to high 0.385% in T9 (10 -ton FYM). The highest amount of K obtained from Jumla was 136.36 (kg/ha) from T7. Around 77 (kg/ha) K2o was obtained from T5 and T7 in Pakhribas. Potassium content was very low in Parwanipur i.e. < 20 (kg/ha) K2o in all treatments. Out of 3 different altitudes fungus and bacteria was present in all altitudes but the Azotobacter was only found on lower altitude. The overall microbial population was highest in Parwanipur but decrease with increase in altitude. Diversity of microbes was obtained higher in lower altitude.
Suggestions
After the completion of this study following suggestions have been made which was
felt during field experiments and analysis:
- Integrated use of chemical fertilizers, FYM and compost helps to improve the soil fertility.
- Soil microbial property is positively correlated with soil organic matter.
- Soil chemical properties can be drastically changed after the application of chemical fertilizers.
- Uncontrolled use of chemical fertilizers reduces the productive capacity of soil.
- Temperature, rainfall and other environmental factor largely take place in changing the soil microbial and chemical properties of soil.
- Large scale research and reliable lab works should be conducted to get more accurate data.
Conflict of Interest
The authors affirmed no conflict of interest.
Funding
No funding was received for the research work.
References
- MOAD (2017) Stastical information on Nepalese Agriculture 2073/74. Agribusiness promotion and statistics division, Ministry of Agriculture development, Kathmandu Nepal.
- Ritz K, Harris J, Murray P, (2010) The role of soil biota in soil fertility and quality, and approaches to influencing soil communities to enhance delivery of these functions. Defra project code: SP1601: Sub-Project A of Defra Project SP1601: Soil Functions, Quality and Degradation–Studies in Support of the Implementation of Soil Policy.
- Johnston J, Fellow LTS, (2011) Assessing soil fertility: The importance of soil analysis and its interpretation. Potash Development Association.
- Rimal P (2009) Comparative study of soil fertility status of different forest types soil under community forest and upland soil at Bhimeshwor Municipality Dolakha; Thesis submitted to Purwanchal University, faculty of Science and Technology, HICAST KTM Nepal
- DOA (2000) Annual report of soil science programs 1999/2000. Kathmandu.
- ADB I (2006) Environment assessment of Nepal: Emerging issues and Challenges. Kathmandu ICIMOD.
- SMD (2017) Soil fertility status of Nepal its problems and solutions Soil management Directorate Hariharbhawan Lalitpur Nepal.
- Das DK (2015) introductory soil science, Second Edition. New Delhi- 110 002. Kalyani publishers.
- Bhatia C R, (2008) Role of microbial diversity for soil, health and plant nutrition. In Molecular Mechanisms of Plant and Microbe Coexistence 53-74 Springer, Berlin, Heidelberg.
- Liu E, Yan C, Mei X, Zhang Y, Fan T (2013) Long-term effect of manure and fertilizer on soil organic carbon pools in dryland farming in northwest China. Plos one 8: 56536.
- Jnawali AD, Ojha RB, Marahatta S (2015) Institute of Agriculture and Animal Science, Tribhuvan University, Nepal, Department of soil science, Purwanchal University, Nepal
- Roshan BO (2015) Assistant Professor, Department of soil science, Himalayan College of Agriculture science and Technology, Purwanchal University, Kathmandu, Nepal, 2.
- Khadka D, Lamichhane S, Rawal N, Joshi DB (2014) Impact of altitudinal variation on soil chemical properties of western Nepal, Soil science division NARC, Khumaltar Lalitpur Nepal and National wheat research program NARC Bhairahawa Rupandehi Nepal.
- Margesin R, Jud M, Tscherko D, Schinner F (2008) Microbial communities and activities in alpine and subalpine soils. FEMS Microbiology Ecology 67:208-218.
- McKenzie R (2003) Soil pH and plant nutrients. AGRI-FACTS, Practical information for Alberta’s agriculture industry.
- Ren T, Wang J, Chen Q, Zhang F, Lu S (2014) The effects of manure and nitrogen fertilizer applications on soil organic carbon and nitrogen in a high input cropping system. PloS one9: e97732.
- Panthi J (2010) Altitudinal variation of soil fertility: a case study from langtang national park. Sc thesis.
- Saeed S, Barozai MYK, Ahmad A, Shah SH (2014) Impact of altitude on soil physical and chemical properties in Sra Ghurgai (Takatu mountain range) Quetta, Balochistan. International Journal of Scientific & Engineering Research 5: 730-735.
- Schinner F (1982) Soil microbial activities and litter decomposition related to altitude. Plant and Soil 65: 87-94.
- Sewards J (2014) Soil pH and its effect on nutrient availability, soil microbial activity and plant health. UF/IFAS Extension, Volusia County Urban Horticulture Agent and Master Gardener Coordinator.
- SMD (2017) Soil fertility status of Nepal, its problems and solutions, Soil management Directorate, Hariharbhawan Lalitpur Nepal.
- Xu Z, Yu G, Zhang X, Ge J, He N, Wang Q (2015) The variations in soil microbial communities, enzyme activities and their relationships with soil organic matter decomposition along the northern slope of Changbai Mountain. Applied Soil Ecology86: 19-29.
- Yasir M, Azhar EI, Khan I, Bibi F, Baabdullah R, et al. (2015) Composition of soil microbiome along elevation gradients in southwestern highlands of Saudi Arabia. BMC microbiology 15:
- Zhang B, Liang C, He H, Zhang X, (2013) Variations in soil microbial communities and residues along an altitude gradient on the northern slope of Changbai Mountain, China. PLoS One8: e66184.
- Zhou J, Wu Y, Bing H, Yang Z, Wang J, et al. (2016) Variations in soil phosphorus biogeochemistry across six vegetation types along an altitudinal gradient in SW China. Catena142: 102-111.
- McKenzie R (2003) Soil pH and plant nutrients. AGRI-FACTS Practical information for Alberta’s agriculture industry.
- Lickacz J, Penny D (2001) Soil organic matter Alberta Agriculture and Forestry Agriculture Information Center USA.
- Liang C, Jesus EDC, Duncan DS, Jackson RD, Tiedje JM, et al. (2012) Soil microbial communities under model biofuel cropping systems in 50 southern Wisconsin USA Impact of crop species and soil properties. J of Applied Soil Ecology 54: 24-31.
- Laldinthar R, Dkhar MS (2015) Relationship between Soil Bacterial Population and Various Physico-Chemical Properties at Two Broadleaved Forest Stands of Meghalaya Differing in Altitudes. Transcriptomics Open Access.
- Karlen DL, Hunt PG, Matheny TA (1996) Fertilizer 15nitrogen recovery by corn, wheat, and cotton grown with and without pre-plant tillage on Norfolk loamy sand. Crop science 36:975-981.
- Abbott LK, Murphy DV (2003) Soil biological fertility: a key to sustainable land use in agriculture. Springer Science and Business Media.
- Amelung W, Zhang X, Zech W, Flach KW (1999) Amino sugars in native grassland soils along a climosequence in North America. Soil Science Society of America Journal 63: 86-92.
- Bhattarai A, Bhattarai B, Pandey S (2015) Institute of Agriculture and Animal Sciences, Tribhuvan University, Nepal, Nobel College Department of Medical Microbiology Pokhara University
- Brar A, Gosal SK, Walia SS (2017) Effect of Biofertilizer and FYM on Microbial dynamics and soil health in Maize Rhizosphere.
- Hao XH, Liu SL, Wu JS, Hu RG, Tong CL, et al. (2008) Effect of long-term application of inorganic fertilizer and organic amendments on soil organic matter and microbial biomass in three subtropical paddy soils. Nutrient Cycling in Agroecosystems 81: 17-24.
- Howard DD, Essington ME, Logan J, Roberts RK, Percell WM (2001) Phosphorus and potassium fertilization of disk-till and no-till cotton. Cotton Science 5: 144-155.
- Howard DD, Essington ME (1998) Effects of surface-applied limestone on the efficiency of urea-containing nitrogen sources for no-till corn. J Agronomy 90: 523-528.
Citation: Bhusal KK, Malla S, Magar SK, Pokhrel D (2022) Altitudinal Variation in Soil Microbial Population and Associated Soil Properties in Long Term Soil Fertility. J Environ Sci Curr Res 5: 037.
Copyright: © 2022 Khuma Kumari Bhusal, et al. This is an open-access article distributed under the terms of the Creative Commons Attribution License, which permits unrestricted use, distribution, and reproduction in any medium, provided the original author and source are credited.