Assessment of Genotoxicity and Histological Changes in the Tissue of Liver, Kidney and Gills Induced by Synthetic Hormone 17 A - Ethinylestradiol (EE2) in Fish, Channa Punctatus (Bloch. 1793)
*Corresponding Author(s):
Vivek KumarDepartment Of Zoology, Isabella Thoburn College, Lucknow-226007, India
Email:vivekkumarsb@gmail.com
Abstract
The synthetic hormone 17α-ethinylestradiol (EE2) is often used as medicine for people, animals, and aquaculture activities. It enters the aquatic environment mostly via sewage treatment facilities. Its remarkable resistance to the process of deterioration has made it a pervasive issue in the environment. The Channa punctatus fish used in this experiment were housed in four distinct aquaria, with group 1 serving as the control. The other three groups were exposed to varied concentrations of the synthetic hormone EE2 for 28 days at 25 ± 2 °C, with group 1 serving as the control. After a 7th, 14th, 21st, and 28th day interval, an evaluation of micronucleus induction and histological alterations in kidney, liver, and gills tissues caused by EE2 was made in each group. Due to its simplicity, sensitivity, and ability to identify micronuclei generated in this species' blood erythrocytes, the micronucleus test (MN) is frequently used to identify genotoxicity.Group 1 (as control) saw no appreciable increment in MN frequency (0.16 ± 0.014). In contrast with control, group 2 had a slight increase in MN frequency (0.91 ± 0.015), group 3, saw a substantial increase in MN frequency (1.01 ± 0.017), and group 4, which saw the highest increase in MN frequency (1.11 ± 0.016).Results shows that the synthetic hormone EE2 causes pathological changes in the fish liver, including vacuolization and necrosis, CRRT and kidney hypertrophy, and Complete Degeneration Of Secondary Lamellae (CDSL), which was also associated with Extremely Swollen Blood Vessels (ESVB) in the fish. The current study's findings confirm that EE2 causes genotoxicity and histological alterations in the spotted snakehead fish Channa punctatus.
Keywords
17α-ethinylestradiol; Geno toxicity; Histology; kidney gills; Liver; Micronucleus assay.
Introduction
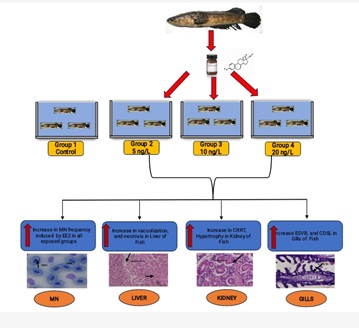
Graphical Abstract.
Aquatic creatures, particularly fish, may have their sexual traits altered by steroid hormones like androgens and estrogens. These substances, which are used in oral contraceptives, have an impact on fish at several stages of development, including the formation of an embryo. According to [1] the residual effects of steroid hormones might have a negative impact on the environment, biological processes, and human health. As a result of their ability to alter the enzymes responsible for hormone synthesis and destruction as well as their ability to act as anti-hormones, these synthetic chemicals, as well as some naturally occurring substances, have also been classified as Endocrine Disrupting Contaminants (EDCs). One of the most significant synthetic estrogens is 17α-ethinylestradiol (EE2), which is used in oral contraceptives and has a tetracyclic structure and an aromatic A-ring. Fish are well-known bio-indicators to understand the toxicity of EDs since they exhibit sexual plasticity and susceptibility to xenobiotic chemicals or sex steroids [2]. In yellow catfish, this hormone has been linked to significant immune system changes, changes in the oxidative state, and liver damage. Maximum levels of the synthetic estrogen17α- ethinylestradiol (EE2) are seen in STW effluents. Through the sewage system, hormone-disrupting substances are discharged into the aquatic environment [3]. The EE2 concentration in sewage treatment facilities was measured to be between 0 and 150 ng/L by (Wu et al, 2017) and (Barreiros et al, 2016). Ethinylestradiol, which pregnant women produce in their urine and faeces, is present in human-sourced effluents [4].
Among biomarkers, the genotoxic impact is regarded as a key endpoint to evaluate the toxicity of water pollution on species at all trophic level [5-6]. A substance or agent that has the capacity to harm DNA or chromosomes is known as a genotoxin. To assess the safety of consumer items and environmental chemicals as well as to investigate the mode of action of known or suspected carcinogens, several in vitro and in vivo studies are utilised [7]. The micronucleus test (MN) is utilised in this investigation to identify the genotoxicity of the synthetic hormone EE2.
Micronuclei (MN) are small, nucleus-like structures with DNA content that are created by nuclear envelope deposition around chromosomes that are lagging or chromosome fragments that do not successfully reintegrate into a primary nucleus after mitosis or meiosis is complete [8]. MN induction is a sensitive indicator of DNA damage and can be used to effectively detect double strand breaks, single strand breaks, base mismatches, and DNA adducts. It is one of the most significant biomarkers for assessing genotoxicity in aquatic fauna and a promising test for environmental genotoxicity [9]. As a result, the micronucleus test is a trustworthy method for assessing the genetic harm caused by aquatic contaminants in fish and other aquatic animals [10-11] Through the MN test for cytogenetic damage, we have shown in the current work how EE2 causes toxicological changes in the freshwater teleost Channa punctatus.
In research on the toxicology of vertebrates, the liver has received the greatest attention [12-14] The liver plays important roles in the metabolism and storage of energy, the digestion of food (via bile synthesis), and the synthesis of proteins like vitellogenin (Vtg), coagulation factors, and hormones such as insulin-like growth factor, thrombopoietin, and angiotensin II. Due in part to biotransformation events that may increase the toxicity and carcinogenicity of metabolites, the liver is one of the most often targeted organs for both cytotoxicity and carcinogenesis in fish and other vertebrates [15-17]. Additionally, EE2 was shown to be particularly hazardous to aquatic adult organisms. According to a 2007 study by Notch et al., EE2 is a potent inducer of the growth of hepatic tumours and may have co-carcinogenic effects by hindering an organism's capacity to repair DNA adducts vianucleotide excision repair (NER) mechanisms. Observable biochemical and histological abnormalities (of the liver, gonads, and kidneys), adjustments to the reproductive process and development, and behavioural changes are only a few effects of this endocrine system destabilisation [18]. Additionally, a survey of literature found that histological and biochemical studies of fish blood and liver tissues might serve as a more sensitive indicator for identifying early indications of pollution stress than analytical methods.
Materials And Methods
- Test chemical
The synthetic estrogen 17-ethinylestradiol (EE2), which is manufactured by SIGMA ALDRICH, Co. at 3050 Spruce Street in St. Louis, Missouri, USA, was utilised. Its purity was 98%. By mixing EE2 with ethanol to create specified stock solutions at each concentration (5, 10, and 20 ng/L), the test solution was created.
- Test species
The Teleostomi: Ophicephalidae freshwater spotted snakehead, Channa punctatus, was selected as the test fish owing to its broad range of toxin tolerance and strong market demand for its excellent taste, high nutritional value, and year-round availability. Approximately 15.0 ± 2 cm long fish were caught [19]. The female typically has a bloated abdomen and may be identified by scattered black patches in the ventral area, whereas the male has black dots on a yellow under-belly [20]. These freshwater fish were bought alive and in good health from Tadikhana fish market in Lucknow, Uttar Pradesh, India.
- Experimental setup and exposure conditions
The fish used in the studies were all alive and in good condition. Four groups of fish, each with 16 individuals (8 males and 8 females), were devised. Fish from Groups II, III, and 1V were subjected to sublethal doses of 17α- ethinylestradiol (5 ng/l, 10 ng/l, and 20 ng/l, respectively) in 100 litres of water, while Group I served as the control group. The fish received subacute exposure to a harmful synthetic hormone for 28 days. At regular intervals of 7, 14, 21, and 28 days, blood as well as tissue samples were taken for genotoxicity testing to monitor the development of micronuclear bodies and for histological studies of liver, kidney and gills.
- Geno toxicity assessment
Micronucleus assay
The blood was promptly prepared for MN analysis on each collection day. Using a heparinized syringe and the caudal vein puncture procedure, blood samples were taken from the fish. A little amount of blood was applied to a spotless microscope slide right away after collection. The smears were dried, then fixed in methanol for ten minutes, let to air-dry at room temperature, and then stained for twenty minutes with 6% Giemsa in Sorenson buffer (pH 6.9). Each specimen was examined using a light microscope (Olympus Opto Systems India Pvt. Ltd., India, Type MLX B plus; oil immersion lens, 100/1.25) to look at a total of 1000 erythrocytes. Preetpal (n.d.) only scored MN that were not more than 1/3 the diameter of the main nucleus, clearly separable from the main nucleus, had obvious boundaries, and were the same colour as the nucleus. The number of MN in at least 1000 cells or fish was estimated in order to determine the frequency of MN.
Histopathological analyses
The kidney, liver, and gills were expertly dissected and stored in glass vials. They were first pre-washed with fish saline (64% NaCl) and blot-dried before being fixed in Bouin's and 10% neutral formalin for 24 and 48 hours, respectively. Then, using a rotatory microtome, tissue blocks were made and slices were cut at a thickness of 6 µm. Following varied ethanol treatments, they were stained with Ehrlich hematoxylin and eosin and mounted with DPX. The slides were then examined using the imaging microscope and photographed.
Statistical analysis
The data was analyzed using SPSS 27 window version to compare the effectiveness of test chemicals on micronucleus frequencies and histopathological changes of the liver, kidney, and gills over four treatment periods; a difference was considered significant at significant at a (P < 0.05). The one-way ANOVA and Duncan's multiple range test were used to assess differences between individual means. With the help of (APHA et al., 2017) the physicochemical characteristics of water media were studied.
Results
Physicochemical parameters
According to [21] certain physic-chemical parameters of the water treated with EE2 during this experiment, including dissolved oxygen levels of 6.76 to 7.77 mg/L, CO2 levels of 23.7 to 30.4 mg/L, water temperature of 24.7 to 27.6°C, pH levels of 5.9 to 6.4, and hardness levels of 160 to 170 mg/L, were found to be within the limit and suitable for fish survival.
Micronuclei evaluation
The erythrocytes of C. punctatus were elliptical and had an oblong nucleus in the middle. At various EE2 concentrations, the frequency of MNi induction in peripheral blood erythrocytes was assessed. The findings are shown in Table 1. The observed MNi (Figure 1) had traits that were comparable to those mentioned by [22] After the length of the 7th day, 14th day, 21st day, and 28th day, the frequencies of MN in the blood erythrocytes of Channapunctatus in group 1 which acted as the control were measured as 0.13±0.016, 0.16±0.016, 0.13±0.016, and 0.16±0.014. Group 4 recorded the highest increment in MN frequencies, with values of 0.56±0.016, 0.73±0.017, 0.88±0.017, and 1.11±0.016.After the duration of 7th day, 14thday, 21st day and 28th day respectively,the MN frequency on the 28th day was recorded at its highest during the experiment, rising by 6.9 folds in comparison to the control. In group 3, the recorded MN frequencies for each interval were 0.51±0.016, 0.66±0.016, 0.78±0.016, and 1.01±0.017. In comparison to the other exposed groups, Group 2 reported the lowest MN frequencies, with readings of 0.46±0.016, 0.59 ±0.005, 0.66±0.015, and 0.91±0.015 on each of the 7thday upto 28th day of their individual periods. It is evident from the results that the frequency of MN increased significantly (P< 0.05) after exposure to all three sublethal concentrations of EE2 in the erythrocytes of Channa punctatus, as shown in (Table 1 & Graph 1). As compared to the control group, all three exposed groups showed an increase in the frequency of MN induction.
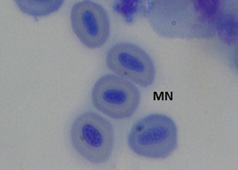 Figure 1a: Control
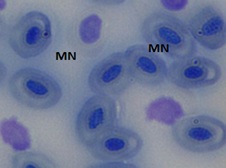 Figure 1b: Group 2 (5ng/L)
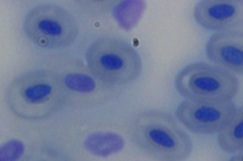 Figure 1c: Group 3 (10ng/L)
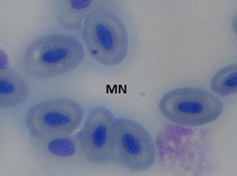 Figure 1d: Group 4 (20ng/L)
Figure 1: Microphotographs showing frequencies of MN in peripheral erythrocytes of C. punctatus induced by EE2.
|
Groups |
Conc. (mg/l) |
Exposure period(h) |
Total cells scored |
Total no. of MN |
Frequency of MN mean (%)±S.D |
|
Group 1 |
Control |
7 |
6019 |
9 |
0.13 ± 0.016 |
|
14 |
6016 |
9 |
0.16 ± 0.016 |
||
|
21 |
6014 |
9 |
0.13 ± 0.016 |
||
|
28 |
6014 |
9 |
0.16 ± 0.014 |
||
|
Group 2 |
EE2(5ng/l) |
7 |
6026 |
34 |
0.46±0.016 |
|
14 |
6024 |
44 |
0.59±0.005 |
||
|
21 |
6020 |
53 |
0.66±0.015 |
||
|
28 |
6022 |
67 |
0.91±0.015 |
||
|
Group 3 |
EE2(10ng/l) |
7 |
6026 |
31 |
0.51±0.016 |
|
14 |
6021 |
40 |
0.66±0.016 |
||
|
21 |
6024 |
47 |
0.78±0.016 |
||
|
28 |
6024 |
61 |
1.01±0.017 |
||
|
Group 4 |
EE2(20ng/l) |
7 |
6015 |
28 |
0.56±0.016 |
|
14 |
6016 |
36 |
0.73±0.017 |
||
|
21 28 |
6023 6023 |
40 55 |
0.88±0.017 1.11±0.016 |
Table 1: Micronucleus frequencies in peripheral erythrocytes of C. punctatus treated with EE2..
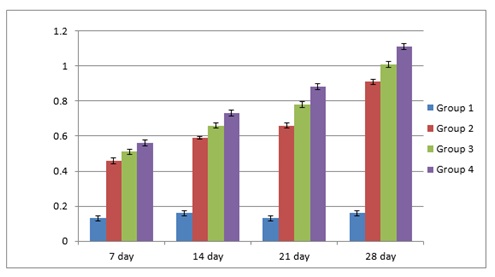 Graph 1: Depicting increase in MN frequency induced in C punctatus by EE2.
Kidneys
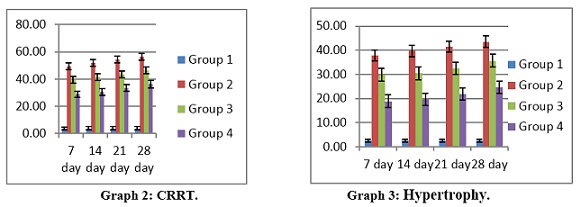
The Bowman's capsule, glomerulus, and tubules of the control group of fish's kidney tissue were identified using histopathological analysis. After 28 days of 17-ethinylestradiol treatment, the kidney tissues of the experimental C. punctatus groups exhibited CRRT and hypertrophy, but the control fish did not exhibit any abnormalities. CRRT levels in group 2 and group 3indicated a significant difference (P < 0.05) with group 2 having the greatest values (37.84 ± 2.33 to 43.56 ± 2.45) and group 1 having the lowest values (2.51 ± 0.55 to 2.58 ± 0.56). The maximum level of CRRT in the kidney throughout the experiment was found in group 2 (Figure 2a & 2b) at day 28 (43.56±2.45), which is raised by 17 folds in comparison to the control.
Groups 2 and 3 indicated a significant difference (P < 0.05) in hypertrophy levels, with group2 having the greatest values (49.33 ± 2.56 to 56.34 ± 2.45) and group 1 obtained the lowest values (3.79 ±1.07 to 3.91 ±1.15).The largest level of kidney hypertrophy during the trial was seen in group 2 at day 28 (56.34 ± 2.45), a 15-fold increase above control as shown in (Table 2) and (Graphs 2&3).
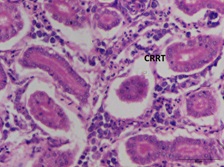 Figure 2a: Kidney: CRRT
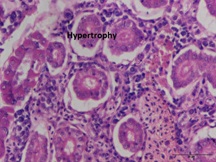 Figure 2b: Kidney: Hypertrophy
|
Parameters |
Exposure period (days) |
Group 1 Control |
Group 2 5 ng/l |
Group 3 10 ng/L |
Group 4 20 ng/L |
|
CRRT |
7 days |
2.51 ± 0.55 |
37.84 ± 2.33 |
29.78 ± 2.67 |
18.86 ± 2.67 |
|
14 days |
2.55 ± 0.54 |
39.77 ± 2.45 |
30.57 ± 2.66 |
19.59 ± 2.56 |
|
|
21 days |
2.58 ± 0.54 |
41.54 ± 2.23 |
32.50 ± 2.45 |
21.87 ± 2.56 |
|
|
28 days |
2.58 ± 0.56 |
43.56 ± 2.4 5 |
35.67 ± 2.67 |
24.76 ± 2.56 |
|
|
Hypertrophy |
7 days |
3.79 ± 1.07 |
49.33 ± 2.56 |
39.42 ± 2.45 |
28.77 ± 2.45 |
|
14 days |
3.86 ± 1.12 |
51.66 ± 2.45 |
41.49 ± 2.67 |
30.54 ± 2.45 |
|
|
21 days |
3.88 ±1.21 |
54.33 ± 2.67 |
43.44 ± 2.45 |
33.31 ± 2.56 |
|
|
28 days |
3.91± 1.15 |
56.34 ± 2.45 |
46.34 ± 2.56 |
36.22 ± 2.67 |
Table 2: Histological changes in kidney tissue of C. punctatus exposed to EE2 (Sub-Acute).
 Liver
Liver
Hepatocyte structure in the control (unexposed) group of C. punctatus fish was normal, and the hepatic cord was clearly visible. Significant morphological alterations in the liver tissue of the experimental groups of C. punctatus fish, such as vacuolization and necrosis of liver cells along the vein, were seen in comparison to the controls after subsequent exposure to 5 ng/L, 10 ng/L, and 20 ng/L of 17α-ethinylestradiol. Group 2 had the greatest values (20.58 ± 2.45 to 29.48 ± 2.33), and group 1 obtained the lowest values (2.42 ± 0.56 to 2.39± 0.67), indicating a significant difference in vacuolization levels between groups 2 and 3 (P <0.05). The maximum level of vacuolization in the liver throughout the experiment was seen in group 2 (Figure 3a) at day 28 (29.48±2.33), which is raised by 12 folds in comparison to the control (Table 3).
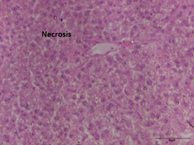 Figure 3a: Liver: vacuolization.
Group 2 and 3 indicated a significant difference (P< 0.05) in necrosis levels with group 2 having the greatest values (38.70± 1.09 to 56.48± 1.07), and group 1 obtaining the lowest values (3.79 ±0.88 to 3.91 ±0.82). The greatest level of liver necrosis throughout the trial was seen in group 2 (figure 3b) at day 28 (56.4±81.07), a 15-fold increase above control (Graphs 4&5).
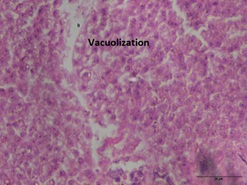 Figure 3b: Liver: Necrosis.
|
Parameters |
Exposure period (days) |
Group 1 Control |
Group 2 5 ng/l |
Group 3 10 ng/L |
Group 4 20 ng/L |
|
vacuolization |
7 days |
2.42 ± 0.56 |
20.58 ± 2.45 |
14.54 ± 2.33 |
10.35 ± 2.39 |
|
14 days |
2.48 ± 0.59 |
23.35 ± 2.56 |
18.45 ± 2.48 |
13.65 ± 2.45 |
|
|
21 days |
2.53 ± 0.45 |
26.34 ± 2.67 |
21.62 ± 2.56 |
16.66 ± 2.67 |
|
|
28 days |
2.39 ± 0.67 |
29.48 ± 2.33 |
24.56 ± 2.45 |
19.76 ± 2.38 |
|
|
Necrosis |
7 days |
3.79 ± 0.88 |
38.70 ±1.09 |
33.46 ±1.12 |
24.30 ± 1.17 |
|
14 days |
3.86 ± 0.87 |
44.60 ±1.08 |
37.36 ±1.12 |
28.61±1.15 |
|
|
21 days |
3.88 ± 0.81 |
49.57 ± 1.05 |
40.62 ±1.19 |
31.53±1.18 |
|
|
28 days |
3.91 ± 0.82 |
56.48 ± 1.07 |
45.65 ± 1.15 |
34.53±1.17 |
Table 3: Histological changes in Liver tissue of C punctatus exposed to EE2 (Sub-Acute).
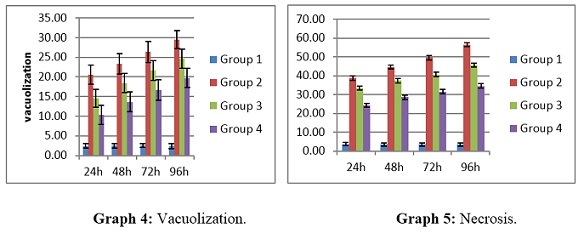 Graph 4&5: Histological changes in Liver of C punctatus exposed to EE2.
Gills
Complete secondary lamellae degeneration (CDSL) and incredibly swollen blood vessels (ESVB) were seen in the gills of fish subjected to various 17-ethinylestradiol concentrations. Lower doses (5 ng/L) apparently did not cause any discernible modifications to the intended organsof the treated fish. Relatively high quantities revealed abnormalities. Complete degeneration of secondary lamellae (CDSL) levels, with group 1 having the lowest levels (3.49 ± 0.63 to 3.51± 0.69) and group 2 having the highest levels (34.57 ± 3.66 to 41.63 ± 2.14). The greatest level of CSDL in gills throughout the experiment was found in group 2 (Figure 4a &4b) at day 28 (41.63 ± 2.14), which is raised by 12 folds in comparison to control.The greatest and lowest values for very swollen blood vessels (ESVB) were found in groups 2 (32.44 ± 3.66 to 39.66 ± 3.45), and (2.84 ± 0.66 to 2.66 ±1.15) in group 1 respectively. The greatest level of ESVB in gills was seen in group 2 at day 28 of the experiment (39.66±3.45), which is raised by 14 times in comparison to control as shown in (Table 4 ) and (Graphs 6&7)
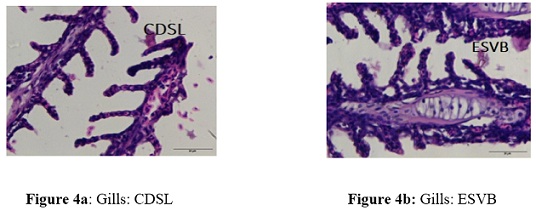 Figure 4: Histological photomicrograph of the tissue of liver, kidney and gills of C. punctatus exposed to EE2.
|
Parameters |
Exposure period (days) |
Group 1 Control |
Group 2 5 ng/l |
Group 3 10 ng/L |
Group 4 20 ng/L |
|
ESBV |
7 days |
2.84 ± 0.66 |
32.44 ± 3.66 |
29.34 ± 3.44 |
23.59 ± 3.67 |
|
14 days |
2.78 ± 0.54 |
34.66 ± 3.45 |
31.45 ±3.69 |
26.67 ± 3.69 |
|
|
21 days |
2.82 ± 0.68 |
37.45 ± 3.67 |
35.33 ± 3.45 |
27.45 ± 3.11 |
|
|
28 days |
2.66 ± 0.73 |
39.66 ± 3.45 |
36.67 ± 3.59 |
29.45 ± 3.38 |
|
|
CDSL |
7 days |
3.49± 0.63 |
34.57±2.18 |
24.38 ± 2.34 |
15.60 ± 2.14 |
|
14 days |
3.52 ± 0.67 |
37.45 ±2.13 |
26.64 ± 2.45 |
17.30 ± 2.15 |
|
|
21 days |
3.54 ± 0.61 |
39.68 ± 2.17 |
30.63 ± 2.33 |
19.64 ± 2.45 |
|
|
28 days |
3.51± 0.69 |
41.63 ± 2.14 |
33.54 ± 2.45 |
23.59 ± 2.33 |
Table 4: Histological changes in Gills tissue of C. punctatus treated with EE2 (Sub-Acute)
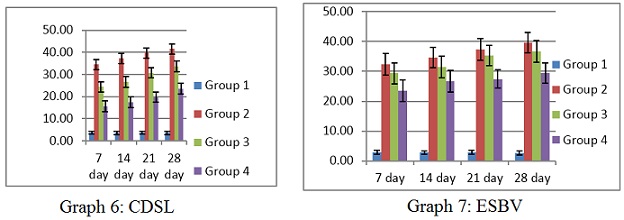 Graph 6&7: Histological changes in gills tissue of C punctata exposed to EE2.
Discussion
The potential toxicity of EE2 as an endocrine disruptor has been supported by prior research showing that it may affect growth rate, sexual maturity, reproductive success and/or failure, and reproductive behavioural changes [23] Studying EE2 genotoxicity is important since EE2 is known to be a potent promoter of carcinogenesis owing to its effects on cell proliferation [24]. The synthetic estrogen (EE2), whose ecotoxicological effects on aquatic creatures have been well documented, is often used in oral contraceptives [25]. Several studies have shown a positive genotoxic impact utilising mammalian animal model, but there are conflicting findings when examining the genotoxic potential in mammalian cells [26] Due to its ease of use, the micronucleus (MN) test is one of the most effective methods for detecting genetic changes in animals that live in the environment. Because fish contain red blood cells with cell nuclei, which distinguish them from red blood cells in humans, these cells are viewed as significant biological markers of pollution in the form of morphological abnormalities. In determining the stress syndrome of pollutants as well as the genotoxicity and mutagenesis impacts of diverse environmental contaminants, red blood cell micronucleus analysis has achieved exceptional advancements [27]. (Siddique et al. 2005) have shown that the genotoxicity of ethinylestradiol in lymphocytes may result from its potential conversion into free radical species during metabolic activation. Similar findings about the destructive effects of synthetic steroids on DNA have also been published [28]. Multiple ways exist for how genotoxins harm genetic material. Some genotoxins produce reactive free radicals (reactive oxygen and nitrogen species) directly or indirectly, which react with the phosphodiester backbone of DNA and cause DNA breaks. Other genotoxins prevent DNA repair enzymes from working, which results in the persistence of DNA lesions (Kawai and Nuka 2018). Other EDCs with estrogenic effects, such as bisphenol A [29]. 4-nonylphenol (NP) [30] and the natural estrogen 17-estradiol have also been the subject of recent studies, and it has been shown that these EDCs may play a role in causing DNA damage.
In our experiment, the production of micronuclei in the erythrocytes of the fish Channa punctatus showed that cytogenetic damage had occurred; it is likely that EE2 had impacted the genetic material through absorption through the gill epithelium. As the dosage of EE2 was increased in a time-dependent way, we saw an increase in the frequency of MN in fish peripheral erythrocytes. After exposure to various substances, the micronucleus test in fish erythrocytes was extensively verified in the lab. After exposure to a variety of X-ray dosages, a rise in MN frequency was seen as a dose response [31]. Similar to this, the drug's clastogenic capacity is shown by the dose-related substantial rise in the frequencies of micronuclei in the population of erythrocyte cells in mouse bone marrow at all dosages. The extended impact of the medication on DNA may be the cause of the much greater rates of micronuclei development in mouse bone marrow cells [32].
According to [33-35] damage to fish liver tissue occurs relatively more frequently than in any other tissue. This is likely because it serves as the metabolic hub for the detoxification of toxins and has a higher capacity for absorbing OPP residues. Hepatocyte vacuolization may be a sign of an imbalance between the rate of a substance's production and release in hepatocytes, according to [36]. According to prior research [37,38] endocrine disrupting substances have been shown to cause apoptosis in a range of cells, including PC12 cells and thymocytes. Increased TUNEL-positive hepatocytes have recently been found in the liver of medaka (Oryziaslatipes) treated to 10 ng/l EE2 from hatch to maturity in both sexes [39] The 10 ng/L EE2 therapy showed a tendency in the direction of increase, although this was not statistically significant [40] revealed similar histological abnormalities in the livers of Tillapiazilli and Soleavulgaris, including localised necrosis and vacuolar degeneration of the hepatocytes. He attributed these changes to the direct effects of pollutants. On the alterations brought on by estrogen in the kidney's minuscule anatomy, very little information is known. The straight section of the rat proximal tubule showed more pronounced electron microscopic modifications after short courses of estradiol treatment than the convoluted section, according to [41] Because gills come into direct contact with environmental contaminants, they are very vulnerable to hazardous substances. Fish gills serve as their respiratory, osmoregulatory, and secretory systems, making them the most important organ in the animal [42]. The early signs of toxicity that dominate physiological processes and may result in fish death include irregular and decreased breathing.
The current study's findings unmistakably show that the EE2 has the potential to be mutagenic and clastogenic in fish, as determined by MN and histological [43-45] analyses. The toxicants cause the fish liver to develop pathological alterations such as vacuolization and necrosis, CRRT and renal hypertrophy, complete degeneration of secondary lamellae (CDSL), and very swollen blood vessels (ESVB). By using probit analysis [46-47] , the toxicity of EE2 in fish was evaluated over the course of 28 days using accepted practices. This test was important because it provided the first data about the toxicity of EE2 in freshwater fish Channa punctatus.
Conclusion
The study's findings provide further proof that the micronucleus test in fish erythrocytes may be used to identify genotoxic contaminants and as a practical biomarker for field monitoring of contaminated water reservoirs and coastal regions. Our research suggests that even a modest dosage of 17α-ethinylestradiol, when applied continuously, may cause fish to develop histological abnormalities. Therefore, it should be against the law for even small quantities of 17α-ethinylestradiol to infiltrate into neighbouring bodies of water.
Future Scope
This review's main objective was to determine whether histopathological markers and genotoxic assessment that induce hepatotoxicity, renal toxicity and genotoxicity through non-endocrine pathways. As part of a "due diligence" process, articles were evaluated for the reliability of their histopathological and genotoxic data. In the hopes that readers and upcoming researchers will find this material useful, some of the scores' findings are presented here. For instance, it is known that certain liver diagnoses, such as altered hepatic architecture and hepatocyte nuclear vacuolization, should be used with caution due to the high rate of erroneous interpretation and micronuclei inductions in additionally, that paper provides detailed guidelines for the assessment of micronuclei induction in fish erythrocytes, creation and dissemination of fish histopathology data, covering study design, study methods, data collection (such scoring MN frequency), diagnosis and data interpretation and data presentation (such as advice for efficient photo microscopy).Wolf (2018) offers further proposals for boosting the quality of fish histopathology data, including those that include the journal's editorial peer review procedure.According to Bolognesi and Fenech (2012), the validation of a standardised Mussel Cytome protocol, which includes the identification of various cell types and evaluation of various cytotoxic and nuclear alterations, could aid in determining the genotoxic and cytotoxic effects brought on by cumulative exposure to a variety of contaminants in the study areas.
Contribution of Authors
The authors of this work worked together on it. Abiha Tarique, the author, planned the experiment, made the graphs, analysed the data, and wrote the report. Hiba Farhan Safwi, the author, is held accountable for procuring test animals and executing the experiment. The final draft was edited by the author, Vivek Kumar. and Sunil P. Trivedi, the author, oversaw the experiment and provided direction for the creation of the study report. All of the authors have read and approved the final product.
Conflict of Interest
The authors have no conflict of interest to declare. All co-authors have seen and agree with the contents of manuscript and there is no financial interest to report. We certify that the submission is original work and is not under review to any other publication.
Compliance With Ethical Standards
As per the requirements of the Committee for the purpose of control and supervision of experiments on animals (CPCSEA), Government of India, an institutional Animal Ethics Committee (IAEC) VIDE REGISTRATION NO. 1861/GO/Re/S/16/CPCSEA, University of Lucknow, Lucknow. The protocols as stated in the CPCSEA for the executing the experiment have been followed by the authors.
Acknowledgement
The authors are sincerely thankful to Head, Department of Zoology, and University of Lucknow for providing faculty to conduct experiment and the keen support and belief.
References
- Azizi-Lalabadi M, Pirsaheb M (2021) Investigation of steroid hormone residues in fish: A systematic review. Process Safety and Environmental Protection 152: 14-24.
- Nagahama Y, Nakamura M, Kitano T, Tokumoto T (2004) Sexual plasticity in fish: a possible target of endocrine disruptor action. Environmental Sciences: An International Journal of Environmental Physiology and Toxicology 11: 73-82.
- Weber AA, Moreira DP, Melo RMC, Ribeiro YM, Bazzoli N (2019) Environmental exposure to estrogenic endocrine disruptors mixtures reflecting on gonadal sex steroids and gametogenesis of the neotropical fish Astyanax rivularis. General and Comparative Endocrinology 279: 99-108.
- Tang Z, Liu Z, Wang H, Dang Z, Liu Y (2021) Occurrence and removal of 17α- ethinylestradiol (EE2) in municipal wastewater treatment plants: Current status and challenges. Chemosphere 271: 129551.
- Bolognesi C, Cirillo S (2014) Genotoxicity biomarkers in aquatic bioindicators. In Current Zoology 60: 273-284.
- Osman AGM, Abd El Reheem AEBM, Moustafa MA, Mahmoud UM, Abuel-Fadl KY (2011) In situ evaluation of the genotoxic potential of the river Nile: I. Micronucleus and nuclear lesion tests of erythrocytes of Oreochromis niloticus niloticus (Linnaeus, 1758) and Clarias gariepinus (Burchell, 1822). Toxicological and Environmental Chemistry 93: 1002-1017.
- Phillips DH, Arlt VM (2009) Genotoxicity: damage to DNA and its consequences. Molecular Clinical and Environmental Toxicology 1: 87-110.
- Krupina K, Goginashvili A, Cleveland DW (2021) Causes and consequences of micronuclei. Current Opinion in Cell Biology 70: 91-99.
- Fenech M, Chang WP, Kirsch-Volders M, Holland N, Bonassi S, et al. (2003) HUMN project: detailed description of the scoring criteria for the cytokinesis-block micronucleus assay using isolated human lymphocyte cultures. Mutation Research/Genetic Toxicology and Environmental Mutagenesis 534: 65-75.
- Ratn A, Prasad R, Awasthi Y, Kumar M, Misra A, et al. (2018) Zn2+ induced molecular responses associated with oxidative stress, DNA damage and histopathological lesions in liver and kidney of the fish, Channa punctatus (Bloch, 1793). Ecotoxicology and Environmental Safety 151: 10-20.
- Yadav KK, Trivedi SP (2009) Sublethal exposure of heavy metals induces micronuclei in fish, Channa punctata. Chemosphere 77: 1495-1500.
- Wolf JC, Wheeler JR (2018) A critical review of histopathological findings associated with endocrine and non-endocrine hepatic toxicity in fish models. In Aquatic Toxicology 197: 60-78.
- Hinton DE, Segner H, Braunbeck T (2017) Toxic responses of the liver. In Target organ toxicity in marine and freshwater teleosts. CRC Press 224-268.
- Wilson MG (2005) Liver and Gall Bladder. Principles and Practice of Geriatric Medicine 2: 381-393.
- Hinton DE (2021) Toxicologic histopathology of fishes: a systemic approach and overview. In Pathobiology of marine and estuarine organisms 177-215 CRC Press.
- Teh SJ, Adams SM, Hinton DE (1997) Histopathologic biomarkers in feral freshwater fish populations exposed to different types of contaminant stress. Aquatic Toxicology 37: 51-70.
- Kleinow KM, Melancon MJ, Lech JJ (1987) Biotransformation and induction: implications for toxicity, bioaccumulation and monitoring of environmental xenobiotics in fish. Environmental Health Perspectives 71: 105-119.
- da Cunha DL, Camargo da Silva SM, Bila DM, da Mota Oliveira JL, et al. (2016)Regulamentação do estrogênio sintético 17α-etinilestradiol em matrizes aquáticas na Europa, Estados Unidos e Brasil. In Cadernos de Saude Publica Fundacao Oswaldo Cruz.
- Froese R, Pauly D (2014) Channa punctata in FishBase.
- Farid MA, Rahman M A, Aktar S, Choudhury M, Yeasmin SM, et al. (2020) Comparative Studies on Gonad Development, Fecundity and Oocyte Maturation of Spotted Snakehead, Channa punctatus (Bloch, 1793) in Different Water Bodies. Annual Research and Review in Biology 75-87.
- APHA (2017) Standard Methods for Examination of water and wastewater.Washington DC American Public Health Association.
- Bernet D, Schmidt H, Meier W, Burkhardt-Holm P, Wahli T (2001) Histopathology in fish: proposal for a protocol to assess aquatic pollution.
- Aris AZ, Shamsuddin AS, Praveena SM (2014) Occurrence of 17α- ethinylestradiol (EE2) in the environment and effect on exposed biota: A review In Environment International 69: 104-119.
- Wessel N, Rousseau S, Caisey X, Quiniou F, Akcha F (2007) Investigating the relationship between embryotoxic and genotoxic effects of benzo[a]pyrene, 17α-ethinylestradiol and endosulfan on Crassostrea gigas embryos. Aquatic Toxicology 85:133-142.
- Siddique YH, Beg T, Afzal M (2005) Genotoxic potential of ethinylestradiol in cultured mammalian cells. Chemico-Biological Interactions 151:133-141.
- Siddique, Afzal Bolognesi C, Hayashi M (2011) Micronucleus assay in aquatic animals. In Mutagenesis 26: 205-213.
- Siddique YH, Afzal M (2004) Evaluation of genotoxic potential of synthetic progestin chlormadinone acetate. Toxicology Letters 153: 221-225.
- Bolognesi C, Perrone E, Roggieri P, Pampanin DM, Sciutto A (2006) Assessment of micronuclei induction in peripheral erythrocytes of fish exposed to xenobiotics under controlled conditions. Aquatic Toxicology 78: S93-S98.
- Teles M, Pacheco M, Santos MA (2006) Biotransformation, stress and genotoxic effects of 17β-estradiol in juvenile sea bass (Dicentrarchus labrax L). Environment International 32: 470-477.
- Gustavino B, Scornajenghi KA, Minissi S, Ciccotti E (2001) Micronuclei induced in erythrocytes of Cyprinus carpio (teleostei, pisces) by X-rays and colchicine. Mutation Research/Genetic Toxicology and Environmental Mutagenesis 494: 151-159.
- Loeb JN, Borek C, Yeung LL (1973) Suppression of DNA Synthesis in Hepatoma Cells Exposed to Glucocorticoid Hormone in Vitro 70: 3852-3856.
- Pugazhvendan SR, Narendiran NJ, Kumaran RG, Kumara S, Alagappan KM (2009) Effect of malathion toxicity in the freshwater fish Ophiocephalus punctatus-A histological and histochemical study. World Journal of Fish and Marine Sciences 1: 218-224.
- Fahmy GH (2012) Malathion toxicity: Effect on some metabolic activities in Oreochromis niloticus, the Tilapia Fish. International Journal of Bioscience, Biochemistry and Bioinformatics 2: 52-55.
- Mostakim GM, Zahangir MM, Mishu MM, Rahman MK, Islam MS (2015) Alteration of blood parameters and histoarchitecture of liver and kidney of silver barb after chronic exposure to quinalphos. Journal of Toxicology
- RS M, Shaikh A (2013) Effect of malathion toxicity on detoxifying organ of fresh water fish channa punctatus. International Journal of Pharmaceutical, Chemical & Biological Sciences.
- Aoki M, Kurasaki M, Saito T, Seki S, Hosokawa T, et al. (2004) Nonylphenol enhances apoptosis induced by serum deprivation in PC12 cells. Life Sciences 74: 2301-2312.
- Yao G, Yang L, Hu Y, Liang J, Liang J, et al. (2006) Nonylphenol-induced thymocyte apoptosis involved caspase-3 activation and mitochondrial depolarization. Molecular Immunology 43: 915-926.
- Weber LP, Balch GC, Metcalfe CD, Janz DM (2004) Increased kidney, liver, and testicular cell death after chronic exposure to 17α?ethinylestradiol in medaka (Oryzias latipes). Environmental Toxicology and Chemistry 23: 792-797.
- Mohamed FAS (2009) Histopathological studies on Tilapia zillii and Solea vulgaris from Lake Qarun, Egypt. World Journal of Fish and Marine Sciences 1: 29-39.
- Rohr HP, Bertram E (1968) Elektronenmikroskopisch-morphometrische Untersuchungen an den Zellen des proximalen Tubulus der Rattenniere nach Estrogengabe. Z Mikrosk Anat Forsch 78: 484-510.
- Cengiz EI (2006) Gill and kidney histopathology in the freshwater fish Cyprinus carpio after acute exposure to deltamethrin. Environmental Toxicology and Pharmacology 22: 200-204.
- Notch EG, Miniutti DM, Mayer GD (2007) 17α-Ethinylestradiol decreases expression of multiple hepatic nucleotide excision repair genes in zebrafish (Danio rerio). Aquatic Toxicology 84: 301-309.
- Preetpal K (2015) Micronuclei induction in different tissues of skittering frog exposed to sublethal concentration.
- Teles M, Gravato C, Pacheco M, Santos MA (2004) Juvenile sea bass biotransformation, genotoxic and endocrine responses to β-naphthoflavone, 4-nonylphenol and 17β-estradiol individual and combined exposures. Chemosphere 57: 147-158.
- Wang Z, Guo L, Liu L, Kuang H, Xu C (2018) Colloidal gold-based immunochromatographic strip assay for the rapid detection of three natural estrogens in milk. Food Chemistry 259: 122-129.
- Baekelandt S, Leroux N, Burattin L, Gérard C, Delierneux C, Cornet V (2023) Estetrol has a lower impact than 17α-ethinylestradiol on the reproductive capacity of zebrafish Danio rerio. Aquatic Toxicology 259: 106505.
- Adeel M, Song X, Wang Y, Francis D, Yang Y (2017) Environmental impact of estrogens on human, animal and plant life: A critical review. Environment International 99: 107-119.
Citation: Kumar V (2023) Assessment of genotoxicity and histological changes in the tissue of liver, kidney and gills induced by synthetic hormone 17 α- Ethinylestradiol (EE2) in fish, Channa punctatus (Bloch. 1793) J Anim Res Vet Sci 7: 0.45.
Copyright: © 2023 Hiba Farhan Safwi, et al. This is an open-access article distributed under the terms of the Creative Commons Attribution License, which permits unrestricted use, distribution, and reproduction in any medium, provided the original author and source are credited.