Assessment of Physicochemical Properties of Surface Water of Mokeshbeel, Gazipur, Bangladesh
*Corresponding Author(s):
Md. Abdul MottalibInstitute Of Leather Engineering And Technology, University Of Dhaka, Dhaka, Bangladesh
Tel:+880 29613728/ 1757306511,
Email:abdul.mottalib@du.ac.bd
Abstract
The study was conducted to determine the water quality of Mokeshbeel, near Gazipur industrial area of Bangladesh. To perform the study six water samples were collected from six different points in the beel and analyzed for various physicochemical parameters such as pH, Temperature, Total Dissolved Solids (TDS), Total Suspended Solids (TSS), Biochemical Oxygen Demand (BOD) and Chemical Oxygen Demand (COD). Statistical analysis such as One-way Analysis of Variance (ANOVA) and Pearson correlation were performed to assess the relationship between the physicochemical water quality parameters, and the Water Quality Index (WQI) was computed to assess the status of water conditions. The results indicate that the amount of BOD, COD and TSS surpassed the permissible limit of national and international standard for the protection of aquatic life while pH, temperature and TDS values were within the allowable limit of national standard. Besides, Pearson correlation analysis showed a significantly positive correlation between BOD and COD, pH and TDS, TSS and COD, TSS and BOD. The ANOVA revealed that there was no statistically significant difference (p > 0.05) in physicochemical water quality parameters among the six points in the beel. The WQI showed that the water quality of Mokeshbeel is extremely poor and very unfit for human use. The study reflects a very bad quality of water in the beel. The results of the present study point out the need to take necessary steps before discharging the wastewater into the beel and future policies by the responsive authority in terms of development of the environmental pollution control.
Keywords
BOD; COD; Mokeshbeel; Physicochemical parameters; TDS
INTRODUCTION
Water is fundamental to life on our planet, but this precious resource is increasingly in demand and under threat. The earth’s surface is made up of 70% water including rivers, beels, lakes, streams, seas, oceans, ground water and all these forms are very important in life cycle [1]. Of the waters occupying 70% of the earth’s surface, only 3% is considered fresh water [2]. Among the freshwater, approximately 5% of them or 0.15% of the entire global water is readily accessible for beneficial purposes [3]. Clean water is essential for nature and humans alike. However, surface waters are subjected to enormous pressures - estimates indicate that in developing countries surface water may already be affected by severe pollution due to its easy accessibility for disposal of wastewater [4]. Once water is contaminated, it’s very difficult, costly, and often impossible to remove the pollutants. Still today, 80 per cent of global wastewater releases untreated into the water bodies, containing everything from human waste to highly toxic industrial discharges [5]. The disposal of untreated wastewater of various industries, urban wastes and agrochemical wastes in low land, open water bodies has reached an alarming situation in Bangladesh which is increasing day by day [6,7]. Pollution of freshwater ecosystems can impact the habitat and quality of life of fish and other wildlife.
Mokesh is a perennial beel of Gazipur. It is a large natural wetland having great biological and environmental importance. This area is an integral part of local livelihoods and culture. The wetland of Mokeshbeel plays an important role in groundwater recharge and discharge, storage of food water and shorelines stabilization. This is one of many similar industrial clusters that has developed as part of the rapid economic growth of Bangladesh, as is the case with all, it is also an area of serious water pollution. Although poultry farms, pharmaceutical industries, cement industries, glass factories and battery industries have been established there, textile manufacturing industries including dyeing and printing units, still dominating the area [8]. These industries are providing employment, increasing local incomes and earning foreign exchange for the country. However, these industries discharge their waste directly into the water body, adversely affecting the livelihoods and the day to day life of the whole community of the area. Most industries do not have an effluent treatment plan, and many that do have a plan but have not implemented it because of cost [9]. Industrial effluents containing chemicals and other harmful products affect the aquatic ecosystem [10]. The local people reported that the fish they caught had a bad smell and were difficult to sell or eat [9]. Thus bioaccumulation of harmful substances in the water dependent food chain can occur.
Recently, we were conducted a study on the Mokeshbeel to investigate the translocation of heavy metals from industry into vegetables and crops through water and soil and their impact on human body [11]. Another study was conducted in Mokeshbeel to assess physicochemical parameters and heavy metal concentration in water [12]. A number of studies have been conducted all over the world to assess the physicochemical characteristics of surface water [6,13-16]. Part of our ongoing study on industrial waste, surface water, soil, vegetable and crops pollution, the main objective of the present study was to assess the physicochemical properties of surface water of Mokeshbeel.
MATERIALS AND METHODS
Study Area
The study was conducted in the Mokeshbeel of the Gazipur district, Bangladesh. Gazipur has an area of 1741.53 km2, located in between 23°53' and 24°21' north latitudes and in between 90°09' and 92°39' east longitudes. Mokeshbeel is located approximately fifty-five kilometers north of Dhaka and lies in the Turag River basin surrounded by sal (Shorea robusta) forests, numerous canals (khals) and Juran Beel (Figures 1&2).
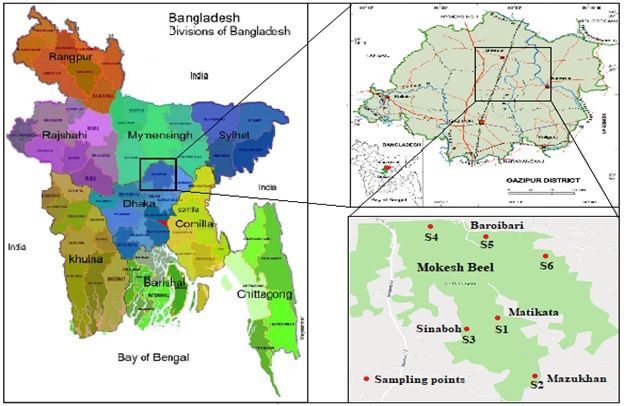 Figure 1: Geographical map of the study area of Mokeshbeel, Gazipur, Bangladesh and sampling points in the beel.
 Figure 2: Scenario of Mokeshbeel in winter.
Sampling locations and sample collection
All the samples were collected during post-monsoon season, because the beel area usually deluges in pre-monsoon season. The water samples for physicochemical analysis were collected randomly from different areas of Mokeshbeel. Six water samples i.e. S1, S2, S3, S4, S5 and S6 were collected from six different locations near Matikata, Mazukhan, Sinaboh Bazar and Baroibari (3 sites) area respectively. Each sample was collected at the depth of about 20-25 cm and 500 mL polystyrene bottles were used to collect the water samples. Before collecting the samples, all bottles were washed properly and rinsed thoroughly several times with distilled water and then dried. Caution was taken not to keep any air bubble inside the bottle.
Physicochemical analysis
The water samples were analyzed for physical and chemical parameters by using standard methods. The physical properties of water samples were determined based on temperature, Total Dissolved Solids (TDS) and Total Suspended Solids (TSS) while chemical parameters were determined based on pH, Biochemical Oxygen Demand (BOD5) and Chemical Oxygen Demand (COD). pH was measured using a digital pH meter, temperature was measured using a glass thermometer, TDS was measure by evaporation method, TSS was measured by gravimetric method, BOD5was measured by respirometric method over 5 days of incubation period at 20°C and COD was measured by open reflux titrimetric method.
Statistical analysis
The data obtained from the water samples were analyzed by using the software Microsoft Office Excel 2007. The statistical tools such as ANOVA, correlation and Water Quality Index (WQI) of physicochemical parameters were used. Different bar charts and tables were prepared for the presentation of the result.
RESULTS AND DISCUSSION
pH
The pH of water samples in this study varied from 7.3 to 7.7 (Table 1). These values of pH were within the standard limit (6.5-8.5) of Bangladesh Environmental Quality Standard (BEQS) [17]. These values were also within the allowable limit of surface water regulations (1989) [18]. The result of the study revealed that the beel water was mostly alkaline; this may be due to the effluent containing alkali into the water. The pH value of the present study is higher than the previous study (7.25-7.5) that was performed in 2018 [12]. The pH of Buriganga river water was ranged from 7.57-7.64 and Balu river water was ranged from 7.58-8.35 [19]. All these studies were almost similar to the present study. The ideal range of pH for aquatic growth is 6.8 to 9.0 [20]. pH greatly affects biological activity. It also affects some properties of water body, activity of organism and effectiveness of toxic substances present in the aquatic environment. A high amount of organic matter and pH of 6.9 to 8.6 keeps most trace elements immobilized [21].
|
Parameter |
S1 |
S2 |
S3 |
S4 |
S5 |
S6 |
|
pH |
7.3 |
7.6 |
7.6 |
7.7 |
7.3 |
7.6 |
|
Temp. (°C) |
25 |
25 |
25 |
25 |
25 |
25 |
|
TDS (mg/L) |
746 |
918 |
910 |
952 |
686 |
878 |
|
TSS (mg/L) |
260 |
138 |
174 |
354 |
586 |
208 |
|
BOD5 (mg/L) |
26.8 |
26 |
32.6 |
44.8 |
102 |
47.2 |
|
COD (mg/L) |
122 |
114 |
119 |
178 |
388 |
172 |
Table 1: Physicochemical parameters of Mokesh beel water.
Temperature
Water temperature is a controlling factor for aquatic life [22]. If water temperatures increase, decrease or fluctuate too widely, metabolic activities may speed up, slow down, malfunction, or stop altogether [23]. Temperature of all the water samples was measured 25°C in the laboratory (Table 1) which was within the allowable limit. In previous study the temperature of Mokeshbeel water ranged from 23.3°C to 30.8°C [12]. The standard limit of surface water temperature is 20°-30°C according to Bangladesh Environmental Quality Standard (BEQS) [17] and 25°C according to surface water regulations (1989) [18]. Decreasing water level and increasing amount of insoluble pollutants during summer make the water hotter as well as the discharge of pollutants can increase the temperature of water [24,25].
Total dissolves solids
Total Dissolved Solids (TDS) of the water samples varied from 686 mg/L to 952 mg/L (Table 1). TDS concentration of all the water samples surpassed the maximum allowable limit (500 mg/L) of World Health Organization [26] but these values were within the allowable limit of Bangladesh Environmental Quality Standard (1000 mg/L) [17]. The TDS of the present study is higher than the previous study (541-586 mg/L) performed in Mokeshbeel [12]. The TDS of Rupsha river was 6900-11000 mg/L which is higher than the present study [14]. Higher TDS can be toxic to aquatic life through changing the composition of the water [27].
Total suspended solids
Total Suspended Solids (TSS) of the water samples ranged between 138 mg/L and 586 mg/L (Table 1). The TSS values of the water samples exceeded the permissible limit of Bangladesh Environmental Quality Standard (150 mg/L) [17] and surface water regulations (50 mg/L) [18]. In this study, TSS in water samples was higher than 200 mg/L, which is considered harmful for the environment [28]. These values of TSS were also higher than DoE effluent standard (150 mg/L) [29] and Indian effluent standards (100 mg/l) except for S2 [30]. TSS of Rupsha river was 0.578-4.678 mg/L which is less than the present study [14].
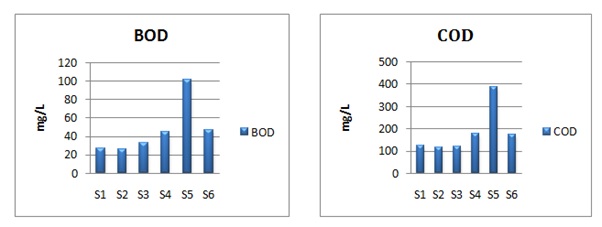
Biochemical Oxygen Demand (BOD5)
Biochemical Oxygen Demand (BOD5) of the water samples varied from 26 mg/L to 102 mg/L (Table 1). All the samples exceeded the permissible limit of Bangladesh Environmental Quality Standard (≤6 mg/L) [17] and surface water regulations (1989) (5 mg/L) [18]. It was also higher than DoE effluent standard (50 mg/L). The permissible limit of BOD5 for drinking water is 0.2 mg/L, for recreation 3 mg/L, for fish 6mg/L and 10 mg/L for irrigation [17]. So the BOD values of the present study were not suitable for fish culture or irrigation. BOD values ranged from 109 mg/L to 163 mg/L in Buriganga River and 102 mg/L to 149 mg/L in Balu river, which is higher than the present study [19].
Chemical Oxygen Demand (COD)
Chemical Oxygen Demand (COD) of water samples ranged between 114 mg/L and 388 mg/L (Table 1). All the samples surpassed the standard limit of surface water regulations (1989) (40 mg/L) [18]. Most of the samples exceeded the permissible limit of Bangladesh Environmental Quality Standard (200 mg/L) [17]. COD values ranged from 185 mg/L to 381 mg/L in Buriganga river and 204.8 mg/L to 307.2 mg/L in Balu river [19]. These studies are almost similar to the present study. High level of biochemical oxygen demand and Chemical oxygen demand is due to the presence of chemicals that may be organic or inorganic caused by the inflow of domestic, livestock and industrial waste that contains elevated levels of organic pollutants [31].
Correlation between different physicochemical parameters
Pearson’s correlation analysis was performed in order to analyze correlations between different physicochemical parameters analyzed in the study. Results of correlation analysis are presented in table 2. It represents the inter correlations among the measured physicochemical parameters. From table 2, it is evident that BOD5 with COD (r=0.995), pH with TDS (r = 0.975), TSS with COD (r=0.939) and TSS with BOD5 (r=0.916) show a highly significant positive correlation. In contrast, pH with TSS (r=-0.529) and pH with BOD5 (r=-0.442), pH with COD (r=-0.489), TDS with TSS (r=-0.664), TDS with BOD5 (r=-0.618), TDS with COD (r=-0.655) indicate a moderate negative correlation.
|
|
pH |
TDS |
TSS |
BOD5 |
COD |
|
pH |
1 |
|
|
|
|
|
TDS |
0.975** |
1 |
|
|
|
|
TSS |
-0.529 |
-0.664 |
1 |
|
|
|
BOD5 |
-0.442 |
-0.618 |
0.916 ** |
1 |
|
|
COD |
-0.489 |
-0.655 |
0.939 ** |
0.995 ** |
1 |
Table 2: Pearson correlation matrix among the parameters, N=6.
**Correlation is significant at 0.01 level (2-tailed). N = No. of Sample
Graphical presentation of BOD and COD:
 ANOVA analysis
One-way Analysis Of Variance (ANOVA) was conducted to determine the relationship of water quality in the different study points of the beel. The ANOVA was based on a significance level (α) of 0.05. The ANOVA analysis revealed that there were no significant difference (p>0.05) in physicochemical water quality parameters in different study points of the beel (Table 3). The null hypothesis may not be rejected where null hypothesis, H0=no statistically significant differenceand alternative hypothesis, Ha=a statistically significant difference in physicochemical water quality parameters among the six different points in the beel.
|
ANOVA |
||||||
|
Source of Variation |
SS |
df |
MS |
F |
P-value |
F-crit |
|
Between Groups |
55482.96 |
5 |
11096.59 |
0.089868 |
0.993101 |
2.620654 |
|
With in Groups |
2963433 |
24 |
123476.4 |
|||
|
Total |
3018916 |
29 |
||||
Table 3: One way analysis of variance.
Water Quality Index (WQI) of Mokeshbeel
Water quality index may be defined as a rating, reflecting the composite influence of different water quality parameters on the overall quality of water. The main objective of computing of Water Quality Index (WQI) is to turn the complex water quality data into information which is easily understandable and usable.
The Water Quality Index (WQI) of Mokeshbeel was calculated using the weighted arithmetic index formula as follows:
WQIA = ΣWnQn/ΣWn
Where n is the number of variables or parameters, Wn is the unit weight of the nth parameter and Qn is the water quality rating of the nth parameter (Table 4).
|
WQI |
Water Quality Status (WQS) |
Possible Usage |
|
0-25 |
Excellent |
Drinking, irrigation and industrial |
|
26-50 |
Good |
Drinking, irrigation and industrial |
|
51-75 |
Poor |
Irrigation and industrial |
|
76-100 |
Very poor |
Irrigation |
|
Above 100 |
Unsuitable for drinking and fish culture |
Proper treatment required before use |
Table 4: WQI range, status and possible usage of the water sample [32].
WQI indicates the quality of water in terms of index number which represents overall quality of water for any intended use. The values of the calculated water quality index were 350.8, 333.75, 411.09, 577.27, 1258.82 and 584.39 for the samples S1, S2, S3, S4, S5 and S6 respectively (Table 5) which was not suitable for irrigation, fish farming, industrial use or any human use. The WQI represented extremely poor quality of water of Mokeshbeel.
|
Parameters Unit Weight |
S1 |
S2 |
S3 |
S4 |
S5 |
S6 |
|||||||
|
(Wn) |
Qn |
WnQn |
Qn |
WnQn |
Qn |
WnQn |
Qn |
WnQn |
Qn |
WnQn |
Qn |
WnQn |
|
|
pH |
0.324 |
20 |
6.48 |
40 |
12.96 |
40 |
12.96 |
46.67 |
15.121 |
20 |
6.48 |
40 |
12.96 |
|
TDS |
0.003 |
74.6 |
0.224 |
91.8 |
0.275 |
91 |
0.273 |
95.2 |
0.286 |
68.6 |
0.206 |
87.8 |
0.263 |
|
TSS |
0.0055 |
520 |
28.6 |
276 |
15.18 |
348 |
19.14 |
708 |
38.94 |
1172 |
64.46 |
416 |
22.88 |
|
BOD |
0.55 |
536 |
294.8 |
520 |
286 |
652 |
358.6 |
896 |
492.8 |
2040 |
1122 |
944 |
519.2 |
|
COD |
0.069 |
305 |
21.05 |
285 |
19.665 |
297.5 |
20.528 |
445 |
30.705 |
970 |
66.93 |
430 |
29.67 |
|
∑Wn=1.001 |
∑WnQn=351.154 |
|
∑WnQn=334.08 |
|
∑WnQn=411.501 |
|
∑WnQn=577.852 |
|
∑WnQn=1260.08 |
|
∑WnQn=584.973 |
||
|
WQI |
350.8 |
333.75 |
411.09 |
577.27 |
1258.82 |
584.39 |
|||||||
Table 5: Calculation of Water Quality Index (WQI) of Mokeshbeel.
CONCLUSION
This study was conducted to assess the physicochemical properties of surface water collected from six different sampling points in Mokeshbeel. This experiment confirmed that some physicochemical parameters like pH, temperature and TDS met the standard acceptable limit in Bangladesh while TSS, BOD5 and COD were very high in concentration compared to the national and international standards. Pearson’s correlation analysis showed a highly significant positive correlation between BOD5 and COD, pH and TDS, TSS and COD, TSS and BOD5. The ANOVA test also showed that there is no statistical significant difference between the different sampling points. The calculated WQI provided an easy way of understanding the overall water quality and water management. The WQI showed extremely poor quality of water of Mokeshbeel which was unsuitable for irrigation, fish culture, industrial use or any human use. Therefore, the results of this study indicated a very bad quality of water in Mokeshbeel. Thus it could be posed a health and environmental risk to the communities that rely on the beel, in particular to the flora and fauna, and finally the human being. So, this study recommended the further development of the environmental pollution control and a routine monitoring of water quality of the beel by responsive authority.
REFERENCES
- Arimieari LW, Sangodoyin AY, Ereoforiokuma NS (2014) Assessment of surface water quality in some selected locations in Port Harcourt, Nigeria. International Journal of Engineering and Technology 3: 1146-1151.
- Aniyikaiye TE, Oluseyi T, Odiyo JO, Edokpayi JN (2019) Physico-chemical analysis of wastewater discharge from selected paint industries in Lagos, Nigeria. International Journal of Environmental Research and Public Health 16: 1235.
- Usharani K, Umarani K, Ayyasamy PM, Shanthi K, Lakshmanaperumalsamy P (2010) Physico-chemical and bacteriological characteristics of noyyal river and ground water quality of Perur, India. Journal of Applied Sciences and Environmental Managements 14: 29-35.
- UN environment (2019) World water quality alliance launched to tackle global water crisis. United Nations Environment Programme, UN environment, Nairobi, Kenya.
- UN environment (2019) Tackling global water pollution. United Nations Environment Programme, UN environment, Nairobi, Kenya.
- Mottalib MA, Al-Razee ANM, Abser MN, Aman EUM (2016) Assessment of physico-chemical properties of surface water of shitalakhya river near polash, Narsingdi, Bangladesh. International Journal of Advanced Research 4: 915-924.
- Ali MM, Ali ML, Islam MS, Rahman MZ (2016) Preliminary assessment of heavy metals in water and sediment of karnaphuli river, Bangladesh. Environmental Nanotechnology, Monitoring and Management 5: 27-35.
- Ullah ANZ, Clemett A, Chowdhury N, Huq T, Sultana R, et al. (2006) Human health and industrial pollution in Bangladesh.
- Akter A (2011) People’s perceptions of environmental pollution in Mokeshbeel, Bangladesh. Department of Environment, E-16 Agargaon, Dhaka, Bangladesh.
- Nayyef MA, Sabbar AA (2012) Efficiency of duckweed (Lemna minor) in Phytotreatment of wastewater pollutants from basrah oil refinery. Journal of Applied Phytotechnology in Environmental Sanitation1: 163-172.
- Mottalib MA, Ahmed MS, Biswas MMH, Alam MN, Khan M (2019) Translocation of heavy metals from industry into vegetables and crops through water and soil of Mokeshbeel in Bangladesh and their impact on human body. IOSR Journal of Environmental Science, Toxicology and Food Technology 13: 59-71.
- Barmon PC, Islam MS, Kabir MH (2018) Physicochemical parameters and heavy metal concentration in water at the Mokeshbeel of Bangladesh. Journal of Environmental Science and Natural Resources 11: 1-8.
- Haque MA, Jewel MAS, Sultana MP (2019) Assessment of physicochemical and bacteriological parameters in surface water of padma river, Bangladesh. Applied Water Science 9: 10.
- Islam MS, Mohanta SC, Siddique MAB, Al-Mamun MA, N Hossain, et al. (2018) Physico-chemical assessment of water quality parameters in rupsha river of khulna region, Bangladesh. The International Journal of Engineering and Science 7: 73-78.
- Aktar P, Moonajilin MS (2017) Assessment of water quality status of turag river due to industrial effluent. International Journal of Engineering and Information Systems 1: 105-118.
- Tripathi P, Dwivedi AP, Kumar D (2016) Physico-chemical characteristics of surface water samples collected from river Mandakini at Chitrakoot region. International Journal of Scientific Engineering and Technology 5: 76-80.
- DoE (1997) Environment Conservation Rules, Department of Environment.
- EPA (2001) Parameters of water quality interpretation and standards. Environmental Protection Agency, Wexford, Ireland.
- Mottalib MA, Roy S, Ahmed MS, Khan M, Al-Razee ANM (2017) Comparative study of water quality of buriganga and balu river, Dhaka, Bangladesh. International Journal of Current Research 9: 59132-59137.
- Trivedi PR, Raj G (1992) Encyclopedia of Environmental Sciences. 25: 144-146.
- Mireles A, Solis C, Andrade E, Lagunas ML, Pina C, et al. (2004) Heavy metal accumulation in plants and soil irrigated with wastewater from Mexico City. Nuclear Instruments and Methods in Physics Research Section B: Beam Interactions with Materials and Atoms 219-220: 187-190.
- Carr GM, Neary JP (2006) Water quality for ecosystem and human health. United Nations Environment Program Global Environment Monitoring System/Water Program, Burlington, Ontario, Canada.
- Murdoch T, Cheo M, O'Laughlin K (2001) The stream keeper's field guide: Watershed inventory and stream monitoring methods. Adopt-A-Stream Foundation, Washington, USA.
- Boyle TP, Fraleigh HD (2003) Natural and anthropogenic factors affecting the structure of the benthic macro invertebrate community in an effluent-dominated reach of the santa cruz river, AZ. Ecological Indicators 3: 93-117.
- Ezzat SM, Mahdy HM, Abo-State MA, Abd El-Shakour EH, El-Bahnasawy MA (2012) Water quality assessment of river nile at rosetta branch: Impact of drains discharge. Middle-East Journal of Scientific Research 12: 413-423.
- WHO (2008) Guidelines for drinking water quality. World Health Organization, Geneva, Switzerland.
- Tawati F, Risjani Y, Djati MS, Yanuwiadi B, Leksono AS (2018) The analysis of the physical and chemical properties of the water quality in the rainy season in the sumber maron river- Kepanjen, Malang- Indonesia. Resources and Environment 8: 1-5.
- Salem B, Ouardani I, Hassine M (2011) Bacteriological and physico-chemical assessment of wastewater in different region of tunisia: Impact on human health. BMC Research Notes 4: 144.
- InfoMEA (2015) Environment Conservation Rules, 1997, InfoMEA, Bangladesh.
- Sharma A, Ramotra A (2014) Physicochemical analysis of paper effluent in Jammu city (J & K). International Journal of Scientific and Research Publications 4: 1-4.
- Abaidooand RC, Amponsah SK, Hald T, Sampson A, Owusu-Ansah EDJ (2015) Performance, compliance and reliability of waste stabilization pond: Effluent discharge quality and environmental protection agency standards in Ghana. Research Journal of Applied Sciences, Engineering and Technology 10: 1293-1302.
- Brown RM, McClelland NI, Deininger RA, O'Connor MF (1972) A water quality indexcrashing the psychological barrier. Indic Environmental Quality 1: 173-182.
Citation: Jannat N, Mottalib M A, Alam MN (2019) Assessment of Physicochemical Properties of Surface Water of Mokeshbeel, Gazipur, Bangladesh. J Environ Sci Curr Res 2: 014.
Copyright: © 2019 Nure Jannat, et al. This is an open-access article distributed under the terms of the Creative Commons Attribution License, which permits unrestricted use, distribution, and reproduction in any medium, provided the original author and source are credited.