Association of Cow Somatic Cells Count Levels at Drying off with New Intramammary Infections and Culling Events after Calving
*Corresponding Author(s):
Gavan ConstantinResearch Department, Agriculture Research And Development Station Simnic, Craiova, Romania
Email:scda_simnic@yahoo.com
Abstract
In this study we used somatic cell count levels at the end of cow lactation for evaluating udder health status on dairy farm. To be able to distinguish between infected and uninfected mammary glands a cut of 200000 cells/ ml of milk was used. Test day records from official milk Control Center Craiova-Romania database were used for 178 multiparous cows and 30 primiparous cows. All animals had the last test-day somatic cell count (SCC) data before dry off date (except heifers) and 2 test SCC data after calving the period from January 2020 to September 2021. At the beginning of dry off period in the farm is used selective dry cow therapy. Association between infection tendencies across the dry off period (predictor variables) and the occurrence of intramammary infection (IMI) and culling events after calving was evaluated. The prevalence of IMI before dry off period was 27.53% in multiparous cows. After calving, the prevalence of IMI was 17.79%. To determine if cows with low or high SCC levels before dry off period were associated with IMI or culling events after calving odd ratios were calculated. Low SCC level in the milk of cows (< 200.000 cells/ml) before dry off period was a protective factor, and high SCC level (< 200.000 cells/ml) was a risk factor. Based on a specific SCC cutoff level (200.000 cells/ml in this study) and using SCC data from official milk control records can be put into practice as part of udder health supervision program.
Keywords
Culling; Intramammary infection; Monitoring; Somatic cell count.
Introduction
The dry period is the most important phase as a dairy cow’s lactation cycle. During this phase, the cow and her udder are prepared for the next lactation, and any abnormalities during this phase will have a negative effect on the cow’s health after calving.Approximately 60% of early lactation intramammary infection (IMI) cases has an origin in the dry period. The new IMI during dry period was widely recognized [1-6].The udder is very susceptible to new infections at the beginning and end of dry period. IMI’s present during dry period are from previous lactations (as persistent infections) and new infections (as new dry period infections) developed between the time of draying off and calving. During the dry period the rate of new IMIs depends on the grade of exposure to pathogens (dry period length, and environment cleanliness), cow’s sensitivity to infection [7] and the efficiency of dry cow therapy [8]. Milk somatic cell count level of individual cow is a beneficial tool for udder health supervision in dairy farm, and can be used to calculate the probability of an event occurring.Somatic cell count data can be acquired from DHI Associations (official milk control test-days at regular intervals). Different cutoff points based on individual cow SCC to define cows with IMI at drying were used [9]. In the herds with a high bulk milk SCC, use of a cut-point of a SCC ≥ 150.000 cells/ml at any test to define IMI would be appropriate and to be sure that cows infected with any pathogen receive antimicrobial therapy. The sensitivity (Se) and specificity (Sp) for a cow-composite SCC using a cut-point of 200.000 cells/ml to define IMI is 0.30 to 0.85 and 0.67 to 0.90 respectively [10]. The pathogen related with IMI may influences the Se and Sp of SCC [11, 12]. By investigation of the last test-day SCC levels of previous lactation and, first test day SCC levels of the current lactation is practicable to monitor IMI dynamics during dry period [13]. Impact of infection dynamics on cow performance in the following lactation was previous studied [14].The occurrence of health problems during transition period is a risk factor that affect cow’s performance in the subsequent lactation. Detecting IMI at the end of lactation and to cure existing IMI and prevention of new IMI during dry period are the main goal to maintain cow’s udder health status. Use of dry cow therapy is one component of an effective IMI control program. Considering this, and the fact that there is few literature about this subject in the South West of Romania, the need for research regarding issue is indubitable.The objective of this study was to evaluate udder health status before dry cow period and occurrence of IMI and culling events after calving in multiparous and primiparous Holstein-Friesian using SCC data.
Materials And Methods
For this study cow-level SCC data and farm culling records of the research farm of Agricultural Research and Development Station (ARDS) Simnic-Craiova, Romania were used. Test-day records from Official Milk Control Center (MCC Craiova-Romania) data-base were used (for 208 cows). The dairy cows enrolled in this study were located in the research farm of ARDS Simnic-Craiova (182 m above sea level, 44°19’N, 23°48’E). The selected Holstein Friesian cows had average to high genetic merit for kilograms of fat + protein yield.
The diet consisted of high energy ration based on some by products and on homegrown components (forage maize, grazed grass, Lucerne, forage beet, maize silage, grains and beans). Additionally the ration is balanced with purchased minerals. Cows were milked 2 times daily (morning 05:00, and evening 17:00) in a DeLaval milking system. Official milk control in Romania as part of dairy herd improvement (DHI) assumes the testing of milk production, percent of fat protein, casein and lactose, urea content and SCC levels on a sample of milk for each cow taken from 28 to 28 days (13 test day controls annually). All informations regarding SCC of 208 dry off cases (30 for primiparous and 178 for multiparous cows) were stored in an Excel computer program. Using and SCC trash hold of 200.000 cells/ml of milk we estimated infection and noninfection cases, and IMI was defined using a method described by Cook et al, 2002 (Table 1).
|
Measure |
Definition |
|
The mean herd SCC |
Mean SCC of the cows in the herd on test |
|
Infection prevalence (PREV %) |
Proportion of infected cows SCC > 200.000 cells/ml |
|
New infection rate (NIR %) |
Proportion of new infections SCC > 200.000 cells/ml at the current test in cows that were uninfected SCC < 200.000 or non-lactating at the previous test |
|
Fresh cow contribution to herd NIR (FHNIR %) |
Proportion of first test new infection > 200.000 in cows and heifers that were uninfected SCC < 200.000 at the last SCC test or non-lactating at the previous test |
|
Dry cow NIR (DCNIR %) |
Proportion of dry cows < 200.000 at the last SCC test before dry off that calve with a test SCC > 200.000 |
|
Heifer NIR (HNIR %) |
Proportion of first lactation heifers with the first test SCC > 200.000 |
|
Dry cow cure rate (DCCR %) |
Proportion of cow infected at the last SCC test of the prior lactation SCC > 200.000 that calve with a first test SCC < 200.000 |
Table 1: Definition of IMI measures using a SCC > 200.000 cells/ml of milk to estimate infection status (by Cook et al., 2002).
Additionally the cows were categorized as (1) uninfected cows with SCC < 200.000 cells/ml of milk before dry off (last test-day) and after calvings (first test-day; 5 to 28 past calving), or low-low pattern; (2) new infected cows with last test-day SCC < 200.000 cells/ml before dry off and with first test day SCC > 200.000 cells/ml after calving, or low-high pattern; (3) healed infected cows with last test-day SCC ≥ 200.000 cells/ml before dry off and with first test-day SCC < 200.000 cells/ml after calving, or high-low pattern; and (4) chronically infected cows with last test-day SCC ≥ 200.000 cells/ml before dry off and with first test day SCC ≥ 200.000 cells/ml after calving, or high-high pattern . Between January 2020 to September 2021 the research team observed all clinical IMI events in the research herd. In the farm is used selective dry-cow therapy with broad-spectrum antibiotics (cefquinome or cloxacllin). All multiparous and primiparous cows were housed in barns with access in dry lot, prepartum and postpartum and were fed 2 times (morning and afternoon) per day. Additionally all cows and heifers had access to pasture (alfalfa or ryegrass). Prepartum and postpartum diets are presented in (Table 2).
|
Item |
Prepartum (%) |
Postpartum (%) |
|
A. Ingredient: |
||
|
Alfalfa hay |
26 |
29 |
|
Grass hay |
45 |
5.5 |
|
Corn silage |
10 |
16 |
|
Grain mix |
16 |
47 |
|
Mineral mix |
3 |
2.5 |
|
TOTAL |
100 |
100 |
|
B. Nutrient profile: |
||
|
Net energy lactation |
1.28 |
1.6 |
|
Crude protein |
12 |
19 |
|
Neutral detergent fiber |
46 |
28 |
|
Acid detergent fiber |
40 |
20 |
|
Starch |
14 |
27 |
|
Calcium |
1.4 |
1.3 |
|
Phosphorus |
0.3 |
0.4 |
|
Magnesium |
0.4 |
0.4 |
|
Kalium |
1.5 |
1.3 |
|
Natrium |
0.3 |
0.4 |
|
Chloride |
1.1 |
0.4 |
|
Sulfur |
0.4 |
0.2 |
|
C. Dietary Cation-Anion difference |
||
|
mEq/100g of DM |
-5 |
26.9 |
Table 2: Prepartum and postpartum dairy cow diets (Dry matter basis).
Pregnant cows were dried-off 58 ± 10 days before the expected calving date and were moved in the dry pens after last milking. At 21 ± 4 days before the expected calving date all pregnant cows were moved to the prepartum pens. In the prepartum pens all cows are closely monitored by farm personnel for signs of parturition every 1 hour. All parturition events were recorded by the farm veterinary surgeon. All cows had the last test-day SCC data before dry off date (except heifers), and 2 test-day SCC after calving for multiparous (n=178) and primiparous cows (n=30).
- Statistical analysis
The data were entered into MS Excel computer program 2007. STATA version 14 was used to summarize the data and descriptive statistic were used to express the results. The association between infection tendencies across the dry period (predictor variables) and the odds ratio of occurrence of IMI and culling events (results variable) after calving was calculated.
Results
Before dry off date, 129 from 178 multiparous cows were uninfected (72.74%) with a mean ± standard deviation of 167,600 ± 29,350 cells/ml of milk, and 49 (27.53%) multiparous cows were infected with a mean of 301,820 ± 74,930 cells/ml of milk. Overall cows the mean SCC was 204,550 ± 75,890 cells/ml of milk. Using a cut point of 200,000 cells/ml the prevalence of IMI before dry off period was 27.53% (Table 3).
|
|
Uninfected cows (n=129) x 1000 cells/ml |
Infected cows (n=49) x 1000 cells/ml |
|
Mean |
167.60 |
301.82 |
|
Standard deviation |
29.36 |
74.93 |
|
Standard error of mean |
2.58 |
10.70 |
|
Median |
178 |
280 |
|
Quartile 1 |
156 |
245 |
|
Quartile 3 |
188 |
370 |
|
Minimum |
50 |
201 |
|
Maximum |
198 |
450 |
|
Coefficient of variation (%) |
17.5 |
25 |
Table 3: Descriptive statistics regarding SCC levels in milk of multiparous cows before dry off (n=178).
We found a significant difference (p < 0.0001; 95% ci 118.8 to 149.6) between mean SCC of uninfected cows and mean SCC of infected cows. After calving 114 multiparous cows remained uninfected (64.1%), 15 multiparous cows evolved over dry off time as new infections (8.4%), 31 multiparous cows were healed (17.4%) and 18 multiparous cows remained with chronic infections (10.1%) (Figure 1).
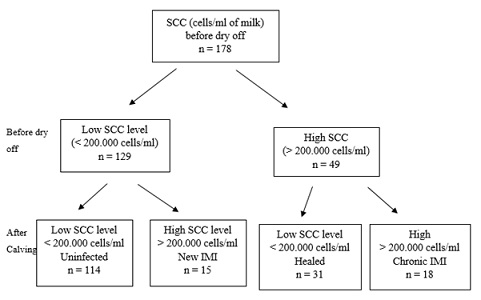 Figure 1: Follow diagram for SCC level and pattern evolved over dry off time. SCC levels were divided before dry off date as low (< 200.000 cells/ml of milk) or high (> 200.000 cells/ml of milk). A first milk-test. SCC after calving cows from each pattern SCC level were divided as uninfected, new infection, healed and with chronic infections.
The mean ± standard deviation of SCC levels in uninfected, new infected, healed and chronic infected multiparous cows were 163940 ± 29320; 432330 ± 146290; 156100 ± 12810; and 4520280 ± 90980 cells/ml respectively (Table 4).
|
|
Uninfected (n=114) x 1000 cells/ml |
New infected cows (n=15) x 1000 cells/ml |
Healed (n=31) x 1000 cells/ml |
Chronic (n=18) x 1000 cells/ml |
|
Mean |
163.94 |
432.33 |
156.10 |
450.28 |
|
Standard deviation |
29.32 |
146.29 |
12.81 |
90.98 |
|
Standard error |
2.75 |
37.80 |
2.30 |
21.45 |
|
Median |
172.50 |
410 |
153 |
420.50 |
|
Quartile 1 |
154.25 |
370 |
139.50 |
409.25 |
|
Quartile 3 |
186 |
525 |
185.50 |
498.50 |
|
Minimum |
50 |
201 |
90 |
300 |
|
Maximum |
194 |
750 |
199 |
700 |
|
Coefficient of variation (%) |
17.90 |
0.34 |
8.20 |
20.20 |
Table 4: Descriptive statistics regarding SCC levels and pattern in milk of multiparous cows at first test-day after calving.
The largest variation of SCC levels was found in new infected udders at first milk test-day after calving (34%) vs. chronic infected udders (20.20%); uninfected udders (17.9%) and healed udders (8.2%) (Table 4).The new infection rate in this study was 11.63% for multiparous cows (low to high pattern) and the healed rate was 63.26% (High to low pattern).After calving 26 primiparous cows (86.66%) were with uninfected udders and 4 (13.33%) were with infected udders (Table 5).
|
Item |
Uninfected (n=26) x 1000 cells/ml |
Infected (n=4) x 1000 cells/ml |
|
Mean |
150.66 |
265.77 |
|
Standard deviation |
29.76 |
53.01 |
|
Standard error of mean |
5.84 |
26.50 |
|
Median |
160.10 |
248.95 |
|
Quartile 1 |
127.08 |
242.15 |
|
Quartile 3 |
170.58 |
272.57 |
|
Minimum |
99.44 |
222.20 |
|
Maximum |
185 |
343 |
|
Coefficient of variation (%) |
19.7 |
19.94 |
Table 5: Descriptive statistics regarding SCC levels at first milk test-day after calving in primiparous cows.
We found a significant difference (p < 0.0001; 95% CI 78.75 to 151.46) between mean SCC of uninfected primiparous cows and mean of infected primiparous cows.Heifer new infection rate was 13.3%, and Fresh cow contribution to herd New infection rate was 11.95%. After calving at first-milk control test-day using a cutoff of 200000 cells/ml the prevalence of IMI after dry off was 17.79%. To determine if cows with low or high SCC levels before dry off were associated with IMI or culling events after calving we evaluated the odd ratios (Table 6).
|
|
Low SCC level1 |
High SCC level2 |
|||||
|
Odd ratio |
95% CI3 |
p-value |
Odd ratio |
95% CI |
p-value |
||
|
IMI events after calving |
0.23 |
0.1-0.5 |
0.00012 |
4.41 |
2-9.7 |
0.00012 |
|
|
Culling events after calving |
0.177 |
0.03-1 |
0.025 |
5.64 |
1-31.8 |
0.025 |
|
Table 6: Odds ratios between low and high SCC levels of cows before dry and IMI or culling events after calving.
Low SCC level before dry off < 200000 cells/ml
High SCC level before dry off > 200000 cells/ml
CI = Confidence interval.
Our results showed that cows with high SCC level before dry off were more likely to evolve IMI or culling events after calving (Table 6). The lower odds ratio for low SCC level before dry off showed that a SCC level < 200000 cells/ml.
Discussion
We evaluated the udder health status of Holstein Friesian cows before dry off and after calving using SCC levels obtained from Milk control test-day of DHI program. Prevalence of IMI before dry off was 27.53%, and after calving was 17.79%. An increased SCC in milk > 200000 cells/ml can suggest the presence of IMI. To reduce the prevalence of IMI a dry cow therapy is needed. Some previous observations showed that the rate of IMI during the early dry off was seven times greater than during lactation [15, 16]. Pantoja et al., (2009) reported a prevalence of IMI of 12.8% at dry off and 6.9% after calving at quarters level. In a recent study Sumon et al., 2020 showed a prevalence of IMI of 35.6% using the bacteriological examination of quarter samples, and a mean of SCC level of 210520 cells/ml (± 27750 cells/ml standard error of mean). Also they reported a mean SCC of 338000 cells/ml in IMI with Enterobacter, 312200 cells/ml with Bacillus spp. 268170 cells/ml with coagulas-negative Staphylococci (CNS) 218310 cells/ml with Staphylococcus aureus or 200750 cells/ml with Escherichia coli. In our study we found a mean SCC in uninfected udders of 167600 cells/ml (± 29360 cells/ ml standard deviation) and a mean SCC of 301820 ± 74930 cells/ml in infected udders. A cut off point of 200000 cells/ml can be used to estimate IMI at dry off and after calving [17]. At present it is confirmed that SCC modification from < 200000 cells/ ml before dry off to > 200000 cells/ml after calving represents a new infection event or a IMI developed between the 2 tests-days (last test-day before dry off and first test-day after calving). For first-milk control test-day, our official DHI rules are to record and to take milk samples after 5 days from calving. Thus, our SCC data meet the targets of SCC for the evaluation of non-infected and infected cows using a cutoff of 200000 cells/ml.Avoiding the new IMI in the dry period and elimination of occurring IMI are 2 crucial components of a mastitis monitoring program. Dufour and Dohoo, (2012) evaluated the predictive ability of IMI incidence of dry period and elimination rates obtained from pre-dry and after calving SCC measurements. They suggested that SCC cutoff of 200000 cells/ml would be recommended for monitoring of major pathogen IMI incidence and DHI SCC (composite or quarter) data could be used as substitutes for milk bacteriological culture to estimate and monitor the herd major IMI elimination rates over dry period. Some previous study showed that 52.6% of all the coliform mastitis in the first 100 day in milk were from dry period [18]. Also, in the United States Todhunter et al, 1991 reported that of gram-negative IMI, 61% were from dry period. The proportion of new IMI (low to high) pattern in our study was lower (11.63%) than reported by Vanhaudt et al., 2018 (16 to 18%) or by Karsttley-Reodenburg et al., 2021 (16.1%) in herds with selective dry cow therapy. The proportion of infected multiparous cows (> 200000 cells/ml) before dry period was 27.53%. Applying for dry cow therapy at the beginning of the dry period, the proportion of cows was 63.3% (n=31) and the rest remained infected (as chronic IMI), after calving (36.7%; n=18). The activity of antibiotics used for cow therapy was influenced, probably, by some factors in the dry period and was not sufficient in the treatment of IMI infections. We concluded that it is necessary as dry cow therapy to be done in combination with an internal teat sealant application. Precalving risk period for new intramammary infection remains as a problem that needs more deep investigations. Also IMI at first test-day after calving of heifers is a significant problem which justify further study. We considered that high SCC levels in the milk of cows before dry off are associated with evaluated IMI, and culling events after calvings. We found in this study that IMI and culling events after calving were more prevalent in cows with high SCC levels before dry off than cows with low SCC levels before dry off (odd ratio 4.41 and 5.64 vs. 0.23 and 0.177 respectively). Cows with high SCC level before dry off were 4.41 times more likely to have IMI events after calving, than those with low SCC level before dry off were 5.64 times more likely to have culling events after calving than those with low SCC level before dry off. Eckel and Ametaj, (2016), observed the ability of endotoxin to translocate from the mammary tissue. Mammary gland bacterial endotoxin (including from dead bacteria due antibiotic treatment) translocated into blood circulation of cows with high SCC level at dry off can trigger a inflammatory response [19,20]. Low vs. high odds ratio meaning that the low SCC level in cows at drying off is a protective factor, and high versus low odds ratio meaning that the high SCC level in cows at drying is a risk factor for more IMI and culling events. We included as culling reasons mastitis, infertility [21-23] low production and some metabolic disorders as a results of high SCC level implications in dairy cows. Integrating the SCC data before and after drying off was useful to see effect of drying off period on IMI and culling events after calving in dairy cows. Also, SCC levels before and after dry off can be practical to see the effectiveness dry cow therapy [24]. In our study the dry cow cure rate was 63.26%. Primiparous cows after calving (within the first 30 days postpartum) are a good indicator of dry period infection. In our study the incidence of heifers with high SCC level (>200000 cells/ml) was 13.3%, and this may point the cleanliness of farm dry cow environment and the management of the transition period.
Conclusions
Our data provide sufficient evidence to conclude that our interrelation between the levels of SCC in milk of dairy cows before dry off and IMI or culling events after calving exists. The information regarding new infection and healed rates data can be used to know if the entire drying off strategy needs to be evaluated. Based on specific SCC cutoff level (200000 cells/ml used in this study) and using SCC data from DHI records can be put into practice as part of udder health supervision program for the improvement of the udder health status before, during and after dry off period in Holstein Friesian cows.
References
- Todhunter DA, Smith KL, Hogan JS, Schoenberger PS (1991) Gram-negative bacterial infections of the mammary gland in cows Am. J. Vet. Res 52: 184-188.
- Bradley AJ, Green MJ (2001) A study of the incidence and significance of intramammary enterobacterial infections acquired during the dry period. J Dairy Sci 83: 1957-1965.
- Cook NB, Bennett TB, Emery KM, Nordlund KV (2002) Monitoring nonlactating cow intramammary infection dynamics using DHI somatic cell count data. J. Dairy Sci 85: 1119-1126.
- Green MJ, Bradley AJ, Medley GF, Browne WJ (2007) Cow form and management factors during the dry period that determine the rate of clinical mastitis after calving. J. Dairy Sci 90: 3764-3776.
- Pantoja JC, Hulland C, Ruegg PL (2009) Somatic cell count status across the dry period as a risk factor for the development of clinical mastitis in the subsequent lactation. J. Dairy Sci 92: 139-148.
- Nitz J, Wente N, Zhang Y, Klocke D, Tho Seeth M, et al. (2021) Dry period or early lactation-time of onset and associated factors for intramammary infections in dairy cows. Pathogens 10: 224.
- Dingwell RT, Leslie KE, Schukken YH, Sargeant JM, Timms LL, et al. (2004) Association of cow and quarter-level factors of drying off with new intramammary infections during the dry period. Prev Vet Med 30: 75-89.
- Robert A, Seegers H, Bareille N (2006) Incidence of intramammary infections during dry period without or with antibiotic treatment in dairy cows – A quantitative analysis of published data. Vet Res 37: 25-48.
- Hawkins D (2019) Use of different somatic cell count cut-points to define intramammary infections at drying off in dairy cow from a herd with a high somatic cell count. NZ Vet J 67: 203-209.
- Reksen O, Sølverød L, Østeras O (2008) Relationship between milk culture results and composite milk somatic cell counts in Norwegian dairy cattle. J Dairy Sci 91: 3102-3113.
- Summon SMMR, Parvin MS, Ehsan MA, Islam MT (2020) Dynamics of somatic cell count and intramammary infection in lactating dairy cows. J Adv Vet Anim Res 7: 314-319.
- Williamson J, Callaway T, Rollin E, Ryman V (2022) Association of milk somatic cell count with bacteriological cure of intramammary infection. A review Agriculture 12: 1437.
- Lipkens Z, Piepers S, Verbeke J, DeVlegher S (2018) Infection dynamics across the dry period using Dairy Herd Improvement somatic cell count data and its effect on cow performance in the subsequent lactation. J Dairy Sci 102: 640-651.
- Fauteux V, Roy JP, Scholl DT, Bouchard E (2014) Benchmarks for evaluation and comparation of udder health status using monthly individual somatic cell count. Can Vet J 55: 741-748.
- Smith KL, Todhunter DA, Schoenberger PS (1985) Environmental pathogens and intramammary infection during the dry period. J Dairy Sci 68: 402-417.
- Robert A, Seegers H, Bareille N (2006) Incidence of Intramammary infections during dry period without or with antibiotic treatment in dairy cows-a quantitative analysis of published data. Vet Res 37: 2548.
- Barkema HW, Deluyker HA, Schukken YH, Lam TJGM (1999) Quarter – milk SCC at calving and at the first six milkings after calving. Prev Vet Med 38: 1-9.
- Bradley AJ, Green MJ (2000) A Study of the incidence and significance of intramammary enterobacterial infections occurred during the dry period. J Dairy Sci 83: 1957-1965.
- Egyedy A, Rosales EB, Ametaj BN (2022) Association of high somatic cell counts Prior to Dry off to the incidence of periparturient diseases in Holstein Dairy Cows. Vet Sci 9: 624.
- Dufour S, Dehoo IR (2012) Monitoring dry period intramammary count measurements. J. Dairy Sci. 95: 7173-7185.
- Madauasse A, Huxley JN, Browne WJ, Bradley AJ, Green MJ (2010) Somatic cell count dynamics in a large sample of dairy herds in England and Wales. Prev Vet Med 96: 56-64.
- Vanhoudt A, van Hees-Huijps K, van Knegsel ATM, Sampimon OC, Vernooij JCM, et al. (2018) Effects of reduced intramammary antimicrobial use during the dry period on udder health in Dutch dairy herds. J Dairy Sci 101: 3248-3260.
- Krattley-Roodenburg B, Huybens LJ, Nielen M, Van Werven T (2021) Dry period management and new high somatic cell count during the dry period in Dutch dairy herds under selective dry cow therapy. J. Dairy Sci. 104: 6975-6984.
- Eckel EF, Ametaj BN (2016) Invited Review: Roles of bacterial endotoxins in the etipathogenesis of periparturient diseases of transition dairy cows. J Dairy Sci 99: 5967-5990.
Citation: Constantin G (2023) Association of Cow Somatic Cells Count Levels at Drying off with New Intramammary Infections and Culling Events after Calving. J Anim Res Vet Sci 7: 050.
Copyright: © 2023 Gavan Constantin, et al. This is an open-access article distributed under the terms of the Creative Commons Attribution License, which permits unrestricted use, distribution, and reproduction in any medium, provided the original author and source are credited.