Change in SO42-, NO3- and NH4+ levels in PM2.5 in Beijing from 1999 to 2016
*Corresponding Author(s):
Weili LinCollege Of Life And Environmental Sciences, Minzu University Of China, Beijing, China
Tel:+86 1013661031210,
Email:linwl@muc.edu.cn
Abstract
Extant literature was reviewed to analyze the trend of three water-soluble ions-sulfate (SO42-), nitrate (NO3-), ammonium (NH4+) in PM2.5 in Beijing in recent years, and the reasons affecting changes were investigated. From 1999 to 2016, the concentrations of SNA (the total SO42-, NO3-, and NH4+ in PM2.5) in Beijing showed a zigzag fluctuation. Pollution control measures have been successfully used in controlling the primary fine particles and SO42- in atmospheric fine particles, but not in controlling NO3- and NH4+. From 2013 to 2016, the changes in PM2.5 and SNA showed the same trends in summer and autumn, indicating that SNA made a dominant contribution to PM2.5 in summer and autumn and that PM2.5 was mainly produced through secondary formation. However, the changes in PM2.5 and SNA were inconsistent in winter and spring, indicating that primary PM2.5 had a considerable contribution in winter and spring. The values of [NO3-]/[ SO42-] in PM2.5 increased year by year, and the proportion of NH4+ in PM2.5 also increased, demonstrating that the contributions of nitrogen-containing compounds to the secondary PM2.5 became increasingly critical in Beijing. Therefore, strengthening the control of nitrogen-containing compounds by reducing their potential to generate secondary atmospheric fine particles in Beijing is necessary in the future. The change trends of SNA were not synchronized with the change in their precursors’ reduction amount, indicating that SNA precursors in Beijing were sufficient. Research on the collaborative control of SNA must be strengthened.
Keywords
Ammonium ion; Long-term trend; Nitrate ion; PM2.5; Sulfate ion
INTRODUCTION
Fine particulate matter (PM2.5) refers to particles that are suspended in the atmosphere with an aerodynamic diameter (Dp) smaller than or equal to 2.5 μm [1]. The aerodynamic diameter of 2.5 μm is usually considered the boundary between coarse and fine particles [2]. Atmospheric particles, especially PM2.5, exert the effect of absorption or scattering of sunlight. Sulfate, nitrate, and other substances in particulate matter can reduce visibility by scattering light. Especially under higher relative humidity, sulfate, ammonium, and nitrate are more hygroscopic and deliquescent, which means that they have a much stronger light scattering effect and a more obvious visibility reduction [2]. Sulfate, ammonium, and nitrate play a key role in the formation of particulate matter pollution and acid rain [3]. At present, PM2.5 is a major air pollutant in China and is a key material that causes haze.
PM2.5 contains various chemical components, among which are water-soluble ions such as sulfate ions (SO42-), nitrate ions (NO3-), and ammonium ions (NH4+) (collectively known as “SNA”). These ions significantly contribute to the mass concentration and composition of particulate matter, which generally constitutes the main body of aerosol inorganic components. Research has shown that SNA accounts for more than 50% of PM2.5 mass concentration [4] and more than 80% of water-soluble ions in PM2.5 in Beijing [5]. Water-soluble ions in PM2.5 can be directly produced from primary emission sources, but mainly from secondary aerosol formation in gas: Particle transformation processes in the atmosphere, whose gaseous precursors mainly include acid or alkaline gases such as NH3, NOx (including NO and NO2), and SO2 [6]. In urban atmospheres, motor vehicle emissions, sewage treatment processes, and industrial and combustion processes are the main sources of NOx, SO2, and NH3 [7,8].
NOx and SO2 can be oxidized to gaseous HNO3 and H2SO4 by oxidants such as O3, H2O2 and OH in the atmosphere. Under the action of ultraviolet light, O3 is one of the most important photochemical oxidants that can produce the OH radical through photolysis and subsequent reaction with water vapor. The OH radical plays a critical role in the conversion of gaseous NOx and SO2 into nitrate and sulfate [9]. Homogeneous or heterogeneous chemical reactions between acidic substances and NH3 can form water-soluble substances, including NH4NO3, (NH4)2SO4, and NH4HSO4 [10]. The stability of (NH4)2SO4 is obviously higher than that of NH4NO3. Once formed, (NH4)2SO4 is stable in the atmosphere. Therefore, if sufficient NH4+ exists, H2SO4 will eventually transform into (NH4)2SO4 in the atmosphere. NH4NO3 is greatly affected by atmospheric temperature and humidity because of its thermal instability, and gas-particle equilibrium exists between NH3 and HNO3. NH4NO3 is more abundant in particles in spring and winter [11]. The fluctuations of SNA might be closely related to the emission changes of their precursors such as SO2, NOx, and NH3. Understanding the long-term variations of SNA in PM2.5 in the atmosphere may reveal the truth about the pollution characteristics at different periods under related emission control measures.
As one of the biggest megacities in the world, Beijing has been undergoing rapid economic growth, urbanization, and population growth. The aggravated air pollution has greatly challenged scientific research and the management of urban and regional air quality. Compared with other regions, there are more studies on the fine particulate pollution with a longer history in Beijing. But, most of them focus on the characteristics or source analysis of PM2.5 in a specific period, year or season [4, 11-37]. In this paper, literatures about SNA seasonal and inter annual concentrations in PM2.5 in Beijing from 2000 to 2016 are reviewed to obtain their trends and to evaluate the effect of pollution control measures, which would provide scientific information for the future pollution control on PM2.5 in Beijing.
DATA SOURCE
Data on PM2.5 and its components SO42-, NO3-, and NH4+ from 1999 to 2016 in Beijing were collected from published journals and reports released by the Beijing Municipal Ecological Environmental Bureau. The detailed data information is shown in table 1. Over 50 sample sites were identified, divided into urban and suburban sites, including the routine monitoring sites of the Beijing Municipal Environmental Monitoring Center, regional atmospheric background and city stations of the China Meteorological Administration, and field observation sites selected by different researchers. The specific sites range from university campuses to residential areas to industrial zones to high-traffic areas to pollution transport boundaries. Generally, limited amounts of data were collected from the early years than from the later years.
|
Sample Site/(Number*, Location) |
Sample Period |
Sample Number |
PM2.5 |
SO42- |
NO32- |
NH4+ |
Date Source |
|
|
2; urban, suburb |
1999~2000 |
- |
129 |
16.9 |
9.9 |
6.5 |
Yao et al. [34] |
|
|
2; urban |
1999~2000 |
48 |
129 |
14.47 |
12.9 |
6.45 |
He et al. [20] |
|
|
1; urban |
1999.9-2000 |
- |
127 |
14.1 |
9.9 |
6.5 |
He et al. [20] |
|
|
1; urban |
2001.8-2002.9 |
- |
106.9 |
10.6 |
7.8 |
5.5 |
Duanet al. [18] |
|
|
5; urban, suburb |
2001~2003 |
334 |
154 |
17.07 |
11.52 |
8.72 |
Wang et al. [30] |
|
|
5; urban, suburb |
2001-2003 |
Spring |
- |
162.1 |
13.5 |
11.9 |
6.5 |
Wang et al. [30] |
|
Summer |
- |
93.3 |
18.4 |
11.2 |
10.1 |
|||
|
Autumn |
- |
105.2 |
12.7 |
9.1 |
6.3 |
|||
|
Winter |
- |
214.2 |
20.9 |
12.3 |
10.6 |
|||
|
3; urban, suburb |
2002~2003 |
- |
115.6 |
18.3 |
12.9 |
10.4 |
Sun et al. [11] |
|
|
1; urban |
2002-2003 |
Summer |
20 |
77.3 |
16 |
12.2 |
10.4 |
Sun et al. [11] |
|
Winter |
20 |
135.7 |
30.4 |
17 |
12.9 |
|||
|
1; suburb |
Summer |
22 |
82.2 |
19.2 |
13.3 |
11 |
||
|
Winter |
20 |
140.8 |
23.1 |
13.5 |
13.3 |
|||
|
1; urban |
Summer |
21 |
75.4 |
19.7 |
13.2 |
9.75 |
||
|
Winter |
20 |
182.2 |
29.9 |
19.3 |
20.3 |
|||
|
1; urban |
2001-2004 |
Dust days(19) |
|
15.61 |
4.79 |
4.06 |
Duan et al. [18] |
|
|
Haze days(18) |
|
39.2 |
25.3 |
18.11 |
||||
|
Clear days(89) |
|
10.98 |
9.18 |
5.06 |
||||
|
1; suburb |
2002.10-2003.5 |
- |
92.4 |
8.44 |
6.72 |
4.54 |
||
|
1; urban |
2003.6-7 |
- |
123.6 |
21.3 |
13.4 |
9.6 |
He et al. [20] |
|
|
1; urban |
2003.6-7 |
- |
123.6 |
21.3 |
13.4 |
9.6 |
Cao et al. [12] |
|
|
1; urban |
2005.3-2006.2 |
43 |
118.49 |
15.77 |
10.06 |
7.3 |
Zhao [35] |
|
|
1; suburb |
2005.3-2006.2 |
42 |
68.44 |
12.71 |
6.41 |
5.96 |
||
|
1; suburb |
2005.6.29-8.2 |
-- |
68 |
22.6 |
9.9 |
4.7 |
Pathak et al. [27] |
|
|
1; urban |
2005.6-2006.5 |
27 |
99.65 |
16.71 |
7.03 |
5.62 |
Sun et al. [28] |
|
|
1; urban |
103 |
82.37 |
11.63 |
5.31 |
4.18 |
|||
|
1; suburb |
24 |
52.52 |
10.52 |
3.01 |
4.39 |
|||
|
2; urban, suburb |
2005~2007 |
105 |
102 |
29.5 |
18.6 |
- |
Wang et al. [31] |
|
|
1; urban |
2006.3 |
- |
|
10.77 |
10.42 |
9.63 |
Cui et al. [13] |
|
|
1; urban |
2006.6.16-6.18,6.20-6.22 |
- |
|
9.16 |
7.78 |
2.81 |
Cui et al. [14] |
|
|
1; suburb |
2008.7.9-8.25 |
683 |
41.83 |
20.78 |
10.32 |
7.15 |
Wang [32] |
|
|
1; urban |
2007.10-2008.1 |
- |
|
21.3 |
7.6 |
7.22 |
Liu [25] |
|
|
1; suburb |
- |
|
30.3 |
21.1 |
14.1 |
|||
|
1; urban |
2008.6-2008.10 |
- |
|
34.7 |
30.3 |
13.2 |
||
|
1; suburb |
- |
|
21.1 |
17.8 |
10 |
|||
|
1; suburb |
2008.7-2008.8 |
- |
|
20.74 |
10.32 |
7.15 |
Hu et al. [21] |
|
|
1; urban |
2008 |
- |
109.6 |
|
|
|
Zhao [35] |
|
|
1; suburb |
- |
66.8 |
|
|
|
|||
|
1; urban |
2009.6.5-2009.8.31 |
z |
129.7 |
26.1 |
12.7 |
9.1 |
Hu et al. [21] |
|
|
1; urban |
2009.6.5-2009.11.31 |
|
115.8 |
23 |
9.2 |
6.6 |
||
|
1; urban |
2009.8.1-2009.8.31 |
43 |
102.5/30 samples |
26.9 |
16.1 |
15.8 |
Wang [32] |
|
|
1; urban |
2009~2010 |
121 |
135 |
13.6 |
11.3 |
6.9 |
Zhang et al. [36] |
|
|
9; urban, suburb |
2012.8~2013.7 |
486 |
89.8 |
19.4 |
20.3 |
13.5 |
Yang et al. [33] |
|
|
8; urban, suburb |
2012.8-2013.7 |
472 |
125 |
19.4 |
20.3 |
13.6 |
Liu et al. [26] |
|
|
1; urban |
2012.8.3-2012.8.16 |
126 |
|
12.2 |
9.07 |
6.71 |
Di et al. [17] |
|
|
1; urban |
2012.8-2013.7 |
- |
114.75 |
18.8 |
19.3 |
12.5 |
Lin et al. [24] |
|
|
1; suburb |
- |
82.25 |
15.9 |
14.1 |
10.2 |
|||
|
1; urban |
- |
121.25 |
16.5 |
20.4 |
12.1 |
|||
|
1; suburb |
- |
158 |
19.5 |
19.1 |
12.4 |
|||
|
1; suburb |
- |
144.25 |
23.3 |
22.9 |
15.5 |
|||
|
5; urban, suburb |
2012.8-2013.7 |
Spring |
- |
107.8 |
16.3 |
26.8 |
12.5 |
|
|
Summer |
- |
106.8 |
17.9 |
15.9 |
11.6 |
|||
|
Autumn |
- |
77 |
11.2 |
12.7 |
8.6 |
|||
|
Winter |
- |
204.8 |
31.6 |
24.5 |
17.9 |
|||
|
1; urban |
2013 |
- |
|
24.92 |
11.92 |
9.58 |
Wang et al. [4] |
|
|
2014 |
- |
|
17.97 |
16.99 |
17.61 |
|||
|
1; urban |
2014.11.3~11.20 |
94 |
- |
5.39 |
13.9 |
5.37 |
Dao et al. [15] |
|
|
unpublished data |
2014 |
- |
|
15 |
17.6 |
10.4 |
Ding et al. [16] |
|
|
1; urban |
2014.3-2015.2 |
- |
|
7.24 |
9.89 |
9.15 |
Fang et al. [19] |
|
|
2014.3-2015.2 |
Spring |
- |
|
14.72 |
10.21 |
4.93 |
||
|
Summer |
- |
|
6.98 |
9.85 |
8.29 |
|||
|
Autumn |
- |
|
9.25 |
11.21 |
5.63 |
|||
|
Winter |
- |
|
9.95 |
11.08 |
7.27 |
|||
|
1; urban |
2015.1.1-12.31 |
325 |
79 |
12.7 |
13.5 |
8.1 |
Ding et al. [16] |
|
|
1; urban |
2016.11.15-2016.12.31 |
19 |
114 |
|
|
|
Li et al. [23] |
|
|
Clear day 5d |
59.08 |
4.65 |
4.35 |
2.42 |
||||
|
Light polluted 4d |
95.96 |
7.78 |
12.38 |
8.9 |
||||
|
Moderately polluted 3d |
140.75 |
14.99 |
20.84 |
9.1 |
||||
|
Heavy polluted 4d |
179.29 |
16.68 |
21.67 |
9.32 |
||||
|
Severe polluted 3d |
337.81 |
27.82 |
27.73 |
10.82 |
||||
|
1; urban |
2014 |
Spring |
|
90.8 |
7.6 |
12.6 |
8.7 |
Jia et al. [22] |
|
Summer |
|
88.9 |
15.5 |
13.1 |
10.4 |
|||
|
Autumn |
|
91.5 |
9.1 |
16.6 |
9.2 |
|||
|
Winter |
|
101.4 |
13.3 |
14.8 |
9.1 |
|||
|
2015 |
Spring |
|
73.2 |
9.1 |
16.7 |
10.5 |
||
|
Summer |
|
59.7 |
6.5 |
8 |
6.4 |
|||
|
Autumn |
|
65 |
4.2 |
9.6 |
4.4 |
|||
|
Winter |
|
94.8 |
11 |
16.8 |
11.1 |
|||
|
2016 |
Spring |
|
73.4 |
9.1 |
9.6 |
6.4 |
||
|
Summer |
|
49.2 |
5.3 |
6.6 |
5.2 |
|||
|
Autumn |
|
87.6 |
14.9 |
14.5 |
10.2 |
|||
|
Winter |
|
67.4 |
10.6 |
11.1 |
8.8 |
|||
Table 1: Concentrations of PM2.5 and SO42-, NO3- and NH4+ in Beijing (units: μgm-3).
* : the number of sites used to get the statistical data.
In the early years, the average annual concentrations of PM2.5 were usually more than 100 μgm-3; in more recent years, the values have fallen to below 100 μgm-3 following the intensification of pollution control of fine particles. Nevertheless, the average annual concentrations are still higher than the annual limit value (35 μgm-3) and the daily limit value (75 μg m-3) set by the National Ambient Air Quality Standard (GB3095-2012). The concentration of SO42- is approximately 15 μgm-3, NO3- is approximately 10 μgm-3 and NH4+ is below 10 μgm-3. Prior to 2014, the concentration relationship of these three water-soluble ions was usually [SO42-] > [NO3-] > [NH4+], but in more recent years, the relationship has shifted to [NO3-] > [SO42-] > [NH4+].
Change In SNA Level In PM2.5 In Beijing
Inter annual variation
Figure 1 shows the trends in the annual average concentration of SNA and PM2.5 from 2000 to 2016 in Beijing and figure 2 shows the inter annual changes of SNA proportion in PM2.5 and the ratio of [NO3-] to [SO42-] from 2000 to 2016 in Beijing. For the 2008 Olympic Games, Beijing placed a considerable amount of attention on air pollution control; as a result, from 2000 to 2008, the mass concentration of PM2.5 in Beijing sharply decreased at an average of -5.78 μg m-3 per year. After 2008, a significant PM2.5 pollution rebound was observed that peaked in 2010 (no data are available in 2009 and in 2011), following which PM2.5 concentration again declined year by year. From 2012 to 2016, PM2.5 concentration decreased by 22.7 % and the annual average concentration of PM2.5 in 2016 began to fall below the lowest value even during 2000-2008.
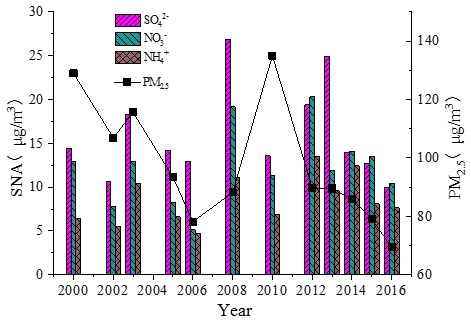
Figure 1: Trends of annual mean of SNA in PM2.5 and PM2.5 from 2000 to 2016.
(In 2008, the annual concentration of SNA was only based on the average of two periods: From October 2007 to January 2008 and from June 2008 to October 2008).
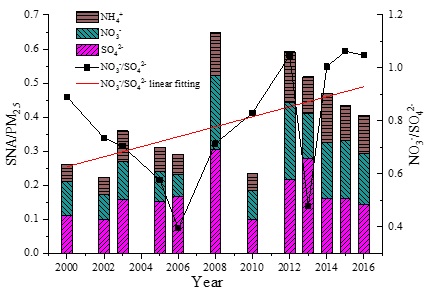
Figure 2: Inter annual changes in the proportion of SNA in PM2.5 and NO3−/SO42− in Beijing from 2000 to 2016.
The mass concentration of SO42- fluctuated from 2000 to 2013 and peaked at 24.92 μgm-3 in 2013 (26.85 μgm-3 in 2008 with no available data from February to May), with an average value of 17.26 μgm-3. Although the mass concentration of PM2.5 dropped to its lowest value in 2008, SO42- did not decline during that same time. After the Olympic Games ended, the mass concentration of SO42- increased significantly by 50.2 %. Then, the mass concentration of SO42- decreased year by year from 2013 onward, which is consistent with the decreasing trend of PM2.5. Studies [38,39] have indicated that the emissions of SO2 in northern China began to decline in 2006 and that the concentration of this material was declining in urban areas. However, the mass concentration trend of SO42- in PM2.5 was not synchronized with the trend of emission and concentration of SO2 in the air, revealing a lagging effect for many years. This may indicate that the primary emission of PM2.5 was largely controlled in the early years, as SO42- mainly existed in the secondary fine particles. It should also be noted there was sufficient SO2 in the air for many years, which provided abundant amounts to meet the needs of the transformation to SO42- in PM2.5. With the intensification of SO2 emission control measures in recent years (e.g., the implementation of measures like “replacing coal with gas” and “replacing coal with electricity” in Beijing and surrounding areas), the content of SO2 in the atmosphere had dropped rapidly and the mass concentration of SO42- in PM2.5 began to decrease. As is evident from the proportion change of SO42- in PM2.5 (Figure 2), the mass concentration of SO42- has been decreasing since 2013, as has its proportion in SNA. Sulfur control measures seemed to have achieved good results in recent years in Beijing and its surrounding areas.
From 2000 to 2016, the average mass concentration of NO3- was 12.31 μgm-3. The lowest value was 5.12 μgm-3 in 2006 and the highest values were 19.20 μgm-3 in 2008 and 20.30 μg m-3 in 2012; changes were modest in the other years. This may indicate that the pollution control measures on nitrate in PM2.5 have had little effect in recent years. Notably, the mass concentration of SO42- in PM2.5 was usually higher than that of NO3- prior to 2012, but NO3- mass concentrations have been equal to or higher than that of SO42- since then (except in 2013), which suggests that the relative importance of NO3- in PM2.5 and in SNA had changed. According to the results of environmental monitoring, the concentration of SO2 has decreased greatly in recent years, but NOx has decreased minimally in Beijing (Figure 3). The number of motor vehicles (the primary emission source of NOx but not SO2) keeps increasing, which appears to be countering the emission control efforts of NOx from fixed sources or coal burning to some extent. Therefore, with the control of SO2 now effective, more attention should be paid to NOx control.
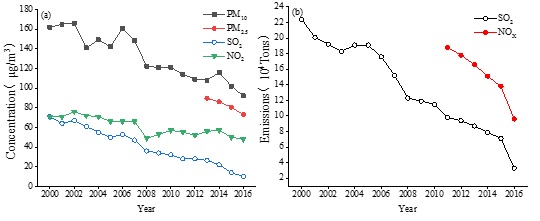
Figure 3: Annual concentration changes of four air pollutants (a) and emissions changes of SO2 and NOx (b)
Data source: Beijing Municipal Ecology and Environment Bureau.
[NO3-]/[SO42-] is often used to characterize the relative contribution of mobile sources and fixed sources to atmospheric fine particles [4]. Taken as a whole, the values of [NO3-]/[SO42-] showed an upward trend from 2000 to 2016 (Figure 2), indicating that the contribution of mobile sources (such as automobile exhaust gases) has gradually increased, whereas those of fixed sources (such as coal burning and other factory emissions) has gradually decreased. Upon closer examination, the value of [NO3-]/[SO42-] manifested a significant downward trend from 2000 to 2006, but since 2006, it has been increasing year by year (except 2013) and the ratio exceeded 1 in 2012. This may indicate that the emission control of coal burning and other factories was relatively weak in Beijing during a period of vigorous economic development before 2006. Since 2006, Beijing has gradually intensified its control of atmospheric particulate matter. Green production, “coal to gas”, factory relocation and other measures have effectively reduced the contribution of fixed sources to atmospheric particulate matter. However, the number of vehicles in Beijing has been increasing year by year and thus the impact of mobile sources emission on PM2.5 in the atmosphere must be considered more closely.
The mass concentration of NH4+ remained relatively stable from 2000 to 2016, with an average concentration of 8.58 μgm-3 and slightly higher levels in 2008 (11.13 μgm-3) and 2014 (12.44 μgm-3). In general, it seems that the recent emission reduction measures in Beijing have had little effect on NH4+ in PM2.5. The average mass concentration of 10.25 μgm-3 after 2010 has increased compared with the value of 7.39 μgm-3 during the previous years and the mass concentration proportion of NH4+ in PM2.5 and SNA has also increased significantly since 2008. As an important cation in PM2.5, NH4+ combines with SO42- and NO3- to form ammonium salt, which occupies a critical proportion in the mass composition of secondary fine particles. The NH4+ in PM2.5 is mainly generated from gaseous NH3 transformation, but the control measures of NH3 have not yet received much attention. In the future, NH3 emission control for PM2.5 reduction should be the main focus.
In recent years, the average annual concentrations of PM10, NO2, SO2 and PM2.5 in Beijing has shown an obvious downward trend (Figure 3), which reflects the gradual improvement of ambient air quality and the effectiveness of controlling the primary emission of atmospheric particulates, such as dust removal from power plants, road dust and building dust. Indeed, the concentration of SO2, NO2 and PM10 decreased by 85.9 %, 32.4 % and 43.2 %, respectively, from 2000 to 2016 and PM2.5 declined 18.9 % from 2013 to 2016. The annual total emission of SO2 and NOx also declined (Figure 3) by 72.9 % and 49.5 %, respectively, from 2011 to 2016. The total emissions of SO2 and NOx show similar decreasing patterns with that of their annual average concentrations, making it clear that the strict control of the total emission of atmospheric primary pollutants can effectively lower their concentrations.
Against the backdrop of decreasing PM2.5 mass concentration in Beijing, the total emission and annual average concentration of SO2 has been decreasing more significantly than that of NOx and NH3. As shown in figure 2, the total mass concentration proportion of SNA in PM2.5 fluctuated from 2000 to 2012, peaking in 2012 (SNA in 2008 was not considered here) and gradually declining after 2012. The proportion of the mass concentration of SO42- in PM2.5 in particular had decreased significantly after 2012. However, the overall proportion of SNA in PM2.5 and each element in SNA after 2012 were higher than the values from 2000 to 2011. The variations of SNA in PM2.5 suggests that the reduction of PM2.5 in Beijing in recent years might be mainly because of primary emissions (e.g., dust and factory emissions), but be limited for secondary PM2.5. With continued reduction of the precursors, the proportion of SNA in the secondary fine particles has declined, although the ratios are still higher than they were in the earlier years. Therefore, the contribution of secondary PM2.5 to PM pollution is becoming increasingly important in Beijing and forms the key focus regarding the control of PM pollution in the coming years. It is necessary to consider synthetic reduction measures of SNA precursors to reduce secondary particulate matter pollution.
Seasonal variation
The average seasonal changes of SNA and PM2.5 were calculated using the complete data from 2013 to 2016, as shown in figure 4. The average change in the proportions of SNA to PM2.5 in different seasons is shown in figure 5.
SO42- had the highest concentration (16.63 μgm-3) in winter, a concentration of 11.30 μgm-3 in summer, a concentration of 10.53 μgm-3 in spring and the lowest concentration (9.85 μgm-3) in autumn. The main source of SO42- is the transformation of SO2 emitted from burning fossil fuels. Thus, the emission of SO2 in winter, the heating season, is much higher than that in other seasons. In addition to the primary emission source, the concentration of SO42- is also determined by the transformation processes of gaseous SO2 to particle SO42- in the air, such as atmospheric photochemical reactions and liquid phase oxidation [19]. Because more radiation intensity occurs in summer, the stronger photochemical reaction facilitates an increasing concentration of SO42-. Therefore, the proportion of SO42- mass concentration in PM2.5 was the largest in summer, followed by that in winter.
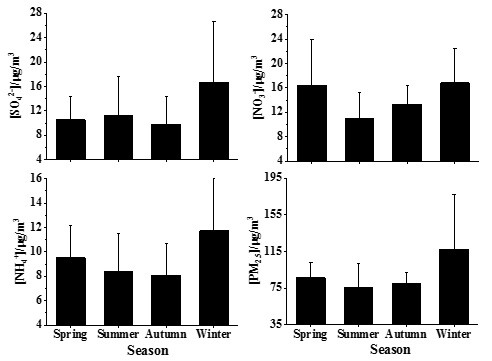
Figure 4: Seasonal variation of the mass concentration of SNA and PM2.5 in PM2.5 in Beijing from 2013 to 2016.
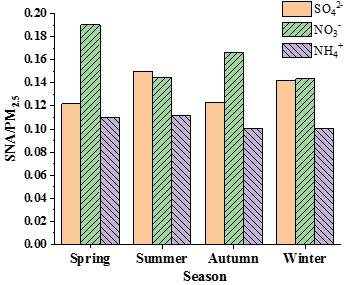
Figure 5: Seasonal variation of the mass concentration proportion of SNA in PM2.5 in Beijing from 2013 to 2016.
The concentration of NO3- was high in winter and spring, with average concentrations of 16.80 and 16.43 μgm-3, respectively. In summer, the concentration of NO3- was at its lowest average concentration (10.90 μgm-3) and in autumn, the concentration of NO3- was 13.35 μgm-3. NO3- is mainly generated from the oxidation process of NOx in the atmosphere, so NO3- and NOx are closely related to meteorological factors. Temperature is a key factor affecting the concentration of NO3-, with NO3- mainly existing in the form of particles when the temperature is below 15°C and in the form of HNO3(g) when the temperature is above 30°C [40]. Considering the slight change in annual motor vehicle exhaust emission intensity in Beijing, the seasonal variation of NO3- concentration may be mainly affected by temperature and other meteorological factors [41]. The lower temperature in winter is conducive to the transformation of HNO3(g) into NO3-(s), making the concentration of NO3- higher in winter. In sum, the proportion of NO3- concentration in PM2.5 in spring and autumn was significantly higher than that in summer and winter and the proportions in summer and in winter were similar.
The seasonal variation of NH4+ concentration was significantly higher in winter than in other seasons, with a concentration of 11.73 μgm-3 in winter, 9.53 μgm-3 in spring, 8.40 μgm-3 in summer and 8.10 μgm-3 in autumn. NH4+ in aerosols is mainly produced from the neutralization reaction between NH3(g) and H2SO4 and HNO3, generating granular NH4+ and NH3 is mainly produced from livestock feeding, farmland emission and the degradation of organic matter [40]. Little difference in the proportions of NH4+ in PM2.5 was noted among the four seasons, ranging only from 10.0 % to 11.0 %, with slightly higher values in summer and spring.
The seasonal variation of PM2.5 concentration was similar to that of NH4+, with the highest concentration in winter (117.10 μgm-3) and the lowest concentration in summer (75.15 μgm-3). From 2013 to 2016, PM2.5 concentrations as well as SO42-, NO3- and NH4+ concentrations significantly decreased during summer (Figure 6). In spring and winter, PM2.5 concentrations also showed a decreasing trend, but SO42-, NO3- and NH4+ concentrations did not. In autumn, PM2.5 and SNA consistently fluctuated in a zigzag pattern. Thus, in summer and autumn, the contributions of SNA to PM2.5 were dominant, indicating a mainly secondary formation of PM2.5. However, in winter and spring, the primary PM2.5 also accounted for a notable percentage and the decrease in PM2.5 concentration in winter and spring may be reflected largely in the reduction of primary PM2.5.
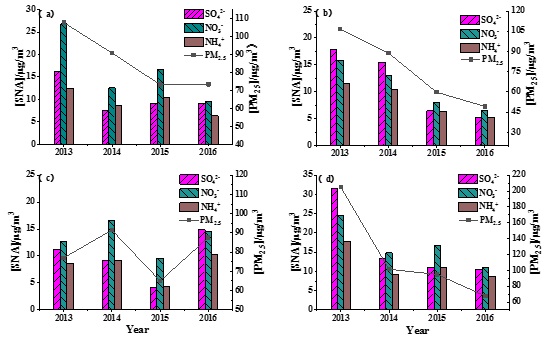
Figure 6: Trend of the mass concentration of PM2.5 in spring (a), summer (b), autumn (c) and winter (d) and the mass concentration of SO42-, NO3- and NH4+ in PM2.5.
CONCLUSIONS AND DISCUSSION
Data on PM2.5 and its three water-soluble inorganic ions (SO42-, NO3- and NH4+ [SNA]) from 1999 to 2016 in Beijing were collected from the extant literature to analyze changes over time. The annual concentrations of PM2.5 exhibited an obvious decreasing trend, whereas the overall level of SNA fluctuated in a “zigzag” shape. The concentrations of SO42- dropped significantly after 2003, but NO3- and NH4+ concentrations stayed relatively constant. Nevertheless, the proportions of NO3- and NH4+ in PM2.5 noticeably increased. This indicates that air pollution control measures have been effective against primary fine particulates and SO42-, but have not been effective against NO3- and NH4+ in recent years.
PM2.5 and SNA concentrations were usually high in winter, but the proportion of SNA in PM2.5 varied from season to season. The SO42- percentage in PM2.5 was high in summer and the NO3- percentage was high in spring and autumn, whereas the NH4+ percentage remained nearly the same across all four seasons. The SNA and PM2.5 concentrations exhibited different trends in different seasons. From 2013 to 2016, PM2.5 and SNA concentrations experienced a similar trend in summer and autumn, but not in winter and spring. It can therefore be concluded that SNA was the dominant contributor to PM2.5 (mainly through secondary formation) in summer and autumn, whereas in winter and spring, the primary PM2.5 also accounted for a considerable proportion.
The concentration levels of SO42- and NO3- and their percentage in PM2.5 were not aligned with the large decrease in their gaseous precursors, SO2 and NOx. For instance, a drop in both the emissions and ambient concentrations of SO2 was found, yet the concentrations and percentage of SO42- still increased before 2013. A continuous downward trend was observed after 2013, but the decreased levels of SO42- concentrations remained the same or higher than that in the early years. NOx emission control measures similarly exerted no obvious influence on the change of ambient NO2 and NO3- concentrations. By contrast, NO3- accounted for a more prominent proportion in PM2.5. NH4+ mass concentrations and its proportion in PM2.5 and in SNA increased in later year in comparison with the earlier ones and thus, NH3 emission control measures should be the focus for future PM control. SO42--NO3--NH4+ in atmospheric particulate matter is a complex equilibrium system, the establishment of which cannot be separated from the atmospheric chemical reactions of the precursor gases such as NH3, SO2 and NOx [42,43]. From the perspective of the variation characteristics of SNA in PM2.5, the gaseous precursors are still sufficient. Therefore, extensive research on SNA collaborative control strategiesis necessary.
The data in our paper were obtained from a wide range of literature, rather than systematic experimental results; therefore, there is a limitation in the data coverage of spatial and temporal distribution. Different type of sites, especially regarding urban and suburban sites, would certainly have different characteristics. However, the analysis in this paper did not separate them, considering the limited amount of data. Most of the data reported in the literature were mean values and the samples affected by extreme weather such as sandstorms (a large natural contribution source) could not be excluded, which might have impacted our trend analysis. The impact of transportation outside of Beijing was also not considered here. For example, the emission data of SO2 only covered the statistical results of Beijing itself, but a large part of PM2.5 measured in Beijing might be transported in from the surrounding areas, which would affect the matching degree of the trends between SO42- and its precursor SO2. Nevertheless, the conclusions of this work provide consequential information.
ACKNOWLEDGMENT
This study was funded by National Natural Science Foundation of China (NSFC) projects (Grant No. 91744206) and the Beijing Municipal Science and Technology Project (Z181100005418016).
REFERENCES
- Wang L (2011) Characterization of atmospheric pollution in Beijing. Master’s Thesis, Shandong University, China.
- Huang YM, Liu ZR, Chen H, Wang YS (2013) Characteristics of mass size distributions of water-soluble inorganic ions during summer and winter haze days of Beijing. Huan Jing Ke Xue 34: 1236-1244.
- Cheng MT, Pan YP, Wang H, Liu Q, Wang YS (2013) On-line measurement of water-soluble composition of particulate matter in Beijing. Huan Jing Ke Xue 34: 2943-2949.
- Wang ZS, Liu BX, Wei Q (2016) Variation characteristics of secondary water-soluble inorganic ions in PM5 in Beijing. Chin J Environ Eng 34: 105-109.
- Tang XY, Zhang YH, Shao M (2006) Atmospheric Environmental Chemistry. China higher education press, Beijing.
- Li LP (2014) Concentration of water-soluble inorganic ions in PM5 and their precursor gases and gas-particle partitioning analysis in Qingdao, China. Master’s Thesis, Ocean University, Shandong. China.
- Wu Z J, Hu M, Shao KS, Slanina J (2009) Acidic gases, NH3 and secondary inorganic ions in PM10 during summertime in Beijing, China and their relation to air mass history. Chem 76: 1028-1035.
- Asman W, Van JH (1992) A variable-resolution transport motel applied for NHx in Europe. Atmos Environ 26: 445-464.
- Zhu T, Shang J, Zhao DF (2010) The role of non-homogeneous chemical processes in the formation of atmospheric composite pollution and haze. Sci China Chem 40: 1731-174.
- Yu XC (2004) Determination and Characterization of Water-Soluble Species of PM5 in Beijing. Stanford University, California, USA.
- Sun YL, Zhuang GH, Wang Y, Han L, GuoJ, et al. (2004) The air-borne particulate pollution in Beijing-concentration, composition, distribution and sources. Atmos Environ 38: 5991-6004.
- Cao JJ, Shen ZX, Chow JC, Watson JG, Lee SC, et al. (2012) Winter and Summer PM5 Chemical Compositions in Fourteen Chinese Cities. J Air Waste Manage 62: 1214-1226.
- Cui R, Gou XB, Deng FR, Liu H (2008) Analysis of pollution characteristics of PM5 and PM10 in heating period in Beijing. Chin J Health Lab Tech 18: 1505-1508.
- Cui R, GouXB, Deng FR, Liu H (2008) Analysis of water -soluble ions and elements in PM10 and PM5. J Environ Health 25: 291-294.
- Dao X, Zhu HX, Tan L (2015) Variations of PM5 and its water-soluble ions in Beijing and surrounding cities during the APEC in 2014. Chin J Environ Chem 34: 1389-1395.
- Ding MM, Zhou JN, Liu XB, Wang Y, Zhang BT, et al. (2017) Pollution characteristics of NH4+, NO3-, SO42- in PM5 and their precursor gases during 2015 in an urban area of Beijing. Huan Jing Ke Xue 38: 1307-1316.
- Di YA, Zhou R, Yu Y (2014) Distribution characteristics of water-soluble ions in atmospheric particle size in summer Beijing. 2014 Chinese society for environmental science annual conference.
- Duan FK, He KB, Ma YL, Yang FM, Yu XC, et al. (2006) Concentration and chemical characteristics of PM5 in Beijing, China: 2001-2002. Sci Total Environ 355: 264-275.
- Fang JL, Liu J, Wang HW, Hao SX, Dong XY (2016) Distribution characteristics and influencing factors of nine water-soluble ions in PM5 in Beijing. J Environ Health 33: 317-319.
- He KB, Yang FM, Ma YL, Zhang Q, Yao Y, et al. (2001) The characteristics of PM5 in Beijing, China. Atmos Environ 35: 4959-4970.
- Hu GY, Zhang YM, Sun JY, Zhang L, Shen X, et al. (2014) Variability, formation and acidity of water-soluble ions in PM5 in Beijing based on the semi-continuous observations. Atmos Res 145-146: 1-11.
- Jia J, Han LH, Cheng SY, Zhang HY, Lv J (2018) Pollution characteristic of PM5 and secondary inorganic ions in Beijing-Tianjin-Hebei region. Chin Environ Sci 38: 801-811.
- Li, X, Zhao WJ, Xiong QL, Yu X, Wang HH (2018) The pollution characteristics and influencing factors of PM5 inorganic water-soluble ions in Beijing during heating season. Eco Environ Sci 27: 93-100.
- Lin AG, Liang YP, Zhang ZP (2017) The chemical characteristics of PM5 in Beijing from 2012 to 2013. Eco Environ Sci 26: 1174-1179.
- Liu H (2010) Temporal and spatial distribution of water-soluble species of particulate matter in Beijing and its surrounding areas. Tsinghua University, Beijing , China.
- Liu BX, Zhang DW, Chen T (2015) Characteristics and major chemical compositions of PM5 in Beijing. Acta Sci Circumst 35: 4053-4060.
- Pathak RK, Wu WS, Wang T (2009) Summertime PM5 ionic species in four major cities of China: Nitrate formation in an ammonia-deficient atmosphere. Atmos Chem Phys 9: 1711-1722.
- Sun ZQ, Shao LY, Liu YJ (2008) Analysis of water-soluble inorganic ion pollution in air particles in Beijing. Proceedings of the 12th national ion chromatography symposium.
- Tao J, Zhang LM, Cao JJ, Zhang RJ (2017) A review of current knowledge concerning PM5 chemical composition, aerosol optical properties and their relationships across China. Atmos Chem Phys 17: 9485-9518.
- Wang Y, Zhuang GS, Tang AH, Yuan H, Sun Y, et al. (2005) The ion chemistry and the source of PM5 aerosol in Beijing. Atmos Environ 39: 3771-3784.
- Wang HL, Zhou YM, Zhuang YH, Wang XK, Hao ZP (2009) Characterization of PM5/PM2.5-10 and source tracking in the juncture belt between urban and rural areas of Beijing .Chin Sci Bull 54: 2506-2515.
- Wang J (2010) Characterization and source apportionment of inorganic water-soluble ions in PM5 aerosol before and during Olympic in Changping. Stanford University, California, USA.
- Yang DY, Liu BX, Zhang DW, Chen YY, Zhou JN, et al. (2015) Correlation, seasonal and temporal variation of water-soluble ions of PM5 in Beijing during 2012-2013. Chin J Environ Sci 36: 768-773.
- Yao XH, Chan CK, Fang M, Cadle S, Chan T, et al. (2002) The water-soluble ionic composition of PM5 in Shanghai and Beijing, China. Atmos Environ 36: 4223-4234.
- Ge X, He Y, Sun Y, Xu J, Wang J (2010) Characteristics and formation of inorganic fine particulate pollution in typical regions of China. Atmosphere 8: 62.
- Zhang R, Jing J, Tao J, Hsu SC, Wang G, et al. (2013) Chemical characterization and source apportionment of PM5 in Beijing: Seasonal perspective. Atmos Chem13: 7053-7074.
- Zhou W, Gao M, He Y, Wang QQ, Xie CH, et al. (2019) Response of aerosol chemistry to clean air action in Beijing, China: Insights from two-year ACSM measurements and model simulations. Environ Pollut 255: 113345.
- Lu Z, Streets DG, Zhang Q, Wang S, Carmichael GR, et al. (2010) Sulfur dioxide emissions in China and sulfur trends in East Asia since 2000. Atmos Chem Phys 10: 6311-6331.
- Lin WL, Xu XB, Ma ZQ, Zhao HR, Liu XW (2012) Characteristics and recent trends of surface SO2 at urban, rural and background sites in North China: Effectiveness of control measures. J Environ Sci 24: 34-49.
- Han YM, Shen ZX, Cao JJ (2009) Seasonal variation characteristics of water-soluble inorganic ions in atmospheric particulate matter in Xi 'an. Environ Chem 28: 261-266.
- Zhao YN, Wang YS, Wen TX, Dai GH (2014) Seasonal variation of water-soluble ions in PM5 at Changbai Mountain. Huan Jing Ke Xue 35: 9-14.
- Koziel JA, Aneja VP, Baek BH (2006) Gas-to-particle conversion process between ammonia, acid gases and fine particles in the atmosphere. Animal Agriculture and the Environment: National center for Manure and Animal Waste Management, 2006: 201-224.
- Zhang XY, Wang YQ, Lin WL, Zhang YM, Zhang XC, et al. (2009) Change of atmospheric composition and optical properties over Beijing 2008 Olympic Monitoring Campaign. B Am Meteorol Soc 90: 1633-1651.
Citation: Zhang X, Chen Y, Qin Y, Lin W (2020) Change in SO42-, NO3- and NH4+ levels in PM2.5 in Beijing from 1999 to 2016. J Environ Sci Curr Res 3: 018.
Copyright: © 2020 Xiaoyi Zhang, et al. This is an open-access article distributed under the terms of the Creative Commons Attribution License, which permits unrestricted use, distribution, and reproduction in any medium, provided the original author and source are credited.