Characterization of Groundwater in the Basaltic Fractured Rock Aquiferous Formations of the Limbe Coastal Region of Mount Cameroon, SWR-Cameroon
*Corresponding Author(s):
Akoachere RADepartment Of Geology, University Of Buea, Buea, Cameroon
Tel:+237 690153887,
Email:r.akoachere@ubuea.cm
Abstract
Keywords
INTRODUCTION
Limbe the Fako Divisional headquarters of the Southwest Region in Cameroon is situated between 3.96-4.06N and 9.15-9.24E shown in figure 1. As an urban town with over 130,000 inhabitants [1] and insufficient water supply by the national water supply company CAMWATER, the inhabitants are obliged to turn to other sources of water such as natural springs, community water project catchments, hand-dug wells and boreholes. The inhabitants of parts of Limbe have always complained of low quality of drinking water from wells during the rainy season as such, there was a need to carry out this research to determine the root cause of this loss of quality during the rainy season. With the population explosion and the increased need for groundwater for economic development such as agriculture, industrial and domestic activities, understanding the groundwater chemical character and the aquiferous formations through which this water flows is of great importance for the future development of this region and sustainable use and protection of this aquifer system.
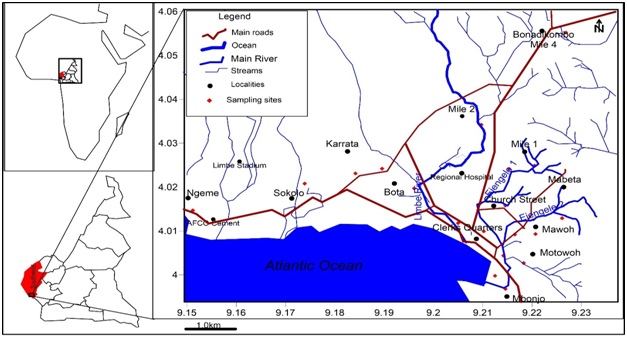
Figure 1: Map of the Study Area, Limbe-Southwest Region Cameroon.
Climate
Limbe experiences a subequatorial climate (hot and humid throughout) with mainly two distinct seasons; a rainy season between April to October and a dry season from November to March with a mean annual rainfall of about 3,100 mm, ±1,100 standard deviation [2]. The annual rainfall is high, with yearly precipitations varying from 1,500 to 6,000 mm in the last 34 years for different stations. Peak rainfall is recorded from June to August or September. June and July are characterized by intense and short-lived rainfall usually lasting less than 5hours a day. Whereas, August and September tend to experience less intense but more prolonged rainfalls that can last for 4 to 5 days in a row. Monthly rainfall totals frequently attain over 500 mm and sometimes up to 1,000 mm in June, July and August. The mean annual temperature is ~26 °C and shows only limited variations of ~4° throughout the year. Humidity is generally above 85%. These characteristics correspond to the Tropical Monsoon Climate according to the Köppen climate classification scheme [3,4].
Drainage
Limbe and Ejengele are the two main rivers in Limbe with the former being the largest. Limbe River takes its rise from Mt Cameroon, through Mile 4, Mile 2, Middle farms, Botanic Garden and into the Atlantic Ocean. Limbe River has a trellis drainage pattern with all its numerous tributaries running parallel down the slopes of Mount Cameroon. The slopes are steep, up to 43%, causing the streams to flow with high velocities. Other smaller streams consist of: Mange, Sange-Mile 4, Grand Lake-Mile 2, Konkikar, Balimba-Mabeta New layout, Motowoh water and Ndiba water. There are numerous springs notably: Likomba, Toma-Mile 4, Busumbu spring-mile 2, Cold source Mile 1 and Crystal garden. Gravity catchments have been constructed around some other smaller springs for additional water supply; Mile 4, Mabeta, Mawoh, Motowoh, Batoke. The serivers empty into the Atlantic Ocean.
Geology
Limbe sits on the plains and south eastern slopes of the ridge of Mount Cameroon separating the Rio del Rey and Douala basins; the Cameroon Volcanic Line presented in figure 2. The geology of Limbe is volcanic being consequent of the eruptive events of Mount Cameroon. The geology is of tertiary basaltic rocks composed of multiple porphyritic basaltic lava flows, punctuated by several strombolian pyroclastic cones to the West and North West and lahar deposit to the East seen in figure 2. These rocks either lie exposed at the surface or are covered by extremely fertile dark brown, reddish brown, yellowish and/or pale yellow sticky, clay, silt and silty clayey soils derived from intense in situ weathering. Soil thicknesses range from a few centimeters to more than 10 m [2]. The mineral content of basalts in Limbe consists mainly of Clinopyroxene (Ca(TiMgAl) SiAl)2O6), Hematite (Fe2O3), and Goethite (FeO(OH) and the soils comprises mainly of Anatase (TiO2), Annite (KFe3AlSiO10(OH,F)2), Augite (Ca2(Al-Fe)4(MgFe)4Si6O24), Goethite, Hematite, and Kaolinitic (Al2Si2O5(OH)4) minerals.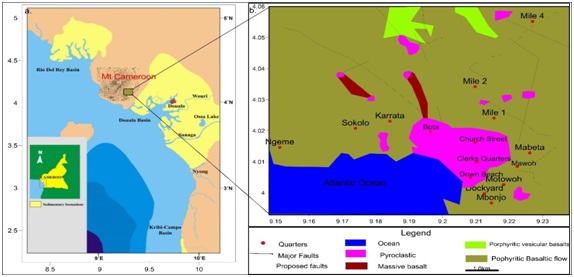 Figure 2: Sedimentary basins sandwiching Mount Cameroon and location of Limbe b. Geologic Map of Limbe and Environs, indicating the main geomorphologic characteristics, trend of the hydrographic network and morphology of some pyroclastic cones [2].
Geomorphology
The topography is marked by ridges and deeply incised ravines with a general W-E orientation, at high angle to the general NE-SW orientation of Mt Cameroon and gently sloping foot slopes of Mt Cameroon. These ridges form part of the Limbe-Mabeta volcanic massif, made up of degraded and deeply weathered Tertiary basaltic lava flows [5] The Limbe-Mabeta massif is an eroded volcanic massif SSE of Mt Cameroon. It is characterized by a series of sub-parallel E-W oriented valleys bordered by the 170°-striking Om be structure on its Eastern side [6]. Individual ridges are separated by asymmetric V-shaped valleys occupied by perennial and/or ephemeral streams. These streams either empty themselves directly into the ocean or into the delta around Mabeta.
Hydrogeology
Very little work has been done on the hydrogeology of Limbe with sparse data to correlate. Some groundwater baseline hydrogeochemical studies have been carried out around Mount Cameroon [7-10]. The Limbe area is made up mostly pyroclastic and of jointed weathered fractured and columnar basalt resulting in volcanic fractured rock aquifers where saturated. In addition, Limbe being a coastal area in contact with the sea may experiences seawater intrusion.
From geophysical sections and bore well drill cuttings, the lithostratigraphy is sub-divided into three layers as in figure 3; a soil cover formation topmost which constitutes weathered rocks, recent degradation of lava flows, transported materials, black soils and volcanic sands. This formation has a smaller volume as compared to the underlying basalts and has received only minor alterations by tectonic activities. The intermediate layer is made up of younger fractured columnar basalts and volcanic sand that constitute the aquifer. The basaltic rocks show traces of grinding, crushing, fracturing in a SW-NE direction, these fractures are the major fractures determining the storage of groundwater in the aquifers in the basal to-andesitic formation. The Ancient massive basalts bottom Formation make up the oldest formation and these rocks are the oldest in age. This formation has no fractures and as such do not contain water.
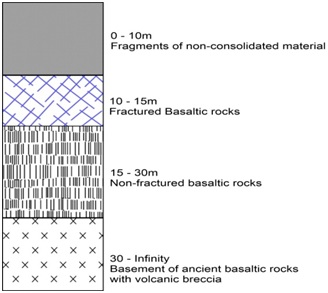 Figure 3: Geophysical section of formations in, Limbe
MATERIALS AND METHODS
Materials
|
Equipment/Softwares |
Specifications |
Functions |
|
Bike |
Commercial bikes (Bensikin) |
To transport fieldworkers to wells |
|
GPS |
GARMIN GPSMAP 60CSx |
To measure longitude, latitude and elevation of wells |
|
EC Meter |
HANNA HI 98304/HI98303 |
To measure Electrical Conductivity of water. |
|
pH Meter |
HANNA HI 98127/HI98107 |
To measure pH of water. |
|
Water level indicator |
Solinst Model 102M |
To indicate static water levels of water in wells |
|
Measuring Tape |
Weighted measuring tape |
Measurement of well diameter and depth. |
|
Digital Thermometer |
Extech 39240 (-50 to 200°C) |
To measure temperature of water |
|
Total Dissolved Solid meter |
Hanna HI 96301 with ATC |
To measure Total dissolved solids in water |
|
Water sampler |
Gallenkampf 1000ml |
To collect well water sample from well |
|
Sample bottles |
Polystyrene 500ml |
To hold sample for onward transmission to laboratory |
|
ArcGIS |
Version 10.1 |
GIS Drawing sampling/Tests location maps |
|
Global Mapper |
Version 15 |
GIS Geolocation of wells |
|
Surfer Golden Software |
Version 12 |
GIS plotting contours for spatial distribution |
|
AqQA/Aquachem |
Version 15 |
For the analysis/interpretation of water chemistry |
Methods
A field visit was done in August 2016 by with hydrogeological traverse field mapping to determine appropriate hand-dug wells, boreholes, springs and streams. Field measurements and sampling started from Moliwethrough to Down Beach. The city of Limbe was divided into zones and work was carried out in two seasons; wet season September 2016 and dry season February 2017. GIS platforms were used to analyze field data for the creation of sample location, drainage and water level contour maps.
Measurements were carried out for longitudes, latitudes, Surface elevation, Wells: Well water level and Well depths Groundwater tests were carried out as follows: 897 in situ tests were carried out in 154 wells (147 hand dug wells and 7 boreholes) for Temperature (°C), pH, Electrical Conductivity (EC) and Total Dissolved Solids (TDS). Nine9 selected wells went dry during dry season. Forty 40 groundwater samples were collected; 20 samples 13 hand-dug wells, 5 boreholes, 1 river and 1 spring for each season. Samples were collected in 500ml containers, sealed and sent to Institute of Agricultural Research and Development-I.R.A.Dusing the standard methods APHA [15] to analyze for:
• Major cations in mg/L: Ca2+, Mg2+, Na+, K+ and NH4+.
• Major anions in mg/L: HCO3-, Cl- , SO42-, HPO42- and NO3-
To fully understand the relationship between the geology of the area, groundwater, hydrogeochemical tools were used such as:
Ionic ratio for indicative elements is a useful hydrogeochemical tool to identify source rock of ions and formation contribution to solute hydrogeochemistry [16].These were used in this study.
Gibbs Diagram is a plot of Na+/ (Na++HCO3- Ca2+) and Cl-/ (Cl+HCO3-) as a function of TDS are widely employed to determine the sources of dissolved geochemical constituents. These plots reveal the relationships between water composition and the three main hydrogeochemical processes involved in ions acquisition; Atmospheric precipitation, rock weathering or evaporation crystallisation.
Pipers Diagram is a graphical representation of the chemistry of water sample on three fields; the cation ternary field with Ca, Mg and Na+K apices , the anion ternary field with HCO3, SO4 and Cl- apices. These two fields are projected onto a third diamond field. The diamond field is a matrix transformation of the graph of the anions [sulphate chloride]/? anions and cations [Na+K]/? cations. This plot is a useful hydrogeochemical tool to compare water samples, determine water type and hydrogeochemical facies Langguth [17]. This has been used here for these purposes.
Durov diagram is a composite plot consisting of two ternary diagrams where the mill equivalent percentages of cations are plotted perpendicularly against those of anions; the sides of the triangles form a central rectangular binary plot of total cation vs. total anion concentrations. These are divided into nine classes by Lloyd and Heathcoat [18] which give the hydrogeochemical processes determining the character of the water types in the aquiferous formation Langguth [17].
WQI was calculated by adopting Weighted Arithmetical Index method considering thirteen water quality parameters (pH, EC, TDS, total alkalinity, total hardness, Ca2+, Mg2+, Na+, K+, Cl-, SO42-, NO3-, NH4+) in order to assess the degree of groundwater contamination and suitability listed in table 2.
|
Indices |
Formula |
Reference |
|
Percentage Sodium |
|
Wilcox (1955) [21] |
|
Kelly’s Ratio |
|
Kelly (1940) [22] |
|
Magnesium Adsorption Ratio |
|
Palliwal (1972) [23] |
|
Total Hardness |
TH (CaCO3) mg/L = 2.5 Ca2+ + 4.1Mg2+ |
Todd (1980) [24] |
|
Residual Sodium Carbonate |
|
Eaton (1950) [25] |
|
Sodium Adsorption Ratio |
|
Richard (1954) [26] |
|
Permeability Index |
|
Doneen (1962) [27] |
|
Water Quality Index |
|
Sisodia and Moundiotiya (2006) [20] |
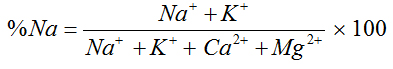
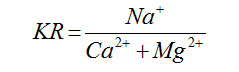
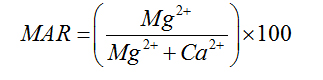
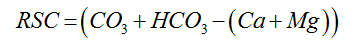
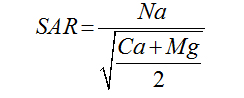
For Agro-industrial suitability the following parameters were used; sodium adsorption ratio SAR, permeability index PI, Magnesium adsorption ratio MAR, percent sodium %Na, Kelly’s ratio KR and Residual sodium carbonate RSC and Wilcox diagram listed in table 2.
The following software’s; Surfer 12, Global mapped 11 and AqQA 1.5 AGIS 10.3 were used for data presentation, interpretation and analysis.
RESULTS AND INTERPRETATION
The field measured physicochemical parameters of groundwater in Limbe are: Temperature, pH, EC and TDS for selected wells in each quarter shown in table 3. The summary statistics for all 154 tested wells in Limbe is shown in table 4. The EC values (WEC; DEC) increase with decrease in the Distance to Shoreline (DS) in both seasons. Wet season ECs (WEC) are lower than dry season ECs (DEC) as in figure 4.
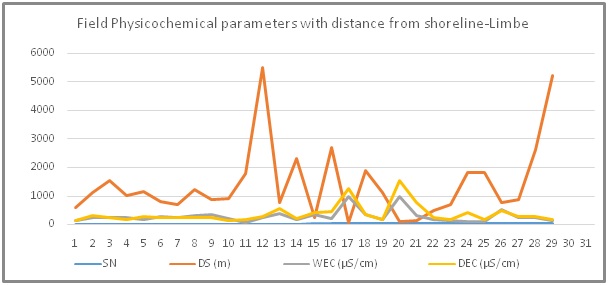 Figure 4: Seasonal variations in field measured groundwater electrical conductivities with distance from shoreline in Limbe: The EC values (WEC; DEC) increase with decrease in the distance to shoreline (DS) in both seasons. Wet season ECs (WEC) are lower than dry season ECs (DEC).
|
SN |
Location |
E |
N |
SE (m) |
DS(m) |
WD (m) |
WSL(m) |
WT (0C) |
WpH |
WEC (µS) |
WTDS (mg/L) |
DSL |
DT (0C) |
DpH |
DEC (µS) |
DTDS (mg/L) |
|
1 |
Motowoh |
9.2183 |
4.0027 |
9 |
574.59 |
2.68 |
1.64 |
27.2 |
7.6 |
119 |
79.73 |
1.86 |
28.3 |
6.7 |
130 |
87.1 |
|
2 |
New Town |
9.2146 |
4.0158 |
29 |
1113.61 |
42 |
25 |
27.2 |
7.8 |
208 |
139.36 |
29 |
26.2 |
6.9 |
295 |
197.65 |
|
3 |
Karrata 2 |
9.1896 |
4.0242 |
70 |
1511.49 |
62 |
40 |
26.2 |
7.9 |
217 |
145.39 |
45 |
28.7 |
6.9 |
212 |
142.04 |
|
4 |
Sokolo |
9.1739 |
4.0208 |
109 |
1011.36 |
36 |
25 |
25.7 |
8 |
225 |
150.75 |
30 |
28.5 |
6.9 |
144 |
96.48 |
|
5 |
Mawoh |
9.2207 |
4.0093 |
32 |
1144.73 |
5.83 |
3.11 |
27.1 |
6.3 |
162 |
108.54 |
3.45 |
28.7 |
6.6 |
248 |
166.16 |
|
6 |
Clerks Qters |
9.2102 |
4.0099 |
4 |
776.86 |
2.45 |
1.5 |
25.1 |
8.2 |
245 |
164.15 |
2.25 |
27.8 |
6.9 |
227 |
152.09 |
|
7 |
Ngeme |
9.1512 |
4.0147 |
34 |
669.06 |
45 |
16 |
25.6 |
7.8 |
238 |
159.46 |
20 |
25.8 |
7 |
224 |
150.08 |
|
8 |
Karrata |
9.1842 |
4.0231 |
77 |
1200.3 |
55 |
30 |
25.6 |
8 |
282 |
188.94 |
30 |
27.1 |
6.9 |
231 |
154.77 |
|
9 |
Church Str. |
9.2096 |
4.0164 |
30 |
861.33 |
2.69 |
1.79 |
27 |
7.4 |
334 |
223.78 |
2.18 |
28 |
6.9 |
217 |
145.39 |
|
10 |
Mbonjo |
9.2146 |
3.998 |
30 |
900.23 |
1.86 |
1 |
26.6 |
7.6 |
180 |
120.6 |
0.71 |
27.8 |
6.9 |
121 |
81.07 |
|
11 |
Mabeta |
9.2261 |
4.0129 |
39 |
1778.22 |
7.59 |
2 |
26.3 |
7.2 |
46 |
30.82 |
5.6 |
30.4 |
7 |
166 |
111.22 |
|
12 |
Mile 4 |
9.2269 |
4.0552 |
240 |
5512.49 |
2.73 |
1.64 |
25.5 |
8 |
221 |
148.07 |
2.19 |
27.5 |
6.7 |
259 |
173.53 |
|
13 |
West end |
9.2165 |
4.0092 |
18 |
742.41 |
3.59 |
1 |
26.9 |
7.7 |
378 |
253.26 |
2.02 |
28.4 |
7.1 |
544 |
364.48 |
|
14 |
Mile 1-2 |
9.2205 |
4.0249 |
79 |
2311.69 |
2.85 |
1.93 |
26.1 |
8.5 |
138 |
92.46 |
2.37 |
27.5 |
6.8 |
187 |
125.29 |
|
15 |
Kulu |
9.2142 |
4.0044 |
24 |
217.83 |
2.65 |
1.07 |
26.3 |
7.9 |
330 |
221.1 |
1.9 |
28.1 |
7.2 |
414 |
277.38 |
|
16 |
Mile 2 |
9.2097 |
4.0342 |
49 |
2674.45 |
2.86 |
1.6 |
25.4 |
7.2 |
196 |
131.32 |
1.6 |
27.8 |
7 |
452 |
302.84 |
|
17 |
Dockyard |
9.2125 |
3.9998 |
1 |
46.57 |
2.82 |
1.17 |
27.1 |
7.7 |
963 |
645.21 |
1.85 |
28.8 |
7.2 |
1240 |
830.8 |
|
18 |
Mile 1 |
9.2154 |
4.0241 |
60 |
1889.36 |
3.83 |
3.45 |
26.3 |
8 |
335 |
224.45 |
3.75 |
27.3 |
6.8 |
334 |
223.78 |
|
19 |
Sokolo 2 |
9.1743 |
4.0213 |
81 |
1120.28 |
40 |
25 |
25.8 |
8.2 |
150 |
100.5 |
25 |
29 |
6.9 |
144 |
96.48 |
|
20 |
Dockyard 2 |
9.2126 |
3.9998 |
14 |
92.24 |
2.65 |
1 |
26.3 |
7.7 |
947 |
634.49 |
1.73 |
28.6 |
7 |
1515 |
1015.05 |
|
21 |
Kulu 2 |
9.2138 |
4.0029 |
8 |
124.36 |
2.89 |
1.04 |
26.8 |
8 |
284 |
190.28 |
1.79 |
28.6 |
7.3 |
742 |
497.14 |
|
22 |
Mbonjo 2 |
9.2152 |
3.9975 |
22 |
466.78 |
3.88 |
2.4 |
26.2 |
7.8 |
142 |
95.14 |
3.39 |
27.7 |
6.7 |
218 |
146.06 |
|
23 |
Motowoh 2 |
9.2186 |
4.0008 |
20 |
669.06 |
6.48 |
2.64 |
27.2 |
7.3 |
101 |
67.67 |
6.23 |
27.5 |
6.7 |
156 |
104.52 |
|
24 |
Mawoh 2 |
9.2251 |
4.0126 |
52 |
1811.56 |
11.38 |
3.74 |
26.5 |
7.2 |
98 |
65.66 |
11.17 |
27.3 |
6.8 |
404 |
270.68 |
|
25 |
Mabeta 2 |
9.2252 |
4.0131 |
37 |
1794.89 |
6.09 |
4.65 |
26.6 |
6.6 |
81 |
54.27 |
5.48 |
27.5 |
6.7 |
156 |
104.52 |
|
26 |
Westend 2 |
9.2163 |
4.0101 |
22 |
761.3 |
4.6 |
2.45 |
27.7 |
7.5 |
502 |
336.34 |
2.45 |
28.2 |
7.1 |
466 |
312.22 |
|
27 |
Church Str. 2 |
9.2091 |
4.0171 |
21 |
865.77 |
3.81 |
2 |
26.2 |
7.7 |
237 |
158.79 |
3.7 |
28 |
6.8 |
260 |
174.2 |
|
28 |
Mile 2-2 |
9.2108 |
4.0337 |
78 |
2622.88 |
4.34 |
4.16 |
26.1 |
7.1 |
226 |
151.42 |
4.16 |
27.1 |
7 |
254 |
170.18 |
|
29 |
Mile 4-2 |
9.2266 |
4.0522 |
245 |
5223.53 |
4.14 |
3.5 |
25.3 |
7.3 |
124 |
83.08 |
3.5 |
26.6 |
7 |
167 |
111.89 |
|
Parameters |
Wet |
Dry |
||||||
|
Min |
Max |
Mean |
Std. |
Min |
Max |
Mean |
Std. |
|
|
T(oC) |
22.3 |
27.9 |
26.43 |
0.71 |
24.1 |
30.4 |
28.04 |
0.88 |
|
PH |
6.1 |
8.5 |
7.28 |
0.51 |
6.4 |
7.8 |
6.84 |
0.23 |
|
EC (µS/cm) |
38 |
963 |
213.87 |
160.35 |
59 |
1515 |
282.64 |
208.51 |
|
TDS (mg/L) |
30.15 |
645.21 |
166.93 |
107.4 |
81.07 |
830.8 |
204.25 |
139.70 |
The wells are at surface elevations of 1m to 245m with well-depths ranging from 1.8 to 6.2m and at distances from shoreline of 46.67 to 5223.53m.
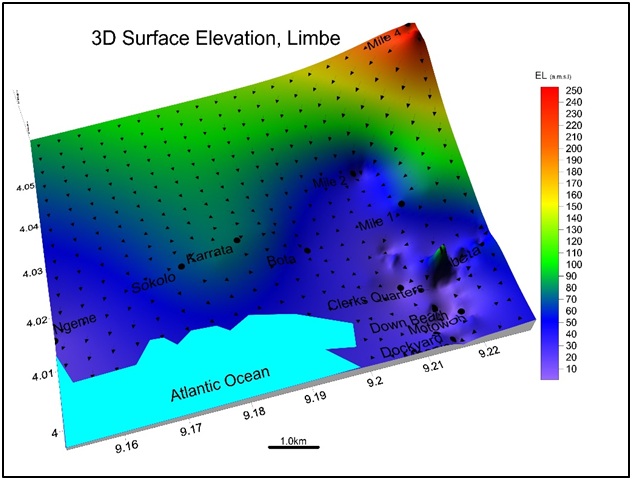
Surface elevation: Surface elevations range from -2m.a.m.s.l at lower Motowoh to 256 a.m.s.l at Mile 4 shown in figure 5. Limbe is low lying on the shorelines of the Atlantic Ocean at the foot hills of Mount Cameroon. The low elevation areas are prone to floods in the rainy season.
Well parameters: The wells have depths ranging from 0.75m at Church Street to 13.17m at Upper Mawoh for hand-dug wells and from 36m at Sokolo (Bota New layout) to 62m at Lake Restaurant (Sokolo old road) for boreholes, depth to water levels ranged from 0.22m at Church Street to 8.17m at upper Mawohfor hand-dug wells and 20m at Lake Restaurant to 40m at Karrata shown in figure 6.
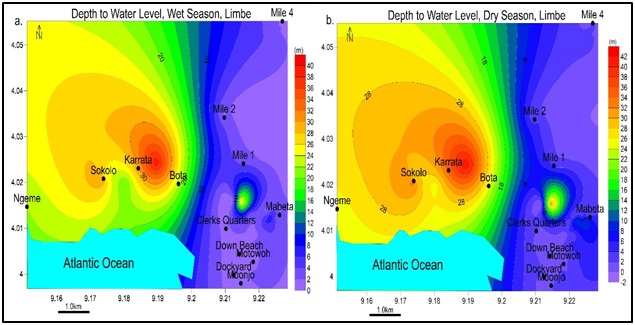 Figure 6: Groundwater level contours for (a) wet season and (b) dry season; with least value at Church Street (0.22m) and highest value at Karrata (40m) in both seasons. Groundwater can be found at shallow levels like Church unlike Karrata.
Groundwater level contours: From elevation and depth to water level, the groundwater contours were drawn with equipotential vectors simulating groundwater flow lines and flow direction presented in figure 7. Groundwater levels mimic the surface topography from high areas Mile 4 to low areas Church Street, Mbonjo. The groundwater flows into the Atlantic Ocean.
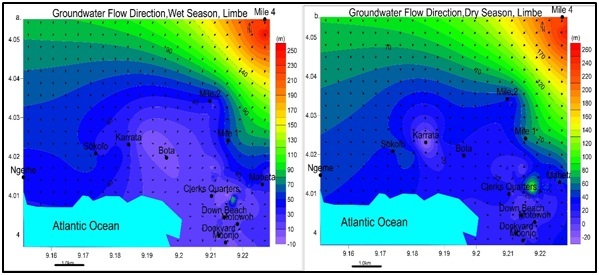 Figure 7: Spatial variation of Flow direction for (a) wet season and (b) dry season. Note: water moves away from peak values area (Mile 4) and moves towards lower value areas (Church Street, Clerk quarters, Mabeta, Dockyard) and into the ocean.
Temperature: The temperature values ranged from 22.3 - 27.9°C in the wet season and 24.1 - 30.4°C in the dry season seen in figure 8. The temperatures of groundwater in Limbe and environs are relatively low. There is a general increase from wet to dry season.
 Figure 8: Spatial variation of Temperature values for both a) wet and b) dry seasons. There is an increase from wet to dry season. The lowest values come from areas along the Atlantic Ocean. Highest values are found in the North, Northwest a1nd Southeast of Limbe.
pH: pH values ranged from slightly to alkaline 6.1-8.5 in the wet season and slightly acidic to peralkaline 6.4-7.8 in the dry season as in figure 9.
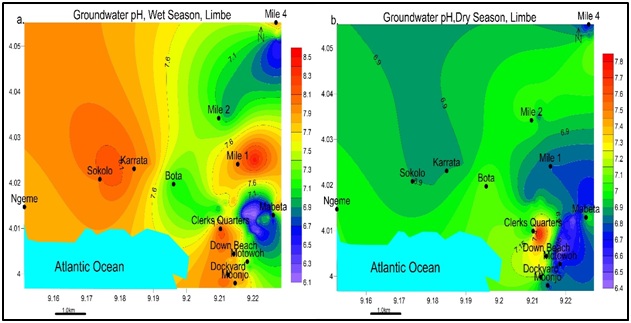 Figure 9: Spatial variation of pH values for a) wet and b) dry seasons. Highest values are found North, Northwest through South in the wet season and Southeast in the dry season. Note: pH values are more elevated in the wet season than dry season.
Electrical Conductivity (EC): The values ranged between 38-963 μS/cm in wet season and 59-1515 μS/cm in the dry season shown in figure 10. The higher values of electrical conductivity are due to high solute concentration in water.
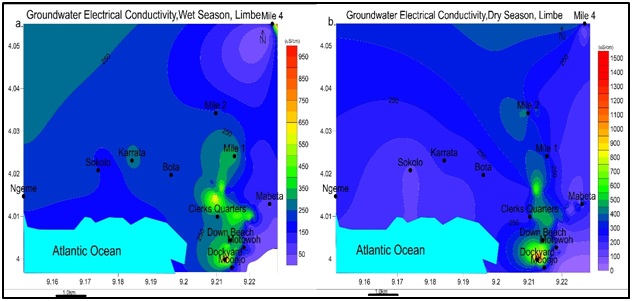 Figure 10: Spatial variation of Electrical Conductivity EC values for: a) wet and b) dry seasons. EC is maximum in the dry season and peaks Southeast of Limbe for both seasons. The highest value is 963 μS/cm in the wet season, and 1515 μS/cm in dry season, was recorded in Dockyard, Limbe.
Total dissolved solids: TDS ranged from 25.46 to 645.21 mg/L in the wet season and 39.53 to 830.8 mg/L in the dry season seen in figure 11. This indicates a freshwater area except for Dockyard.
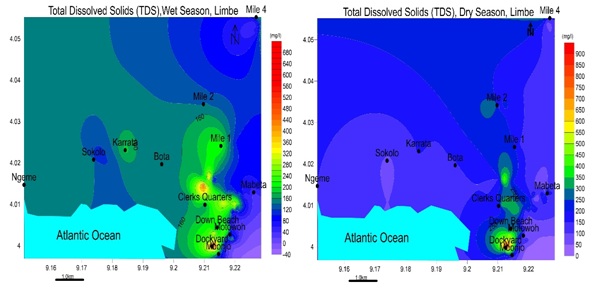 Figure 11: Spatial variation of Total Dissolved Solids for: a) wet and b) dry seasons. TDS is maximum in the dry season and peaks Southeast of Limbe for both seasons but the TDS shows a more distributed load of higher concentration in the wet season from Northwest to Southeast.
Chemical properties of groundwater
The results of the chemical analysis varied in both seasons. In the wet season Ca+>K+>Mg2+>Na+>NH4+- HCO3- >Cl->HPO42->SO42->NO3- and Ca+>K+>Mg2+>Na+- HCO3- >Cl->SO42->HPO42->NO3- dry season. Cl-is widespread in the wet season than the dry season and peaks at Dockyard for both seasons. Most samples indicated a lack or decrease in Cl- concentration in the dry season with the exception of Dockyard which experiences an increase in Cl- concentrations presented in tables 5, 6, and figures 12, 13.
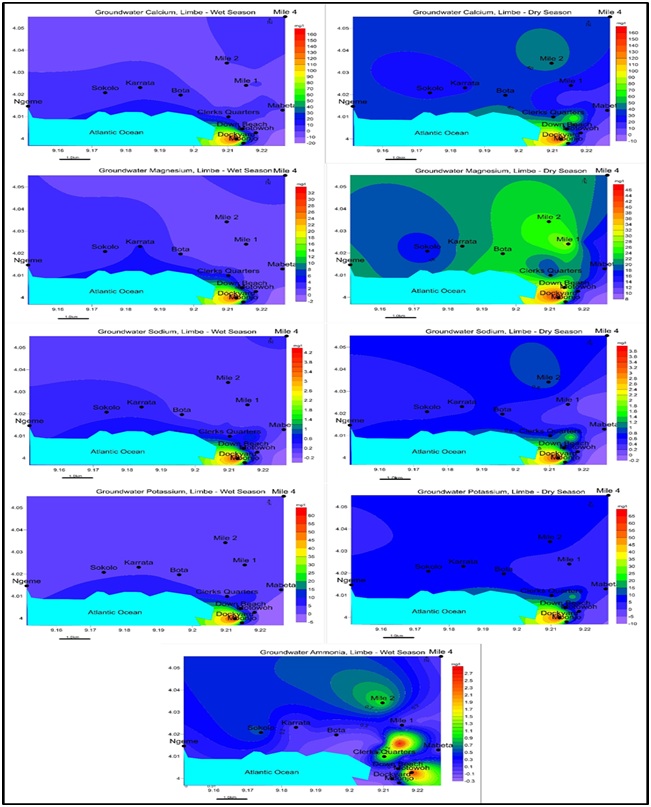 Figure 12: Spatial distribution of Cations a. Ca2+ b. Mg2+ c. Na+ c. K+ d. NH4+ for Wet and dry seasons, Limbe
 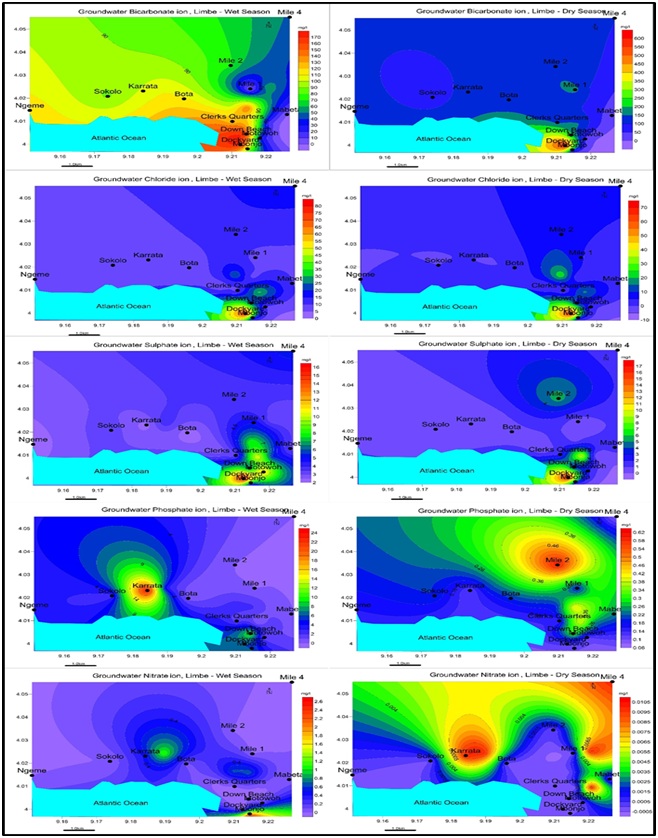 Figure 13: Spatial distribution of Anions a. HCO3- b. Cl- c. SO42- c. HPO42- d. NO3- for Wet and Dry seasons, Limbe.
 |
Wet (mg/L) |
|||||||||||
|
SN |
Names |
Na+ |
K+ |
Ca2+ |
Mg2+ |
NH4+ |
HCO3- |
NO3- |
SO42- |
Cl- |
HPO42- |
|
1 |
Motowoh |
0.04 |
0.88 |
0.00 |
1.83 |
2.61 |
34.16 |
0.14 |
11.41 |
10.00 |
1.36 |
|
2 |
St Ann |
0.04 |
0.88 |
0.00 |
1.53 |
2.88 |
142.74 |
0.66 |
8.09 |
8.00 |
2.29 |
|
3 |
Elegance |
0.25 |
3.86 |
3.10 |
2.71 |
0.27 |
107.97 |
1.13 |
3.98 |
8.00 |
3.56 |
|
4 |
Sokolo |
0.34 |
4.21 |
3.10 |
2.45 |
0.54 |
88.45 |
0.00 |
3.32 |
6.00 |
2.63 |
|
5 |
Mawoh |
0.21 |
2.28 |
0.00 |
1.51 |
0.18 |
18.91 |
0.00 |
5.43 |
22.00 |
1.70 |
|
6 |
ClerksQuarters |
0.39 |
4.39 |
6.20 |
4.51 |
1.35 |
121.39 |
0.00 |
3.13 |
8.00 |
1.52 |
|
7 |
Limbe River |
0.3 |
3.51 |
3.10 |
2.99 |
0.00 |
127.49 |
0.00 |
2.67 |
6.00 |
2.89 |
|
8 |
Ngeme |
0.26 |
3.16 |
3.10 |
3.11 |
0.18 |
116.51 |
0.00 |
2.2 |
6.00 |
3.23 |
|
9 |
Karrata |
0.30 |
3.86 |
6.20 |
4.22 |
0.00 |
101.87 |
0.43 |
2.25 |
7.00 |
23.87 |
|
10 |
Church Street |
0.21 |
1.93 |
0.00 |
1.23 |
0.00 |
99.43 |
0.63 |
4.63 |
25.00 |
2.63 |
|
11 |
Mbonjo |
0.30 |
2.46 |
0.00 |
2.1 |
0.00 |
83.57 |
2.58 |
3.6 |
10.00 |
6.11 |
|
12 |
Mabeta |
0.00 |
0.53 |
0.00 |
1.76 |
0.00 |
0.61 |
0.02 |
3.32 |
10.00 |
0.08 |
|
13 |
Mile 4 |
0.26 |
2.81 |
3.10 |
2.67 |
0.00 |
48.19 |
0.00 |
5.33 |
18.00 |
0.00 |
|
14 |
Westend |
0.86 |
10.00 |
2.79 |
1.46 |
0.00 |
100.65 |
0.00 |
10.66 |
32.00 |
0.00 |
|
15 |
Towe |
0.09 |
1.05 |
0.00 |
1.63 |
0.00 |
57.95 |
0.00 |
3.23 |
9.00 |
0.00 |
|
16 |
Kulu |
0.30 |
3.69 |
3.1 |
2.71 |
0.00 |
165.31 |
0.00 |
6.03 |
23.00 |
9.85 |
|
17 |
Mile 2 |
0.09 |
1.76 |
0.00 |
1.61 |
0.99 |
71.37 |
0.00 |
3.65 |
14.00 |
0.00 |
|
18 |
Dockyard |
4.11 |
60.37 |
161.2 |
31.45 |
0.00 |
173.45 |
0.00 |
16.14 |
77.00 |
5.95 |
|
19 |
Spring |
0.13 |
2.98 |
3.00 |
1.90 |
0.00 |
112.85 |
0.08 |
2.11 |
5.00 |
0.60 |
|
20 |
Rain |
0.00 |
0.70 |
0.00 |
1.65 |
0.00 |
0.00 |
0.00 |
4.91 |
8.00 |
0.00 |
|
Min |
0.00 |
0.53 |
0.00 |
1.23 |
0.00 |
0.00 |
0.00 |
2.11 |
5.00 |
0.00 |
|
|
Max |
4.11 |
60.37 |
161.20 |
31.45 |
2.88 |
173.45 |
2.58 |
16.14 |
77.00 |
23.87 |
|
|
Mean |
0.42 |
5.77 |
9.90 |
3.75 |
0.45 |
88.64 |
0.28 |
5.30 |
15.60 |
3.41 |
|
|
Std |
0.89 |
13.02 |
35.67 |
6.58 |
0.87 |
49.78 |
0.62 |
3.65 |
16.32 |
5.45 |
|
|
Dry (mg/L) |
|||||||||||
|
Names |
Na+ |
K+ |
Ca2+ |
Mg2+ |
NH4+ |
HCO3- |
NO3- |
SO42- |
Cl- |
HPO42- |
|
|
1 |
Motowoh |
0.30 |
1.6 |
14.00 |
13.78 |
0.00 |
41.48 |
0.00 |
2.31 |
2.00 |
0.12 |
|
2 |
St Ann |
0.25 |
1.25 |
14.00 |
22.16 |
0.00 |
103.70 |
0.00 |
0.60 |
0.00 |
0.41 |
|
3 |
Elegance |
0.62 |
6.28 |
32.40 |
20.82 |
0.00 |
124.44 |
0.01 |
0.00 |
0.00 |
0.20 |
|
4 |
Sokolo |
0.55 |
5.85 |
27.80 |
16.26 |
0.00 |
76.86 |
0.00 |
0.00 |
0.00 |
0.20 |
|
5 |
Mawoh |
0.3 |
4.29 |
23.20 |
18.85 |
0.00 |
84.18 |
0.01 |
0.00 |
9.00 |
0.24 |
|
6 |
Clerks Quarters |
0.74 |
7.53 |
37.20 |
18.14 |
0.00 |
136.64 |
0.00 |
1.86 |
0.00 |
0.14 |
|
7 |
Limbe River |
0.58 |
6.28 |
32.40 |
21.76 |
0.00 |
135.42 |
0.00 |
0.15 |
0.00 |
0.16 |
|
8 |
Ngeme |
0.58 |
5.46 |
32.40 |
20.93 |
0.00 |
123.22 |
0.00 |
0.91 |
0.00 |
0.16 |
|
9 |
Karrata |
0.55 |
6.28 |
27.80 |
20.71 |
0.00 |
115.90 |
0.01 |
0.15 |
0.00 |
0.12 |
|
10 |
Church Street |
0.37 |
2.5 |
23.20 |
18.85 |
0.00 |
109.80 |
0.00 |
1.66 |
25.00 |
0.20 |
|
11 |
Mbonjo |
0.32 |
2.33 |
18.60 |
14.5 |
0.00 |
43.92 |
0.00 |
1.11 |
0.00 |
0.10 |
|
12 |
Mabeta |
0.25 |
1.25 |
14.00 |
14.5 |
0.00 |
18.30 |
0.00 |
1.86 |
3.00 |
0.24 |
|
13 |
Mile 4 |
0.64 |
5.85 |
32.40 |
19.48 |
0.00 |
101.26 |
0.01 |
0.91 |
8.00 |
0.08 |
|
14 |
Westend |
1.59 |
18.72 |
74.20 |
21.96 |
0.00 |
153.72 |
0.00 |
10.06 |
17.00 |
0.39 |
|
15 |
Towe |
0.07 |
1.99 |
23.20 |
16.56 |
0.00 |
87.84 |
0.01 |
0.91 |
0.00 |
0.31 |
|
16 |
Kulu |
0.62 |
5.03 |
32.40 |
31.92 |
0.00 |
208.62 |
0.00 |
3.12 |
9.00 |
0.31 |
|
17 |
Mile 2 |
0.94 |
7.89 |
46.40 |
24.96 |
0.00 |
145.18 |
0.00 |
5.68 |
10.00 |
0.61 |
|
18 |
Dockyard |
3.77 |
62.74 |
155.20 |
44.54 |
0.00 |
602.68 |
0.00 |
16.8 |
67.00 |
0.12 |
|
19 |
Spring |
0.58 |
5.58 |
37.20 |
23.3 |
0.00 |
125.66 |
0.00 |
0.60 |
0.00 |
0.20 |
|
20 |
Alpha Club |
0.37 |
1.79 |
23.20 |
29.16 |
0.00 |
163.48 |
0.00 |
0.20 |
6.00 |
0.18 |
|
Min |
0.07 |
1.25 |
14.00 |
13.78 |
0.00 |
18.30 |
0.00 |
0.00 |
0.00 |
0.08 |
|
|
Max |
3.77 |
62.74 |
155.20 |
44.54 |
0.00 |
602.68 |
0.01 |
16.80 |
67.00 |
0.61 |
|
|
Mean |
0.70 |
8.02 |
36.06 |
21.66 |
0.00 |
135.12 |
0.00 |
2.44 |
7.80 |
0.22 |
|
|
Std |
0.79 |
13.44 |
31.11 |
7.09 |
0.00 |
118.70 |
0.00 |
4.14 |
15.49 |
0.13 |
|
MECHANISMS CONTROLLING WATER CHEMISTRY
|
SN |
SO |
Na |
Mg |
Na |
Ca |
Ca |
Ca/Mg |
Ca+Mg |
HCO3/ |
NO3 |
SO4 |
Cl |
Na+K+Cl |
Na |
Mg |
Ca |
Ca+Mg |
Mg/Ca |
|
1 |
1.16 |
0.15 |
6.89 |
0.01 |
0.34 |
6.06 |
1.02 |
14.62 |
0.90 |
0.00 |
0.05 |
0.04 |
-0.01 |
0.13 |
0.50 |
0.86 |
12.03 |
0.98 |
|
2 |
0.00 |
0.00 |
0.00 |
0.00 |
0.14 |
23.33 |
0.63 |
24.11 |
0.99 |
0.00 |
0.01 |
0.00 |
0.10 |
1.00 |
0.61 |
0.96 |
60.27 |
1.58 |
|
3 |
0.00 |
0.00 |
0.00 |
0.00 |
0.26 |
0.00 |
1.56 |
7.71 |
1.00 |
0.00 |
0.00 |
0.00 |
0.18 |
1.00 |
0.39 |
1.00 |
0.00 |
0.64 |
|
4 |
0.00 |
0.00 |
0.00 |
0.01 |
0.36 |
0.00 |
1.71 |
6.88 |
1.00 |
0.00 |
0.00 |
0.00 |
0.19 |
1.00 |
0.37 |
1.00 |
0.00 |
0.58 |
|
5 |
0.00 |
0.03 |
2.09 |
0.00 |
0.28 |
0.00 |
1.23 |
9.16 |
0.90 |
0.00 |
0.00 |
0.10 |
-0.23 |
0.03 |
0.45 |
1.00 |
0.00 |
0.81 |
|
6 |
0.00 |
0.00 |
0.00 |
0.01 |
0.27 |
20.00 |
2.05 |
6.69 |
0.99 |
0.00 |
0.01 |
0.00 |
0.18 |
1.00 |
0.33 |
0.95 |
29.75 |
0.49 |
|
7 |
0.00 |
0.00 |
0.00 |
0.00 |
0.24 |
216.00 |
1.49 |
7.90 |
1.00 |
0.00 |
0.00 |
0.00 |
0.17 |
1.00 |
0.40 |
1.00 |
361.07 |
0.67 |
|
8 |
0.00 |
0.00 |
0.00 |
0.00 |
0.26 |
35.60 |
1.55 |
8.83 |
0.99 |
0.00 |
0.01 |
0.00 |
0.16 |
1.00 |
0.39 |
0.97 |
58.60 |
0.65 |
|
9 |
0.00 |
0.00 |
0.00 |
0.00 |
0.24 |
185.33 |
1.34 |
7.10 |
1.00 |
0.00 |
0.00 |
0.00 |
0.20 |
1.00 |
0.43 |
0.99 |
323.40 |
0.74 |
|
10 |
0.07 |
0.01 |
0.75 |
0.00 |
0.21 |
13.98 |
1.23 |
14.65 |
0.80 |
0.00 |
0.01 |
0.18 |
-20.68 |
0.01 |
0.45 |
0.93 |
25.33 |
0.81 |
|
11 |
0.00 |
0.00 |
0.00 |
0.01 |
0.42 |
16.76 |
1.28 |
12.49 |
0.97 |
0.00 |
0.02 |
0.00 |
0.12 |
1.00 |
0.44 |
0.94 |
29.82 |
0.78 |
|
12 |
0.62 |
0.08 |
4.83 |
0.01 |
0.77 |
7.53 |
0.97 |
19.00 |
0.78 |
0.00 |
0.08 |
0.13 |
-0.12 |
0.08 |
0.51 |
0.88 |
15.32 |
1.04 |
|
13 |
0.11 |
0.08 |
2.44 |
0.01 |
0.32 |
35.60 |
1.66 |
7.99 |
0.92 |
0.00 |
0.01 |
0.07 |
-0.05 |
0.07 |
0.38 |
0.97 |
57.01 |
0.60 |
|
14 |
0.59 |
0.09 |
1.29 |
0.01 |
0.48 |
7.38 |
3.38 |
4.73 |
0.85 |
0.00 |
0.06 |
0.09 |
0.04 |
0.09 |
0.23 |
0.88 |
9.56 |
0.30 |
|
15 |
0.00 |
0.00 |
0.00 |
0.00 |
0.26 |
25.49 |
1.40 |
19.30 |
0.99 |
0.00 |
0.01 |
0.00 |
0.08 |
1.00 |
0.42 |
0.96 |
43.69 |
0.71 |
|
16 |
0.35 |
0.07 |
3.55 |
0.00 |
0.16 |
10.38 |
1.02 |
11.38 |
0.94 |
0.00 |
0.01 |
0.04 |
-0.12 |
0.06 |
0.50 |
0.91 |
20.62 |
0.99 |
|
17 |
0.57 |
0.09 |
2.50 |
0.01 |
0.32 |
8.17 |
1.86 |
8.08 |
0.90 |
0.00 |
0.04 |
0.06 |
-0.03 |
0.09 |
0.35 |
0.89 |
12.56 |
0.54 |
|
18 |
0.25 |
0.06 |
0.66 |
0.01 |
0.26 |
9.24 |
3.48 |
3.00 |
0.88 |
0.00 |
0.02 |
0.10 |
0.00 |
0.05 |
0.22 |
0.90 |
11.89 |
0.29 |
|
19 |
0.00 |
0.00 |
0.00 |
0.00 |
0.30 |
62.00 |
1.60 |
9.82 |
0.99 |
0.00 |
0.00 |
0.00 |
0.14 |
1.00 |
0.39 |
0.98 |
100.83 |
0.63 |
|
20 |
0.03 |
0.06 |
4.86 |
0.00 |
0.14 |
116.00 |
0.80 |
24.24 |
0.96 |
0.00 |
0.00 |
0.04 |
-0.20 |
0.06 |
0.56 |
0.99 |
261.80 |
1.26 |
|
Min |
0.00 |
0.00 |
0.00 |
0.00 |
0.14 |
0.00 |
0.63 |
3.00 |
0.78 |
0.00 |
0.00 |
0.00 |
-20.68 |
0.01 |
0.22 |
0.86 |
0.00 |
0.29 |
|
Max |
1.16 |
0.15 |
6.89 |
0.01 |
0.77 |
216.00 |
3.48 |
24.24 |
1.00 |
0.00 |
0.08 |
0.18 |
0.20 |
1.00 |
0.61 |
1.00 |
361.07 |
1.58 |
|
Mean |
0.19 |
0.04 |
1.49 |
0.01 |
0.30 |
39.94 |
1.56 |
11.39 |
0.94 |
0.00 |
0.02 |
0.04 |
-0.99 |
0.53 |
0.41 |
0.95 |
71.68 |
0.75 |
|
Std |
0.32 |
0.05 |
2.07 |
0.00 |
0.14 |
61.31 |
0.73 |
6.10 |
0.07 |
0.00 |
0.02 |
0.05 |
4.64 |
0.48 |
0.10 |
0.05 |
109.24 |
0.31 |
|
|
SO |
Na |
Mg |
Na |
Ca |
Ca |
Ca |
Ca+Mg |
HCO3 |
NO3 |
SO4 |
Cl |
Na+K+Cl |
Na |
Mg |
Ca |
Ca+Mg |
Mg |
|
1 |
1.16 |
0.15 |
6.89 |
0.01 |
0.34 |
6.06 |
1.02 |
14.62 |
0.90 |
0.00 |
0.05 |
0.04 |
-0.01 |
0.13 |
0.50 |
0.86 |
12.03 |
0.98 |
|
2 |
0.00 |
0.00 |
0.00 |
0.00 |
0.14 |
23.33 |
0.63 |
24.11 |
0.99 |
0.00 |
0.01 |
0.00 |
0.10 |
1.00 |
0.61 |
0.96 |
60.27 |
1.58 |
|
3 |
0.00 |
0.00 |
0.00 |
0.00 |
0.26 |
0.00 |
1.56 |
7.71 |
1.00 |
0.00 |
0.00 |
0.00 |
0.18 |
1.00 |
0.39 |
1.00 |
0.00 |
0.64 |
|
4 |
0.00 |
0.00 |
0.00 |
0.01 |
0.36 |
0.00 |
1.71 |
6.88 |
1.00 |
0.00 |
0.00 |
0.00 |
0.19 |
1.00 |
0.37 |
1.00 |
0.00 |
0.58 |
|
5 |
0.00 |
0.03 |
2.09 |
0.00 |
0.28 |
0.00 |
1.23 |
9.16 |
0.90 |
0.00 |
0.00 |
0.10 |
-0.23 |
0.03 |
0.45 |
1.00 |
0.00 |
0.81 |
|
6 |
0.00 |
0.00 |
0.00 |
0.01 |
0.27 |
20.00 |
2.05 |
6.69 |
0.99 |
0.00 |
0.01 |
0.00 |
0.18 |
1.00 |
0.33 |
0.95 |
29.75 |
0.49 |
|
7 |
0.00 |
0.00 |
0.00 |
0.00 |
0.24 |
216.00 |
1.49 |
7.90 |
1.00 |
0.00 |
0.00 |
0.00 |
0.17 |
1.00 |
0.40 |
1.00 |
361.07 |
0.67 |
|
8 |
0.00 |
0.00 |
0.00 |
0.00 |
0.26 |
35.60 |
1.55 |
8.83 |
0.99 |
0.00 |
0.01 |
0.00 |
0.16 |
1.00 |
0.39 |
0.97 |
58.60 |
0.65 |
|
9 |
0.00 |
0.00 |
0.00 |
0.00 |
0.24 |
185.33 |
1.34 |
7.10 |
1.00 |
0.00 |
0.00 |
0.00 |
0.20 |
1.00 |
0.43 |
0.99 |
323.40 |
0.74 |
|
10 |
0.07 |
0.01 |
0.75 |
0.00 |
0.21 |
13.98 |
1.23 |
14.65 |
0.80 |
0.00 |
0.01 |
0.18 |
-20.68 |
0.01 |
0.45 |
0.93 |
25.33 |
0.81 |
|
11 |
0.00 |
0.00 |
0.00 |
0.01 |
0.42 |
16.76 |
1.28 |
12.49 |
0.97 |
0.00 |
0.02 |
0.00 |
0.12 |
1.00 |
0.44 |
0.94 |
29.82 |
0.78 |
|
12 |
0.62 |
0.08 |
4.83 |
0.01 |
0.77 |
7.53 |
0.97 |
19.00 |
0.78 |
0.00 |
0.08 |
0.13 |
-0.12 |
0.08 |
0.51 |
0.88 |
15.32 |
1.04 |
|
13 |
0.11 |
0.08 |
2.44 |
0.01 |
0.32 |
35.60 |
1.66 |
7.99 |
0.92 |
0.00 |
0.01 |
0.07 |
-0.05 |
0.07 |
0.38 |
0.97 |
57.01 |
0.60 |
|
14 |
0.59 |
0.09 |
1.29 |
0.01 |
0.48 |
7.38 |
3.38 |
4.73 |
0.85 |
0.00 |
0.06 |
0.09 |
0.04 |
0.09 |
0.23 |
0.88 |
9.56 |
0.30 |
|
15 |
0.00 |
0.00 |
0.00 |
0.00 |
0.26 |
25.49 |
1.40 |
19.30 |
0.99 |
0.00 |
0.01 |
0.00 |
0.08 |
1.00 |
0.42 |
0.96 |
43.69 |
0.71 |
|
16 |
0.35 |
0.07 |
3.55 |
0.00 |
0.16 |
10.38 |
1.02 |
11.38 |
0.94 |
0.00 |
0.01 |
0.04 |
-0.12 |
0.06 |
0.50 |
0.91 |
20.62 |
0.99 |
|
17 |
0.57 |
0.09 |
2.50 |
0.01 |
0.32 |
8.17 |
1.86 |
8.08 |
0.90 |
0.00 |
0.04 |
0.06 |
-0.03 |
0.09 |
0.35 |
0.89 |
12.56 |
0.54 |
|
18 |
0.25 |
0.06 |
0.66 |
0.01 |
0.26 |
9.24 |
3.48 |
3.00 |
0.88 |
0.00 |
0.02 |
0.10 |
0.00 |
0.05 |
0.22 |
0.90 |
11.89 |
0.29 |
|
19 |
0.00 |
0.00 |
0.00 |
0.00 |
0.30 |
62.00 |
1.60 |
9.82 |
0.99 |
0.00 |
0.00 |
0.00 |
0.14 |
1.00 |
0.39 |
0.98 |
100.83 |
0.63 |
|
20 |
0.03 |
0.06 |
4.86 |
0.00 |
0.14 |
116.00 |
0.80 |
24.24 |
0.96 |
0.00 |
0.00 |
0.04 |
-0.20 |
0.06 |
0.56 |
0.99 |
261.80 |
1.26 |
|
Min |
0.00 |
0.00 |
0.00 |
0.00 |
0.14 |
0.00 |
0.63 |
3.00 |
0.78 |
0.00 |
0.00 |
0.00 |
-20.68 |
0.01 |
0.22 |
0.86 |
0.00 |
0.29 |
|
Max |
1.16 |
0.15 |
6.89 |
0.01 |
0.77 |
216.00 |
3.48 |
24.24 |
1.00 |
0.00 |
0.08 |
0.18 |
0.20 |
1.00 |
0.61 |
1.00 |
361.07 |
1.58 |
|
Mean |
0.19 |
0.04 |
1.49 |
0.01 |
0.30 |
39.94 |
1.56 |
11.39 |
0.94 |
0.00 |
0.02 |
0.04 |
-0.99 |
0.53 |
0.41 |
0.95 |
71.68 |
0.75 |
|
Std |
0.32 |
0.05 |
2.07 |
0.00 |
0.14 |
61.31 |
0.73 |
6.10 |
0.07 |
0.00 |
0.02 |
0.05 |
4.64 |
0.48 |
0.10 |
0.05 |
109.24 |
0.31 |
|
Ionic Ratio |
Wet |
Dry |
Comments |
Interpretation |
|
SO4/CL |
0.19 - 1.14 |
0 - 1.16 |
Very High |
Suggests additional sources of Sulphate. |
|
Na/Cl |
0 - 0.06 |
0 - 0.15 |
Low |
Silicate weathering, some marine water. |
|
Mg/Cl |
0.05 - 0.6 |
0 - 6.89 |
Very High |
Depict a silicate weathering environment |
|
Na/HCO |
0 - 0.02 |
0 - 0.01 |
Very Low |
Low weathering of Na-silicates. |
|
Ca/HCO |
0 - 0.93 |
0.14 - 0.77 |
Low |
Ca-silicate weathering from the basalts of Limbe. |
|
Ca/SO4 |
0 - 9.99 |
0 - 216 |
Very High |
There is no gypsum dissolution in volcanic coastal regions |
|
Ca/Mg |
0 - 5.13 |
0.63 - 3.48 |
High |
Typical of coastal regions due to cation-exchange |
|
Mg/Ca |
0 - 1 |
0.29 - 1.58 |
Very Low |
Silicate rock weathering |
|
(Ca+Mg)/(Na+K) |
0.39 - 3.32 |
3 - 24.24 |
Very High |
Occurrence of silicate weathering. |
|
HCO3-/∑Anions |
0 - 0.94 |
0.78 - 1 |
Low-High |
Silicate weathering reactions and some seawater |
|
NO3/∑Anions |
0 - 0.02 |
0 -(2.38E-05) |
Low |
No anthropogenicactivities. |
|
SO4/∑Anions |
0.02 - 0.38 |
0 - 0.08 |
Low |
No oxidation of sulphides. |
|
Cl-/∑Anions |
0.04 -0.71 |
0 - 0.18 |
Low |
Rock weathering |
|
|
-4.96-4.92 |
-20.68-0.20 |
Low-High |
Plagioclase weathering unlikely |
|
|
0 - 0.05 |
0.01 - 1.0 |
Low-High |
Some halite Solution; Reverse softening and seawater; Sodium source other than halite-albite, ion exchange |
|
|
0.16 - 1.0 |
0.22 - 0.61 |
Low-High |
Silicate weathering. Ferromagnesian minerals but no evidence of granitic weathering |
|
|
0 - 0.91 |
0.86 - 1.0 |
Low-High |
Ion exchange/Calcium removal and Calcium source from silicates |
|
|
0.16-11.94 |
0 - 361.07 |
Low-High |
No dolomite at all, Dedolomitization |
12 of the 18, 66.7% ionic ratios calculated gave indices indicating silicate weathering of geologic formations in Limbe as a source of solute concentration in the groundwater while nitrate ratio indicates no anthropogenic contribution and sulfate indices indicates no oxidation of sulfides. Sulphate and Sodium indices indicate alternative sources of ions such as silicate weathering and ion exchange. Ca and Mg are sourced from silicate weathering. Sodium, Chloride and Bicarbonate indices indicate seawater intrusion; this is prominent in Dockyard and to some extent in Church Street, Mabeta, Mawoh, Motowoh, West End and Mbonjo. There is no plagioclase weathering, gypsum dissolution nor dolomitization.
Rock-Groundwater Interaction in Limbe: From Gibbs diagram for cations; 20 samples 100% are of rock-weathering dominance and for anions; 18 samples 90% are of rock weathering dominance and 2 samples 10% are of the atmospheric precipitation dominance during the wet season. During the dry season for cations and anions, all 20 samples 100% are controlled by rock weathering as in figure 14 and table 10. This reveals the weathering of the aquifer matrix as the primary dominant process in the acquisition of ions and atmospheric precipitation as the secondary process controlling the hydrogeochemistry in Limbe.
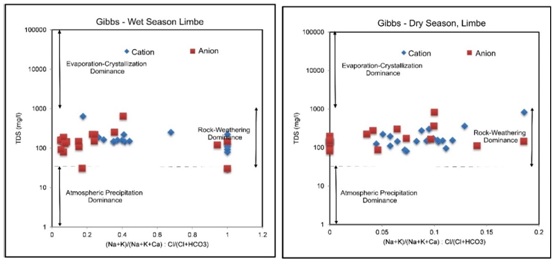 Figure 14: Gibbs Diagram indicating the interaction between aquifer formation and groundwater samples from Limbe. Almost all samples plot in the rock -weathering field for all the seasons.
|
Type of Rock-water Interaction |
TDS mg/L |
Wet |
Dry |
||||||
|
Cation |
% |
Anion |
% |
Cation |
% |
Anion |
% |
||
|
Rock - Weathering dominance |
50-1000 |
20 |
100 |
18 |
90 |
20 |
100 |
20 |
100 |
|
Atmospheric Precipitation dominance |
1-50 |
- |
- |
2 |
10 |
- |
|
- |
|
Groundwater types: The diamond field of Piper’s diagram was divided into seven classes A-G classifying water types and designated with alphabets from A to G are shown in figure 15. Using this Classification, water from Limbe is distinguished falls into A, B, C, D, E, G categories presented in table 11. There is no category F in the wet season and no B, C, D, E, F, and G in the dry. In the wet season: Category A; 5 samples, 25 %; characterized by normal earth alkaline water with prevailing bicarbonate. Category B; 3 samples, 15% are characterized by normal earth alkaline water with prevailing sulfate or chloride and Category C; 2 samples, 10 % are characterized by Normal earth alkaline water; prevailing chloride. Category D; 8 samples 40%; are characterized by earth alkaline water, with increased portions of alkalis and prevailing bicarbonate. Category E; 1 sample 5%; characterized by earth alkaline water, with increased portions of alkalis with prevailing chloride and Category G; 1 sample, characterized by alkaline water with prevailing bicarbonate. There are no categories B to G in the dry season and no Category F in the wet season. In the dry season: Category A; 20 samples, 100%. In the wet season, the dominant water types are Category A, 25%; and Category D, 40% while in the dry season Category A; 100%. From table 11, MgHCO3 is the dominant water type, followed by CaCl, MgCl, Na+ Cl in the wet season and MgHCO3 is the dominant water type, followed by CaHCO3, in the dry season.
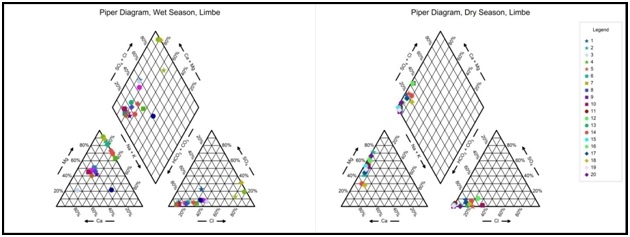 Figure 15: Piper’s diagram for 3 water types and 3 groundwater hydrogeochemical facies in Limbe; in the wet season; Field (I): Ca-Mg-Cl-SO4 has 3 samples 15%, Field III: Na- K-HCO3 1 sample 5% and Field IV: Ca-Mg-HCO3 has 16 samples, 80%. In the dry season; Field (IV) Ca-Mg-HCO3 20 samples 100%. No samples plotted on Fields II in the wet or I and III in the dry season. Water types include; MgHCO3 90%; CaCl 5% and NaCl 5% in Wet seasons and MgHCO3 70%, CaHCO3 (30%) dry season.
|
Piper-Langguth Classification Limbe |
Wet |
Dry |
|||
|
Class |
Characteristic-Water type |
No |
% |
No |
% |
|
Diamond Field |
|||||
|
A |
Normal earth alkaline water ; prevailing HCO3- |
5 |
25 |
20 |
100 |
|
B |
Normal earth alkaline water ; prevailing HCO3-or Cl- |
3 |
15 |
- |
- |
|
C |
Normal earth alkaline water; prevailing Cl- |
2 |
10 |
- |
- |
|
D |
Earth alkaline water ; increased portions of alkalis; prevailing HCO3- |
8 |
40 |
- |
- |
|
E |
Earth alkaline water with added portions of alkalis with prevailing chloride |
1 |
5 |
- |
- |
|
G |
Alkaline water with prevailing bicarbonate |
1 |
5 |
- |
- |
|
Cation Field |
|||||
|
1 |
Ca-rich waters |
1 |
5 |
6 |
30 |
|
2 |
Mg-rich waters |
18 |
90 |
14 |
70 |
|
3 |
Na+K |
1 |
5 |
- |
- |
|
Anion Field |
|||||
|
4 |
HCO3- waters |
17 |
85 |
20 |
100 |
|
6 |
Cl- waters |
3 |
15 |
- |
- |
Piper’s hydrogeochemical facies: From the Piper’s diagram in figure14 the hydrogeochemical facies were determined and presented in table 12, Field (I): Ca-Mg-Cl-SO4 hydrogeochemical facies has 3 samples, 15% in the wet and 0 samples and 0 % in the dry season. This facies is characteristic of stagnant at some distance along its flow path possibly from the slopes of Mount Cameroon. Field (III): Na-K-HCO3hydrogeochemical facies has 1 sample, 5% in the wet and 0 samples, 0 % in the dry season. This facies is characteristic of stagnant groundwater zones commonly zones of mixing in seawater encroached coastal regions. Field (IV), Ca-Mg-HCO3 hydrogeochemical facies has 16 samples, 80% in the wet and 20 samples, 100% in the dry season. This facies is characteristic of freshly recharged groundwater that has equilibrated with CO2 and soluble carbonate minerals under an open system conditions in the vadose zone typical of shallow groundwater flow systems in crystalline phreatic aquifers. No samples plotted on Field II in the wet season and Field II and III in the dry season. The high contribution of alkaline earth elements 80% in the wet season and 100 % in the dry season is due to direct ion-exchange processes which enrich groundwater with alkaline earth elements. The dominance of Ca-Mg-HCO3hydrogeochemical facies in this area could be due to dissolution of gases and minerals, particularly CO2and CO2-related compounds from the atmosphere dissolved in precipitation and during groundwater infiltration through the vadose zone.
|
Fields |
Hydrogeochemical facies |
Wet |
Dry |
||
|
No |
% |
No |
% |
||
|
Field I |
Ca2+ - Mg2+ - Cl- -SO42- |
3 |
15 |
- |
- |
|
Field III |
Na+ - K+ - HCO3- |
1 |
5 |
- |
- |
|
Field IV |
Ca2+ - Mg2+ - HCO3- |
16 |
80 |
20 |
100 |
Hydrogeochemical character of Limbe groundwater: Based on the Durov’s diagram, the classification by Lloyd and Heathcoat [18] presented in figure 16 for Limbe groundwater shows four classes occur in the wet season; Class-2; Ion exchange; 1 samples, 5%; Class-4Recharge, 3 samples 15%; Class-5Simple dissolution or mixing, 4 samples 20% and Class-6 Mixing and uncommon dissolution influences, 12 samples 60%. Three Classes occur in the dry season: Class-3 ion exchanged water, 10 samples, 50%; Class-5 Simple dissolution or mixing, 1 sample, 5% and Class-6 Mixing and uncommon dissolution influences, 9 samples 45% respectively. There are no Classes 1,3,7,8 and 9 in the wet season and no Classes 1, 2, 4, 7, 8 and 9 in the dry season in Limbe. In the wet season, fresh recently recharging water exchanges ions with the matrix of the formation, while simple dissolution or mixing also goes on between the recently recharging precipitation and the existing groundwater in the formation. In the dry season, recharging groundwater having spent more time in the formation continues to exchange ions to a lesser extent with the matrix of the formation while increasingly; simple dissolution or mixing also goes on between the recently recharging groundwater and the pre-existing groundwater in the formation, piston flow. The presence of samples showing Na+ and Cl- as dominant cation /anion, Classes 2, 4, 5, 6 in the wet season and Classes 3, 5, 6 in the dry season, indicates that the groundwater in Limbe is related to ion exchange, simple dissolution and reverse or inverse ion exchange of NaCl waters or end-point down gradient waters such as seawater; indicative of seawater intrusion.
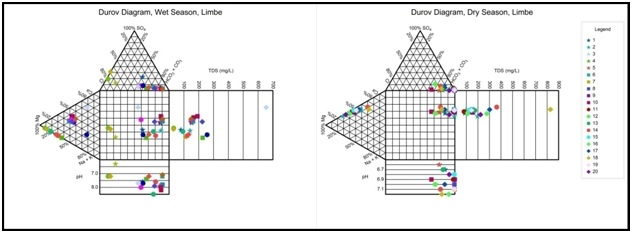 Figure 16: Durov plot of Limbe groundwater for the processes in groundwater evolution: for wet season; Field2, Ion exchange; 1 samples, 5%; Recharge, 3 samples 15%; Simple dissolution or mixing, 4 samples 20% and Mixing and uncommon dissolution influences, 12 samples 60% while in the dry season; ion exchange,1 sample, 50%; Simple dissolution or mixing, 1 samples, 5% and Mixing and uncommon dissolution influences, 9 samples 45%.
Rock-Groundwater interaction: Based on the Durov’s diagram, the classification by Lloyd and Heathcoat [18] presented in table 13 shows that, in the wet season, most water samples plotted in Class 4, 5, 6, 95% and Class 5, 6, 50% in the dry season, which are water types not frequently encountered in basaltic terrains, but common in coastal regions; indicates probable mixing or uncommon dissolution infl
DISCUSSION
Basalts have a primary composition of Feldspars, Ferromagnesian Minerals (Pyroxenes and Amphiboles) and Magnetite (Fe3O4) that weather to form residual Kaolinite minerals, Hematite and Goethite with Na+, Ca2+, Mg2+ being leached [16]. The Processes in basaltic weathering, Equations 1-7 are: Hydrolysis, carbonization and solution:
NaALSi3O8 + H2CO3+ 4.5H2O = Al2Si2O5 (OH)4 + Na+ + HCO3- + 2H4SiO4 …………………….……………….(1)
Albite + Hydrogen ions + water = Kaolinite (clay) + Sodium ions + silicic acid
Or 2NaAL3O8 + 4H+ + 4H2O = Al3+ + Na+ + 2H4SiO4 ………………………………………………………………(2)
Albite + Hydrogen ions + water = Aluminum ions + Sodium ions + silicic acid
2KALSi3O8 + 2(H+ + HCO3-) +H2O = Al2Si2O5 (OH)4 + 2K+ + 2HCO3- + 4SiO2 ……………………………………. (3)
Orthoclase + Carbonic acid + water = Kaolinite (clay) + Potassium ions + Bicarbonate + silica
Or 2KALSi3O8 + 2H+ + H2O = Al2Si2O5 (OH)4 + 2K+ + 4SiO2 ………………………………………………. (4)
Orthoclase + Hydrogen ions + water = Kaolinite (clay) + Potassium ions + silica
Orthoclase: 2KALSi3O8 + 11 H2O = Al2Si2O5 (OH)4 + Si(OH)4 + 2K+ + 2OH−……………………………….. (5)
Amphibole: Ca2Mg5Si8O22 (OH)2 + 14CO2 + 22H2O = 2Ca2+ + 5Mg2+ + 14HCO3- + 8Si(OH)4…….,...………. (6)
Pyroxene: CaMg (Si2O6) + 4CO2 + 6H2O = Ca2+ + Mg2+ + 4HCO3- + 2Si(OH)4………………………………...….… (7)
The leached cations may then enrich the percolating groundwater, giving it its ionic character.
The ionic sequence of the occurrence of major cations and anions in Limbe groundwater is safe for both the wet and dry seasons but for NH4+ which is absent in the dry season. The presence of NH4+ in the rainy season is due to excess rainfall or runoff transporting sewage and other organic materials that produce ammonium. There is an interchange between HPO42- and SO42- ions in the wet and dry seasons.
From ionic ratios: SO4/Cl, Na/Cl, Mg/Cl, Na/HCO3, Ca/HCO3, Ca/SO4, Mg/Ca, Ca/Mg, (Ca+Mg)/(Na+K), HCO3/∑Anions, NO3/∑Anions, SO4/∑Anions, Cl/∑Anions, Na/Na+K; groundwater in Limbe is affected to a great extent by silicate weathering; mostly Ca-silicates and Mg-silicates from the minerals found in basalts with little weathering of Na-silicates, no Na-absorption, some sulfate from external sources, no oxidation of sulphides and no significant anthropogenic contribution of sulfate.
Gibb’s diagrams reveals the weathering of the aquifer matrix, is the primary dominant process in the acquisition of ions while atmospheric precipitation is the secondary process controlling the hydrogeochemistry in Limbe. The sources of groundwater ions are; weathering of basaltic rocks (Silicate weathering) that are found in the area and atmospheric precipitation similar to other studies in the basaltic aquiferous formations along the Cameroon Volcanic Line.
The Piper’s diagrams indicate the groundwater has a modern age and is being recharged by precipitation. The dominance of Ca-Mg-HCO3 hydrogeochemical facies in this area could be due to dissolution of gases and minerals, particularly CO2 and CO2- related compounds from the atmosphere dissolved in precipitation and during groundwater infiltration through the vadose zone. Processes controlling groundwater solute chemistry are; ion exchange, simple dissolution and Reverse ion exchange. Reverse exchange is not frequently encountered in basaltic terrains, but common in coastal regions. The groundwater in Limbe is recharged uphill on Mount Cameroon, flows through the lava-flow formations on the Mountain slopes and into the low lying shorelines which are in some places below the sea level. During the wet season, sea levels are higher at high tide and the land is submerged by the sea. This results in seawater intruding into the phreatic basaltic fractured rock aquiferous formations in the low lying areas. However, the fresh water volumes from the mountain are so great that during the dry season, the fresh groundwater flushes the seawater back into the ocean and regains its typical basaltic fractured rock aquifer character.
From analysis and interpretation, WQI indicates that 75% of the water is portable for both seasons and 25% are unsuitable. Almost all groundwater in Limbe is soft during the wet season but moderately to very hard in the dry season in the low lying areas; this is due to an increase in the bicarbonate ions which are higher in dry season due to tidal waves coming inland with very low levels of bicarbonate. With respect to irrigation water quality: %Na, KR, RSC, MAR, SAR and PI indicate suitability of groundwater for agricultural use during the dry season. Groundwater is more unsuitable during the wet season as shown by RSC, MAR, Salinity hazard Class (USSL classification) and PI.
CONCLUSION
There is seawater intrusion in the Limbe coastal area: Low surface elevations, shallow depth-to-water levels, the geology of the formations being made up of mostly porous fractured weathered and un weathered basalts and their proximity to the Atlantic shoreline increases their susceptibility to seawater intrusion.
Water Quality Indices (WQI) show groundwater is within WHO guidelines for potable water at higher elevations for all seasons but unsuitable for agricultural purposes at lower elevations during the wet season`.
REFERENCES
- LCC (2013) Ville de limbe - cameroun protection des zones urbanisees contre les risques d’inondation et de glissement de terrain sur le bassin versant de la rivierewomangue expertise prealable. Hydraulic sans Frontieres. Limbe City Council, Limbe, Cameroon.
- Che VB, Kervyn M, Suh CE, Ernst GGJ, Trefois P, et al., (2012) Landslide susceptibility assessment in Limbe (SW Cameroon): A field calibrated seed cell and information value method. Catena 92: 83-98.
- Peel MC, Finlayson BL, McMahon TA (2007) Updated world map of the Koppen-Geiger climate classification. Hydrol Earth Syst Sci 11: 1633-1644.
- Fombe LF, Molombo JM (2015) Hydro-geomorphological implications of uncontrolled settlements in Limbe, Cameroon. International Review of Social Sciences 3.
- Hasselo HN (1961) The soils of the lower eastern slopes of the Cameroon mountain and their suitability for various perennial crops. Soil Science 93.
- Mathieu L, Kervyn M, Ernst GGJ (2011) Field evidence for flank instability, basal spreading and volcano-tectonic interactions at Mt Cameroon, West Africa. Bull Volcanol 73: 851-867.
- Endeley RE, Ayonghe SN, Tchuenteu F (2001) A preliminary hydrogeochemical baseline study of water sources around Mount Cameroon. Journal of the Cameroon Academy of Sciences 1: 161-168.
- Orock FT (2006) Analysis of the Degradation of Springs and Streams from Perched Aquifers on the Eastern and Southern Slopes of Mount Cameroon. Unpublished MSc Thesis. University of Buea, Buea, Cameroon.
- Ako AA, Shimada J, Hosono T, Kagabu M, Akoachere RA, et al., (2012) Spring water quality and usability in the Mount Cameroon Area revealed by hydrogeochemistry. Environmental Geochemistry and Health 34: 615-639.
- Ako AA, Eyong GET, Shimada J, Koike K, Hosono T, et al., (2014) Nitrate contamination of groundwater in two areas of the Cameroon volcanic line (banana plain and mount Cameroon area). Journal of Applied Water Science 4: 99-113.
- ISO (2006) Standard ISO 5667 1: Water quality-sampling-Part 1: Guidance on the design of sampling programs and sampling techniques. International Organization for Standardization, Geneva, Switzerland.
- ISO (2009) Standard ISO 5667-11: Water quality-sampling-Part 11: Guidance on sampling of groundwaters. International Organization for Standardization, Geneva, Switzerland.
- ISO (2003) Standard ISO 5667 3: Water quality-sampling-Part 3: Guidance on the preservation and handling of water samples. Geneva, International Organization for Standardization, Geneva, Switzerland.
- Barcelona MJ, Gibbs JP, Hellfrich JA, Garske EE (1986) Practical guide for groundwater sampling. US Environmental Protection Agency, Washington, D.C., USA.
- APHA (1995) Standard Methods for Examination of Water and Waste Water, (22nd edn), American Public Health Association , Washington, D.C., USA.
- Hounslow AW (1995) Water quality data: Analysis and interpretation, Lewis Publishers CRC press New York, USA.
- Langguth HR (1966) Groundwater verhaltisse in Bereiech Des Velberter: Sattles Der minister fur eraehrung, Land Wirtsch Forste, Duesseldorf, Germany.
- Lloyd JA, Heathcote JA (1985) Natural inorganic hydrochemistry in relation to groundwater: An introduction. Oxford Uni Press, New York, USA.
- Wilcox LV (1955) Classification and use of irrigation waters. United States department of agriculture circular, Washington, D. C., USA.
- Kelley WP (1940) Permissible composition and concentration of irrigation waters. Proceedings of the American society of civil engineers 66: 607-613.
- Szaboles I, Darab C (1964) The influence of irrigation water of high sodium carbonate content of soils in: Proceedings of 8th international congress on international society of soil science, Research institute for soil sciences and agricultural chemistry of the Hungarian academy of sciences, Hungary, Budapest.
- Todd DK (1980) Groundwater hydrology, (3rd edn), Wiley, New York, USA.
- Eaton FM (1950) Significance of carbonate in irrigation water. Soil science 69: 123-133.
- Raghunath HM (1987) Groundwater. Wiley Eastern Ltd., New Delhi, India, 344-369.
- Richards LA (1954) Diagnosis and improvement of saline and alkali soils, United States Department of Agriculture, Agricultural Handbook, Washington, D. C, USA.
- Doneen LD (1962) The influence of crop and soil on percolating water: Proceedings of biennial conference on groundwater recharge 1961, California, USA.
- Sisodia R, Moundiotiya C (2006) Assessment of the water quality index of wetland Kalakho Lake, Rajasthan, India. J Environ Hydro 14: 1-11.
- WHO (2017) Guidelines for drinking-water quality: 4th edition incorporating the first addendum. World Health Organization, Geneva, Switzerland.
- Pradhan SK, Patnaik D, Rout SP (1998) Ground water quality -an assessment around a phosphatic fertilizer plant at paradip, Indian Journal Environment Protection 18: 769-772.
- Asadi JJ, Vuppala P, Reddy MA (2007) Remote sensing and GIS techniques for evaluation of groundwater quality in municipal corporation of Hyderabad (Zone-V), India. International Journal of Environmental Research and Public Health 4: 45-52.
- Sawyer CN, McCarty PL (1967) Chemistry for sanitary Engineers, (2nd edn), McGraw Hill, New York, USA.
- Kelley WP (1953) Use of Saline Irrigation Water. Soil Science 95: 355-391.
- Rose TP, Davisson ML, Criss RE (1996) Isotope hydrology of voluminous cold springs in fractured rock from an active volcanic region, northeastern California. J Hydrol 179: 207-236.
- Qannam Z (2003) A hydrogeological, hydrochemical and environmental study in Wadi Al Arroub drainage basin, south west Bank, Palestine. Freiberg On-line Geosciences 9.
Citation: Akoachere RA, Egbe SE, Eyong TA, Yaya OO, Mbua RL, et al. (2019) Characterization of Groundwater in the Basaltic Fractured Rock Aquiferous Formations of the Limbe Coastal Region of Mount Cameroon, SWR-Cameroon. J Environ Sci Curr Res: S1002.
Copyright: © 2019 Akoachere RA, et al. This is an open-access article distributed under the terms of the Creative Commons Attribution License, which permits unrestricted use, distribution, and reproduction in any medium, provided the original author and source are credited.