Clinical and Epidemiological Differences Among Meningococcal C Conjugate Vaccine Failures and Non-Vaccinated Cases
*Corresponding Author(s):
Garrido-Estepa MNational Centre For Epidemiology, Health Technology Assessment Agency, Carlos III Health Institute, Madrid, Spain
Tel:+34 918222974, +34 91387781615
Email:mgarrido@isciii.es; macarena.gaes@gmail.com
Abstract
Introduction
Although meningococcal C conjugate vaccines achieve high vaccine effectiveness, vaccine failures still occurs associated to a decline of bactericidal titres in time. Previous studies have found similar mortality between cases with meningococcal disease with prior vaccination compared to those non-vaccinated. However, nothing is known about if prior vaccination could protect against other outcomes or if the prognosis of the disease depends only on the severity of the clinical presentations.
Methods
We included 362 serogroup C laboratory confirmed cases (129 confirmed vaccine failures and 233 non-vaccinated cases) from the previous nationwide vaccine effectiveness study developed in Spain with data on 13 surveillance years after the conjugate vaccine introduction. Clinical diagnoses and procedures performed during the hospitalisation were obtained from the National Registry of Hospitalisations to compare epidemiological and clinical characteristics between cases presenting vaccine failure and non-vaccinated cases. Relationship among diagnoses and death event was also evaluated.
Results
Clinical information was found in 333 (92%) cases: 53.8% were men; 15.3% presented risk factors for the disease; 17.4% died (75.9% of them in ≤ 5 days); 28.8% developed meningitis, 51.7% septicemia and 16.8% both. Average age was lower in vaccine failure (mean: 6.2 years) vs. non-vaccinated cases (mean: 11.7 years). Average time to death was 3.4 vs. 5.6 days for vaccine failures vs. non-vaccinated cases and 5.3 vs. 2.8 days for meningitis vs. septicemia. Vaccine failures presented more septicemia (63.2% vs. 45.4%) but died less by it (12.2% vs. 23.5%) compared to non-vaccinated cases. Septicemia presented higher risk of heart disturbances, blood disorders, renal failure and shock/coma compared to meningitis (p < 0.05). Risk factors for the disease (aOR: 5.36; p = 0.046), as well as charlson comorbidity index (aOR: 8.24; p = 0.015) were independently associated to death event in the vaccine failure cases, in which respiratory failure was the main risk factor for death (aOR: 46.67; p < 0.001).
Conclusion
Vaccine failures were younger, presented less meningitis (with slower progression) and more septicemia but lower fatality-rates, and died less after 7 days than non-vaccinated cases. Severity of the disease seems to be related to clinical presentation. In vaccine failure cases risk factors for death were respiratory failure, risk factors for infection and charlson comorbidity index showing that this group might be more affected by respiratory concomitant diseases.
Keywords
INTRODUCTION
Meningococcal C conjugate vaccine effectiveness has been widely evaluated in different epidemiological studies [1-6]. In those studies vaccine effectiveness obtained was high and increased with the age of vaccination. Loss of vaccine effectiveness and the apparition of vaccine failures have been associated to an inadequate maintenance of circulating antibodies [7-9]. The effect of immaturity of the immune system in infants [10,11] to maintain the antibody levels in time has been widely studied in seroprevalence studies [9,12-17]. In line with this, in our previous nationwide study evaluating vaccine effectiveness after 13 years since the conjugate vaccine introduction, we found 63.97% of vaccine failures in those vaccinated before the year of age (2-3 doses), 32.08% in those vaccinated between 1 and 11 years (1 dose) and 3.88% in those vaccinated between 12-19 years (1 dose) [18].
Additionally, we should take into consideration that the meningococcus is a commensal of the human nasopharynx. The role of individual susceptibility and the presence of risk factors for the disease have been also widely studied. The presence of some immunodeficiencies [7,11,19-21], special determinants in the host [22], tobacco consumption [23,24] and coinfections with another respiratory diseases [25-28], among others factors, have been associated to the meningococcal disease.
Independently of those factors and although meningococcal conjugate vaccine primes for memory, the absence of circulating antibodies leave the individuals unprotected till a sufficient secondary immune response is achieved. Time to elicit an antibody response takes in reach its peak around 4 weeks in a primary response and around 6-7 days in a secondary response [29]. However, meningococcal disease presents a rapid progression, in most cases the disease progress before 7 days, and Auckland et al., found similar mortality by the disease in those vaccinated compared to those not vaccinated [30]. Similarly, in our previous study, using the data included in this one, we found that case-fatality rate was similar in vaccine failures and in non-vaccinated cases when adjusted by age [18].
The aim of this study was to describe and compare the epidemiological and clinical characteristics in cases presenting vaccine failure and in non-vaccinated cases. We evaluated if being previously vaccinated can be a protective factor for the different outcomes (for example: reduction in time of stay, less severe clinical patterns, etc.). Or if the patients that fail in maintaining the protection over time presented no differences with those not vaccinated, and differences are mainly due to clinical presentations severity. As secondary objective we assessed which diagnoses are related to death event in case of serogroup C meningococcal disease (for all, for vaccine failures and non-vaccinated cases, and by the main clinical presentations).
METHODS
National surveillance system vaccine failures cases and non-vaccinated cases selection criteria
Recently, we have published the results of a nationwide vaccine effectiveness study including all cases targeted for vaccination in Spain since the introduction of meningococcal C conjugate vaccine from January 1st of 2001 till the end of 2013 [4,18]. Methodology for the selection of cases targeted for vaccination from those notified to the National Surveillance System has been described in our previous studies [4,18]. The same cases included in the vaccine effectiveness studies were included in this study. In total, 362 cases targeted for vaccination between 0-19 years: 129 confirmed vaccine failures (laboratory confirmed MenC case with onset more than 14 days after the last dose of vaccine scheduled for each age-group) and 233 targeted for vaccination, but non-vaccinated cases (to be comparable to confirmed vaccine failures in the opportunity of being vaccinated).
National registry of hospitalisation database
From 2000 to 2013 a total 10,194 hospitalisations were recorded in the National Registry of Hospitalisations (579 readmissions/hospital transfers), in which cases of serogroup C notified to the National Surveillance System and included in this study were search.
Matching
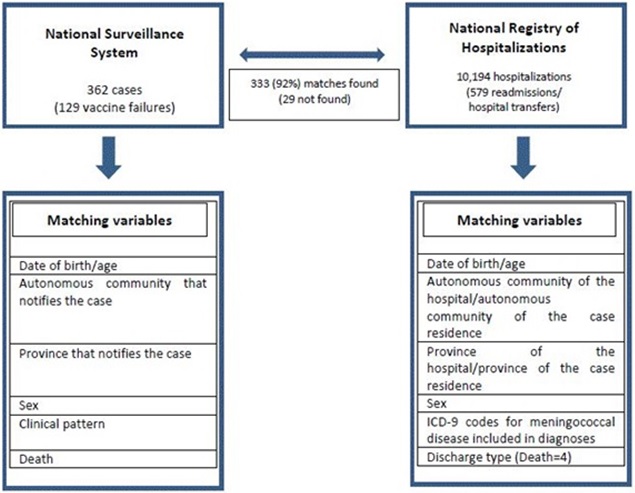 Figure 1: Variables used to match the cases of serogroup C meningococcal disease reported to the National Surveillance System to the hospitalizations registered in the National Registry of Hospitalizations.
As additional exclusion criteria cases of the National Surveillance System included that were not found or with no match in some of the variables in the National Hospitalisation Registry were excluded from the analysis.
Statistical analysis
Differences were considered statistically significant if p-value was < 0.05. All analyses have been performed using Stata v. 13.
RESULTS
From the 362 cases notified to the National Surveillance System 333 (92%) were found in the National Registry of Hospitalisation. Cases were no match was found were distributed uniformly among vaccine failure (N = 12; 9.3%) and non-vaccinated cases (N = 17; 7.3%). For those vaccinated, average age of vaccination was 1.3 years (Standard Deviation-SD: 3.05; range: 0-17 years) and average time since vaccination was 3.9 years (SD: 2.66; range: 0-12 years).
In table 1, we describe general characteristics of the cases included in the study. From 333 cases included, 179 (53.8%) were men and 154 (46.2%) women. Average age was 9.7 years (SD: 7.90) for all cases. Average age was lower in vaccine failures (mean: 6.2 years; SD: 4.21) than in non-vaccinated cases (mean: 11.7 years; SD: 8.73; p < 0.001).
| All (N = 333) | Vaccine failure cases (N = 117) | Non-vaccinated cases (N = 216) | p-value | |||||
| Categorical variables | N | % | N | % | N | % | ||
| Sex | ||||||||
| Men | 179 | 53.8 | 63 | 53.8 | 116 | 53.7 | 0.98 | |
| Women | 154 | 46.2 | 54 | 46.2 | 100 | 46.3 | ||
| Deaths | 58 | 17.4 | 16 | 13.7 | 42 | 19.4 | 0.185 | |
| Clinical presentation | ||||||||
| Meningitis | 96 | 28.8 | 25 | 21.4 | 71 | 32.9 | 0.027 | |
| Septicemia | 172 | 51.7 | 74 | 63.2 | 98 | 45.4 | 0.002 | |
| Both (Meningitis+Septicemia) | 54 | 16.8 | 16 | 13.7 | 38 | 17.6 | 0.355 | |
| Encephalitis | 2 | 0.6 | 2 | 1.7 | 0 | 0 | 0.054 | |
| W-F syndrome | 7 | 7 | 1 | 0.8 | 6 | 2.8 | 0.2431 | |
| Carditis | 1 | 0.3 | 0 | 0 | 1 | 0.5 | 0.461 | |
| Arthrophaty | 1 | 0.3 | 0 | 0 | 1 | 0.5 | 0.461 | |
| Others | 8 | 2.4 | 2 | 1.7 | 6 | 2.8 | 0.543 | |
| Quantitative variables | Mean (SD) | Range | Mean (SD) | Range | Mean (SD) | Range | p-value | |
| Age | 9.7 (7.90) | 0-26 | 6.2 (4.21) | 0-21 | 11.7 (8.73) | 0-26 | < 0.001 | |
| Days of stay | 12.1 (14.57) | 0-109 | 11.7 (14.43) | 0-109 | 12.3 (14.68) | 0-107 | 0.721 | |
| Days until death | 5 (9.98) | 0-46 | 3.4 (4.88) | 0-16 | 5.6 (11.32) | 0-46 | 0.634 | |
| Charlson Comorbidity Index | 0.06 (0.25) | 0-2 | 0.05 (0.26) | 0-2 | 0.06 (0.25) | 0-1 | 0.638 | |
Table 1: General characteristics of all, vaccine failure and non-vaccinated meningococcal C disease cases.
Meningitis alone appears in 28.8% of all cases included and septicemia was the predominant clinical presentation, 51.7% of the cases presented it alone and 16.8% together with meningitis. Clinical presentations distribution was different among vaccine failure and non-vaccinated cases and vaccine failure cases presented a higher proportion of cases with septicemia (63.2% vs. 45.4%) than non-vaccinated cases (p = 0.002).
From 333 cases included, 21 (6.3%) presented a re-admission/hospital transfer during their hospitalisation. From them, 20 were re-admitted or transferred during the same day of discharge in the previous department/hospital and one of them was re-admitted 41 days after.
Case-fatality rate (%) was 13.7% in vaccine failure cases and 19.4% in non-vaccinated cases (p = 0.185). Average time to death event was 3.4 days (75% of them died in ≤ 3.5 days) for vaccine failure cases and 5.6 days (75% of them died in ≤ 8 days) in non-vaccinated cases although non-statistically significant (p = 0.634).
Death outcome happened in most cases in the first days of hospitalisation (75.9% of the cases died in ≤ 5 days) and 21 (36.2%) of the deaths were reported the same day of hospitalisation. Only 3 (18.75%) cases of vaccine failure died after the 7th day of hospitalisation. All of them with an additional risk factor (concomitant infectious diseases). In non-vaccinated cases, 11 (26.19%) cases died after the 7th day of hospitalisation, 3 of them (42.86%) with an additional risk factor (2 of them with a concomitant infectious disease and 1 of them with immunodeficiency).
By clinical presentation, case-fatality rate (%) was 9.38% (N = 9) in meningitis cases, 18.60% (N = 32) in septicemia cases and 24.07% (N = 13) when both clinical presentations appear together (p = 0.015). Average time to death was 5.3 days (SD: 5.15) for meningitis (alone), 2.8 (SD: 4.85) for septicemia (alone) and 8.8 days (SD: 16.76) for those presenting both clinical presentations. Vaccine failures, although presenting more septicemia, died less frequently (12.2%) by septicemia (alone) than non-vaccinated cases (23.5%; p=0.049).
Although, we had higher proportion of men (53.8%) in overall cases, death event was more frequent in women (22.1%) compared to men (13.4%; p = 0.039).
Average time of hospital stay was similar in vaccine failures vs. non-vaccinated cases (p = 0.721) and by clinical presentation (p = 0.204). Average charlson comorbidity index was similar among vaccine failures and non-vaccinated cases (p = 0.638), ranging from 0-2 in vaccine failures and from 0-1 in non-vaccinated cases.
In table 2, we show the most relevant diagnoses and procedures found in the patients included in the study. In total there were 51 (15.3%) cases that between the diagnoses performed during the hospitalisation presented at least one described as risk factor for the disease: 17 (14.5%) within the vaccine failures and 34 (15.7%) within the non-vaccinated cases. From them, 9.9% (N = 33) of the cases presented a concomitant infectious disease, 4.2% (N = 14) drug/alcohol/tobacco abuse, 1.2% (N = 4) immunodeficiencies, 1.2% (N = 4) congenital abnormalities, and 0.6% (N = 2) neoplasms. From 14 cases with drug/alcohol/tobacco abuse 10 (71.43%) of them smoke tobacco: alone (8) or in combination with alcohol or other drugs (2). The other 4 (28.57%) cases with drug/alcohol/tobacco abuse presented abuse of cocaine, cannabis or alcohol.
| All (N=333) |
Vaccination status | Clinical presentation | ||||||||||
| Vaccine failures cases (N=117) |
Non-vaccinated cases (N=216) |
Meningitis (N=96) |
Septicemia (N=172) |
Both (N=54) |
||||||||
| N | % | N | % | N | % | N | % | N | % | N | % | |
| Diagnoses described as risk factors for the disease* |
51 | 15.3 | 17 | 14.5 | 34 | 15.7 | 17 | 17.7 | 26 | 15.1 | 6 | 11.1 |
| -Concomitant infectious disease | 33 | 9.9 | 13 | 11.1 | 20 | 9.3 | 12 | 12.5 | 16 | 9.3 | 4 | 7.4 |
| -Neoplasms | 2 | 0.6 | 1 | 0.9 | 1 | 0.5 | 1 | 1 | 1 | 0.6 | 0 | 0 |
| -Immunodeficiencies | 4 | 1.2 | 1 | 0.9 | 3 | 1.4 | 1 | 1 | 2 | 1.2 | 1 | 1.9 |
| -Drugs/alcohol/tobacco abuse | 14 | 4.2 | 1 | 0.9 | 13 | 6 | 5 | 5.2 | 7 | 4.1 | 2 | 3.7 |
| -Congenital abnormalities | 4 | 1.2 | 2 | 1.7 | 2 | 0.9 | 0 | 0 | 2 | 1.2 | 1 | 1.9 |
| Sense organs disorders | 11 | 3.3 | 3 | 2.6 | 8 | 3.7 | 5 | 5.2 | 4 | 2.3 | 2 | 3.7 |
| -Hearing disorders | 3 | 0.9 | 2 | 1.7 | 1 | 0.5 | 1 | 1 | 2 | 1.2 | 0 | 0 |
| -Ocular disorders | 8 | 2.4 | 1 | 0.9 | 7 | 3.2 | 4 | 4.2 | 2 | 1.2 | 2 | 3.7 |
| Neurologic ocular disorders | 3 | 0.9 | 0 | 0 | 3 | 1.4 | 2 | 2.1 | 0 | 0 | 1 | 1.9 |
| Non-neurologic ocular disorders | 5 | 1.5 | 1 | 0.9 | 4 | 1.9 | 2 | 2.1 | 2 | 1.2 | 1 | 1.9 |
| Heart disturbances | 28 | 8.4 | 9 | 7.7 | 19 | 8.8 | 1 | 1 | 16 | 9.3 | 9 | 16.7 |
| -Heart failure | 11 | 3.3 | 4 | 3.4 | 7 | 3.2 | 0 | 0 | 7 | 4.1 | 3 | 5.6 |
| Circulatory system disorders | 30 | 9 | 12 | 10.3 | 18 | 8.3 | 4 | 4.2 | 16 | 9.3 | 8 | 14.8 |
| Blood disorders | 106 | 31.8 | 38 | 32.5 | 68 | 31.5 | 12 | 12.5 | 64 | 37.2 | 25 | 46.3 |
| -Abnormal platelet count | 18 | 5.4 | 5 | 4.3 | 13 | 6 | 0 | 0 | 10 | 5.8 | 5 | 9.3 |
| -Leucocitopenia/neutropenia | 5 | 1.5 | 2 | 1.7 | 3 | 1.4 | 0 | 0 | 4 | 2.3 | 1 | 1.9 |
| -Spleen disorders | 2 | 0.6 | 0 | 0 | 2 | 0.9 | 0 | 0 | 2 | 1.2 | 0 | 0 |
| Digestive disorders | 21 | 6.3 | 4 | 3.4 | 17 | 7.9 | 3 | 3.1 | 12 | 7 | 4 | 7.4 |
| Renal disorders | 43 | 12.9 | 9 | 7.7 | 34 | 15.7 | 4 | 4.2 | 24 | 14 | 12 | 22.2 |
| -Renal failure | 35 | 10.5 | 8 | 6.8 | 27 | 12.5 | 1 | 1 | 21 | 12.2 | 11 | 20.4 |
| Respiratory disorders | 55 | 16.5 | 17 | 14.5 | 38 | 17.6 | 11 | 11.5 | 35 | 20.3 | 7 | 13 |
| -Respiratory failure | 21 | 6.3 | 7 | 6 | 14 | 6.5 | 2 | 2.1 | 13 | 7.6 | 4 | 7.4 |
| Neurologic disorders** | 38 | 11.4 | 11 | 9.4 | 27 | 12.5 | 13 | 13.5 | 17 | 9.9 | 7 | 13 |
| Seizures/Collapse/Shock/Coma | 93 | 27.9 | 36 | 30.8 | 57 | 26.4 | 9 | 9.4 | 58 | 33.7 | 21 | 38.9 |
| -Shock/coma | 89 | 26.7 | 34 | 29.1 | 55 | 25.5 | 7 | 7.3 | 56 | 32.6 | 21 | 38.9 |
| Skin disorders | 26 | 7.8 | 11 | 9.4 | 15 | 6.9 | 4 | 4.2 | 13 | 7.6 | 8 | 14.8 |
| Joint disorders | 31 | 9.3 | 9 | 7.7 | 22 | 10.2 | 5 | 5.2 | 21 | 12.2 | 4 | 7.4 |
| Transplant/organ loss | 2 | 0.6 | 1 | 0.9 | 1 | 0.5 | 1 | 1 | 1 | 0.6 | 0 | 0 |
| Amputation | 5 | 1.5 | 1 | 0.9 | 4 | 1.9 | 1 | 1 | 0 | 0 | 4 | 7.4 |
**Neurologic disorders excluding sense organs neurologic disorders.
Most frequent diagnose during the hospitalisation was blood disorder (N = 106; 31.8), followed by seizures/collapse/shock/coma (N = 93; 27.9%) and respiratory disorders (N = 55; 16.5%).
Comparing between vaccine failures and non-vaccinated cases, drug/alcohol/tobacco abuse was higher in non-vaccinated cases (p = 0.025), but it is important to mention that non-vaccinated cases were older than vaccine failures. Apart from the increase in drug/alcohol/tobacco abuse in non-vaccinated cases, we only found significant higher proportion of renal disorders in non-vaccinated cases (p = 0.036). However, after adjusting by age, age was the only significant parameter that explained the differences among groups (p < 0.001).
Comparing clinical presentations (meningitis vs. septicemia) septicemia cases had higher adjusted by age (years) risk of presenting heart disturbances (aOR: 11.19; CI95%: 1.44 to 87.08; p = 0.021), blood disorders (aOR: 4.61; CI95%: 2.30 to 9.27; p < 0.001), renal disorders (aOR: 5.28; CI95%: 1.71 to 16.26; p = 0.004) or renal failure (aOR: 18.41; CI95%: 2.39 to 142.09; p = 0.005) and shock/coma (aOR: 6.83; CI95%: 2.92 to 15.95; p < 0.001).
Table 3 shows the results of the univariable analysis for the association between distribution of demographic characteristics and diagnoses in cases with death outcome for all and by prior vaccination (vaccine failure or no vaccination) and clinical presentation (meningitis, septicemia or both). Sense organs disorders, skin disorders, joint disorders and transplants or organ loss or amputation were not related to death event in any of the groups (overall, by vaccination status or by clinical presentation).
|
Factors related to death outcome in MenC cases |
Factors related to death outcome in vaccine failures and non-vaccinated cases |
Factors related to death outcome in meningitis and septicaemia cases |
||||||
|
Variables |
All |
Vaccine failures |
Non-vaccinated cases |
Meningitis |
Septicemia |
Both |
||
|
OR (CI95%) |
OR (CI95%) |
OR (CI95%) |
OR (CI95%) |
OR (CI95%) |
OR (CI95%) |
|||
|
Sex |
Ref. Men |
1.83 (1.03;3.25)* |
1.6 (0.55;4.63) |
1.94 (0.98;3.95) |
2.38 (0.59;9.51) |
1.95 (0.89;4.25) |
0.92 (0.26;3.34) |
|
|
Age group |
Ref. ≤ 13 years |
2.52 (1.42;4.49)* |
3.1 (0.71;13.50) |
2.38* (1.18;4.78) |
10.32 (1.24;86.08)* |
3.24 (1.45;7.22)* |
2.34 (0.64;8.50) |
|
|
|
||||||||
|
Risk factors for the disease |
Yes |
1.19 (0.56;2.54) |
2.26 (0.63;8.06) |
0.87 (0.33;2.26) |
1.37 (0.26;7.26) |
1.05 (0.36;3.03) |
3.8 (0.66;21.77) |
|
|
Heart disturbances |
Yes |
5.01 (2.23;11.23)** |
3.65 (0.81;16.41) |
5.73 (2.16;15.22)** |
- |
4.08 (1.39;11.96)* |
5.78 (1.26;26.45)* |
|
|
Heart failure |
Yes |
14.51 (3.72;56.56)** |
7.07 (0.92;54.29) |
28.83 (3.37;246.85)* |
- |
12.78 (2.36;69.31)* |
7.27 (0.60;87.85) |
|
|
Renal failure |
Yes |
7.89 (3.74;16.62)** |
8.08 (1.79;36.60)* |
7.5 (3.17;17.75)** |
- |
8.73 (3.26;23.36)** |
10.79 (2.41;48.42)* |
|
|
Respiratory failure |
Yes |
5.0 (2.01;12.42)* |
22.5 (3.89;130.02)** |
2.48 (0.78;7.82) |
- |
4.38 (1.36;14.11)* |
12.00 (1.13;127.98)* |
|
|
Circulatory disorders |
Yes |
2.65 (1.17;6.03)* |
3.87 (1.01;14.83)* |
2.25 (0.79;6.39) |
- |
2.17 (0.70;6.76) |
4.11 (0.86;19.68) |
|
|
Blood disorders |
Yes |
3.06 (1.71;5.47)** |
2.37 (0.81;6.89) |
3.47 (1.73;6.96)** |
0.86 (0.10;7.59) |
2.63 (1.20;5.75)* |
5.78 (1.37;24.34)* |
|
|
Abnormal platelet count/Leucocitopenia/ |
Yes |
8.54 (3.45;21.14)** |
4.67 (0.72;30.42) |
9.94 (3.42;28.85)** |
- |
9.0 (2.71;29.74)** |
3.8 (0.66;21.77) |
|
|
Digestive disorders |
Yes |
3.23 (1.27;8.18)* |
2.18 (0.21;22.33) |
3.28 (1.17;9.21)* |
- |
3.52 (1.04;11.92)* |
12.00 (1.13;127.97)* |
|
|
Neurologic disorders |
Yes |
2.15 (1.00;4.63) |
4.48 (1.14;17.57)* |
1.54 (0.60;3.93) |
3.85 (0.83;17.86) |
0.93 (0.25;3.45) |
5.63 (1.07;29.73)* |
|
|
Seizures/Collapse/Shock/Coma |
Yes |
9.31 (4.95;17.51)** |
9.63 (2.84;32.63)** |
10.00 (4.70;21.28)** |
13.12 (2.66;64.66)* |
5.31 (2.34;12.07)** |
17.05 (3.22;90.28)* |
|
Table 3: Univariable analysis for the relationship among demographic and clinical characteristics and death outcome in meningococcal C cases (overall and for vaccine failures cases, non-vaccinated cases, meningitis, septicemia and both).
Risk of death was higher in women (OR: 1.83; p = 0.039), in > 13 years (OR: 2.52; p = 0.002) and it was especially high in those that suffered heart failure (OR: 14.51; p < 0.001), seizures/collapse/shock/coma (OR: 9.31; p < 0.001), abnormal platelet count/leucocitopenia/neutropenia/spleen disorders (OR: 8.54; p < 0.001) or renal failure (OR: 7.89; p < 0.001). Inside the group of those with abnormal platelet count/leucocitopenia/neutropenia/spleen disorders: highest risk of death outcome was found in those with leucocitopenia/neutropenia (OR: 20.30; CI95%: 2.23 to 185.14; p = 0.008) compared to abnormal platelet count (OR: 8.96; CI95%: 3.31 to 24.28; p < 0.001) and spleen disorders (OR: 4.81; CI95%: 0.30 to 77.99; p = 0.269) (Table 3).
Heart failure seemed to be more involved in death outcome in non-vaccinated cases (OR: 28.83; p = 0.002) than in vaccine failures (OR: 7.07; p = 0.060) which seemed to be more affected by respiratory failure (OR: 22.5; p < 0.001).
Multivariable analysis was shown in table 4. Heart failure was the main risk factor for death in all (aOR: 9.43; p = 0.005), non-vaccinated cases (aOR: 17.30; p=0.024) and septicaemia cases (aOR: 10.95; p = 0.011). Respiratory failure was the main risk factor for death (aOR: 46.67; p < 0.001) in vaccine failures and seizures/collapse/shock/coma was the main risk factor in those with meningitis alone (aOR: 9.90; p = 0.012) or in combination with sepsis (aOR: 17.05; p = 0.001). Risk factors for the disease (aOR: 5.36; p = 0.046), as well as charlson comorbidity index (aOR: 8.24; p = 0.015) were independently associated to death event in the vaccine failure cases.
| All | Adj. Odds Ratio | Std. Err. | z | P > z | [95% Conf. | Interval] |
| Heart failure | 9.43 | 7.564 | 2.8 | 0.005 | 1.96 | 45.43 |
| Age group | 2.86 | 0.986 | 3.04 | 0.002 | 1.45 | 5.62 |
| Seizures/Collapse/Shock/Coma | 7.43 | 2.567 | 5.81 | 0 | 3.78 | 14.62 |
| Abnormal platelet count/ Leucocitopenia/ Neutropenia/Spleen disorders |
3.12 | 1.652 | 2.15 | 0.031 | 1.11 | 8.81 |
| Vaccine failures | Adj. Odds Ratio | Std. Err. | z | P > z | [95% Conf. | Interval] |
| Charlson comorbidity index | 8.24 | 7.231 | 2.4 | 0.015 | 1.48 | 46.01 |
| Heart failure | 27.1 | 31.215 | 2.86 | 0.004 | 2.83 | 259.13 |
| Respiratory failure | 46.67 | 47.626 |
DISCUSSIONPrevious studies developed by our group were focused on assess vaccine effectiveness of meningococcal C disease [4,18]. It is known that vaccine failures are more frequent at younger ages. Therefore, based on previous studies and the epidemiological situation in Spain the infant vaccination schedule has been changed and adapted from the initial schedule that started in December of 2000 with 3 doses at 2-4-6 months, to 3 doses at 2-4-12/15 months in 2006 and to 3 doses at 2-12 months and at 12 years in 2014 in order to ensure long-term protection [18]. CONCLUSIONVaccine failures were younger and presented more septicemia but lower fatality-rates than non-vaccinated cases. Severity of the disease was not related to prior vaccination and seems related to clinical presentation and age-group, showing an increasing trend of death rate from meningitis to septicemia and to both clinical presentations together. Risk factors for infection and charlson comorbidity index were independently associated to death event in vaccine failure cases, in which the main risk factor for death was respiratory failure, showing this group is maybe more affected by respiratory concomitant diseases. Shorter average time to death and lower rates of meningitis (with slower progression) in vaccine failures might be related to a secondary response after 7 days. CONFLICT OF INTEREST STATEMENTThe authors declare that they have no competing interests. ACKNOWLEDGEMENTThe authors would like to thank all the epidemiologists and vaccine health officers who participate in the meningococcal disease surveillance network. REFERENCES
Citation: Garrido-Estepa M, Ordóñez-León GY, Esteban FJ, Pérez-Formigó J, Martínez EV, et al. (2016) Clinical and Epidemiological Differences Among Meningococcal C Conjugate Vaccine Failures and Non-Vaccinated Cases. J Vaccines Res Vaccin 2: 002. Copyright: © 2016 Garrido-Estepa M, et al. This is an open-access article distributed under the terms of the Creative Commons Attribution License, which permits unrestricted use, distribution, and reproduction in any medium, provided the original author and source are credited. Journal Highlights
© 2026, Copyrights Herald Scholarly Open Access. All Rights Reserved!
|