Comparison of HOBO and LI-COR Light Meters in a Freshwater Wetland
*Corresponding Author(s):
Jessica A MilesDepartment Of Environmental Science Technology, Palm Beach State College, 3160 PGA Blvd., Palm Beach Gardens, Florida, 33418, United States
Tel:+1 5612075220,
Email:milesj@palmbeachstate.edu
Abstract
The aim of this study was to explore the comparability of HOBO and LI-COR light sensors in a freshwater wetland to determine if the HOBO sensors could be successfully used in place of the more expensive and complicated spherical quantum sensor type with minimal margin of error for PAR measurements. Additionally, this study analyzed for the appropriate minimum data interval sampling length that still maintained a strong correlation between these sensor types. For this comparative experiment, light trees made of PVC pipes held both HOBO and LI-COR sensors in a shallow water wetland pond at different depths and just above the water’s surface. The sensors collected data for four days with a sampling rate of one measurement every minute and processed with 15 min averages. HOBO sensor data from each branch (top, middle, bottom) correlated significantly with its associated LI-COR sensor branch as follows: top branch (R2 = 0.94; P < .001); middle branch (R2 = 0.95; P < .001); bottom branch (R2 = 0.95; P < .001). It was observed that using a shorter 5 min averaging times resulted in the R2 correlation remaining significant.
INTRODUCTION
In the field, such as in wetlands, accurate underwater light measurements are a critical component of environmental analysis and in modeling aquatic ecosystem productivity. In these habitats, sensors, designed to go underwater, measure photosynthetically active radiation, or PAR, at wavelengths from 400 to 700 nm. PAR is equivalent to the rate of electromagnetic radiation received on a surface, which corresponds to the light energy absorbed by photosensitive pigments found in plants [1]. PAR data is useful in monitoring plant productivity, as light is the energy source for photosynthesis, and it contributes to our understanding of aquatic environmental health.
There is a wide array of PAR sensors on the market, generally planar or scalar types. Planar sensors, also known as regular quantum sensors, receive and measure light on a horizontal surface as it comes in from the hemisphere or dome extending upward from the plane, whereas scalar sensors, or spherical quantum sensors, measure incoming light from almost all directions except for the region where the stem of the sensor is positioned [2]. HOBO sensors are of the planar type and, it should be noted, are more affordable, durable, and easy to use in the field than scalar-type sensors. However, HOBO planar sensors require calibration and have limited factory specifications [3]. LI-COR scalar sensors are generally more expensive, delicate, and complicated, in regard to field deployment, than HOBO sensors. LI-COR sensors are, however, assumed to be the more accurate light sensor due to its extensive factory calibration [3].
Depending on the purpose of a study, choosing the correct sensor can be a challenge. Not only must one choose the type of sensor to use, or incorporate both types, but there are cost considerations, ease of use factors, and concerns regarding output and/or software compatibility for the communication of results. Additionally, light sensor design differs from one manufacturer to the next, and intercalibration between sensors can be complicated due to the different light-capturing properties of the sensors [3]. Finally, underwater environmental factors such as light scatter and depth attenuation, turbidity and nutrient load, and bottom substrate all compound challenges of accurate light measurement.
Several studies were identified that compared different light sensor types [3-10]. The study by Long et al. [3], specifically included a comparative analysis of planar HOBO and scalar LI-COR sensors, and they provided detailed methods regarding the calibration used to enable replicability. Their methods involved conducting sensor analysis under controlled laboratory conditions in a growth chamber as well as at three marine field sites including a sand flat in outer West Falmouth Harbor, Massachusetts and a reef and a sea grass bed near Key Largo, Florida. Boese et al., [4] and Glud et al. [6], conducted work also in a marine environment, whereas Fanta et al. [5], completed their work in a freshwater stream. However, at present no other studies could be found that examined these light sensor types in the field, tested under freshwater aquatic conditions in a wetland.
The research objective of our study was to explore the comparability of HOBO and LI- COR light sensors in a freshwater wetland to determine if the HOBO sensors could be successfully used in place of more expensive and complicated spherical quantum sensor type with minimal margin of error for PAR measurements. Additionally, studies frequently utilize a sampling protocol with ≤1 min intervals set to integrate over ≥15 min to provide an average [1,3]. We analyzed for the appropriate minimum data interval sampling length that still maintained strong correlation.
METHODS
Site characterization
Both HOBO (model: ua-002-08) and LI-COR (2pi model: LI-0190R; 4pi model LI-193SA) light sensors were placed into a shallow, freshwater retention pond/wetland located at the South Florida Water Management District (SFWMD), Field of Operations Center (FOC) in West Palm Beach, Florida from 2/18/2020 to 2/21/2020. The shallow wetland pond was 89 m in length and 40 m at its widest, and the depth where the sensors were placed was 67 cm. Mixed aquatic vegetation was sparse, except for groups of lily pads and Eleocharis sp. Weather conditions during deployment, and for the data collection period, were sunny with limited cloud coverage.
Sensor deployment
For this comparative experiment, our team developed three light trees using rebar and PVC pipes to hold both HOBO and LI-COR sensors in the shallow water retention pond. A total of eleven planar HOBO sensors (loggers labeled A-L), one 4pi LI-COR sensor, and two 2pi LI-COR sensors were deployed at the northern edge of the pond. Multiple HOBO sensors were placed on branches to reduce variability in the measurements and to provide a check for sensor fouling. A similar set up to the Long et al. [3], study included having sensors at a set distance above the sediment and also in the mid-water column; however, at our site there were no varying water depths to contend with as there were no tidal fluctuations in the freshwater pond (2012). Our study also included both in-water and in-air sensors to continue to grow the range of site comparisons for different sensor types across variable habitat settings. PVC pipes were painted black to ensure light would not reflect from the structure itself. Horizontal branches held the sensors according to the following set-up (Figure 1):
- Tree 1 had a single branch set at 55 cm above the sediment, and the top of HOBO sensors “J” and “L” were 12 cm from the water’s
- Tree 2 had three branches with the lowest branch placed 22 cm above the sediment that hosted a LI-COR 2pi sensor 45 cm from the water’s surface, the middle branch was set such that a LI-COR 4pi sensor was 12 cm below the water’s surface, and the topmost branch held a LI-COR 2pi sensor 10 cm above the water’s
- Tree 3 had three branches with the lowest branch placed 22 cm above the sediment that hosted HOBO sensors “A,” “B,” and “C” at a level 45 cm from the water’s surface, the middle branch, set 33 cm higher, hosted HOBO sensors “D,” “E,” and “F” at 12 cm below the water’s surface, and the topmost branch with HOBO sensors “G,” “H,” and “I” were held 10 cm above the water’s
We drilled holes into the horizontal PVC branches and attached the sensors using zip ties. The light trees were placed on and zip tied to three rebar poles that were previously hammered into the pond sediment. For those trees with multiple branches, the sensors were placed facing directly up and spread out sufficiently so as to prevent shading from other sensors and the supporting vertical PVC pipe. The LI-COR (LI-1400) data logger was put into a water-resistant Pelican case that was then placed in the middle of a rebar-tripod on shore to prevent movement or water intrusion.
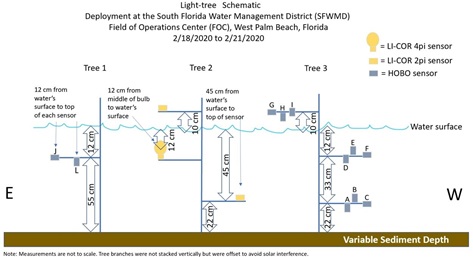 Figure 1: Schematic showing light-tree structure and sensor placement. All HOBO sensors were given an alphabetical label.
Data collection
The sensors collected data for four days. While deployed, the LI-COR (LI-1400) used a sampling rate of one measurement every minute and processed 15 min averages. HOBO loggers also captured data every minute, but the 15 min averages were calculated during post-processing using HOBO software.
Statistical analysis
Excel box plots were used to compare data between HOBO sensors, organized by depth, to determine fouling or inaccuracy of any one of the sensors. Excel and R Studio were used in creating the regression analysis model comparing the HOBO and LI-COR data, and R Studio was used for R2 analysis of different length of average time intervals for data collection.
RESULTS
A pilot study revealed inter-sensor variability within HOBO sensors held at similar elevations/depths, as a result of sensor placement/leveling. Variability within HOBO sensors was considerable during the pilot study when any of the sensors were slanted and/or not level; however, for the present study, when the sensors were placed flat, variability lowered substantially. For example, the inter-sensor variability of the HOBOs during the single-day pilot study for the top sensor ranged from 11,878.4 to .1 lum/ft² with an average difference of 2518.2 lum/ft² (SD = 2644.4), the middle sensor ranged from 4563.2 to .1 lum/ft² with an average difference of 560.9 lum/ft² (SD = 90.9) and the bottom sensor ranged from 2787.2 to .1 lum/ft² with an average difference of 271.3 lum/ft² (SD = 70.5) (Figure 2). The inter-sensor variability of the HOBOs during the final study for the top sensor ranged from 2252.8 to .3 lum/ft² with an average difference of 480.7 lum/ft² (SD = 535.8), the middle sensor ranged from 2874.6 to .1 lum/ft² with an average difference of 331.9 lum/ft² (SD = 104.2), and the bottom sensor ranged from 1254.4 to .2 lum/ft² with an average difference of 150.7 lum/ft² (SD = 76.9) (Figure 3). The results of the inter-sensor variability analysis for HOBO sensors A-L, showed that proper placement of the sensors on the light trees results in minimal variability and high consistency of data throughout the day.
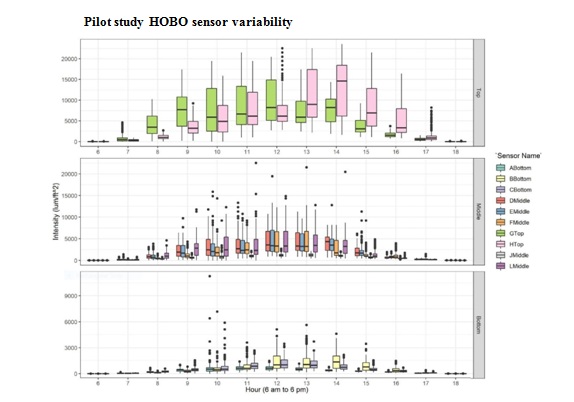 Figure 2: Pilot study results of HOBO sensors “A-H,” “J,” and “L” and their inter-sensor variability for a single day. Results grouped by sensor depth/altitude with “Top” indicating 10 cm above the water’s surface, “Middle” indicating 12 cm below the water’s surface, and “Bottom” indicating 45 cm below the water’s surface.
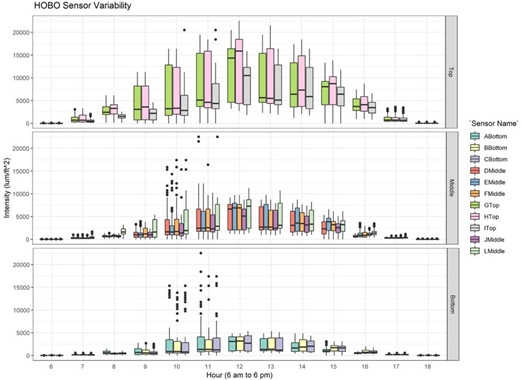 Figure 3: Final study results of HOBO sensors “A-H,” “J,” and “L” and their inter-sensor variability for a single day. Results of light intensity over time were grouped by sensor depth/altitude with “Top” indicating 10 cm above the water’s surface, “Middle” indicating 12 cm below the water’s surface, and “Bottom” indicating 45 cm below the water’s surface.
HOBO light sensor data was correlated with PAR data from the LI-COR sensors. Each HOBO branch (top, middle, bottom) correlated significantly with its associated LI-COR branch as follows: top branch (R2 = 0.94; P < .001; figure 4); middle branch (R2 = 0.95; P < .001; figure 5); bottom branch (R2 = 0.97; P < .001; figure 6). The R-square and P-value reveal a direct correlation with statistical significance between HOBO and LI-COR light data in freshwater wetland conditions and aerial conditions just above the water’s surface.
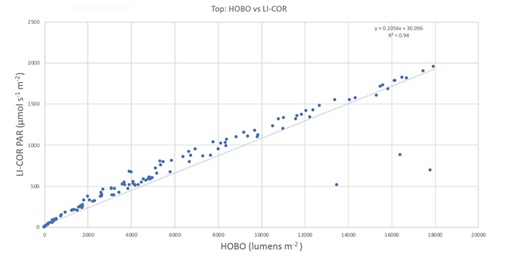 Figure 4: HOBO versus LI-COR sensor readings from the top branch of the light tree correlated significantly (R2 = 0.94; P < .001) during the data collection period from 2/18/2020 to 2/21/20.
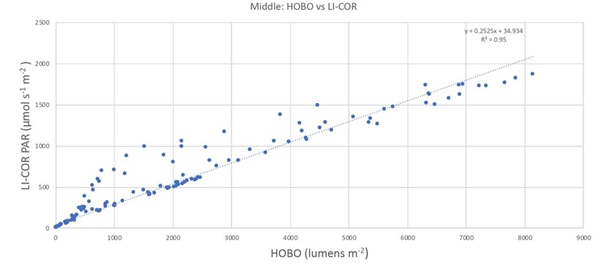 Figure 5: HOBO versus LI-COR sensor readings from the middle branch of the light tree correlated significantly (R2 = 0.95; P < .001) during the data collection period from 2/18/2020 to 2/21/20.
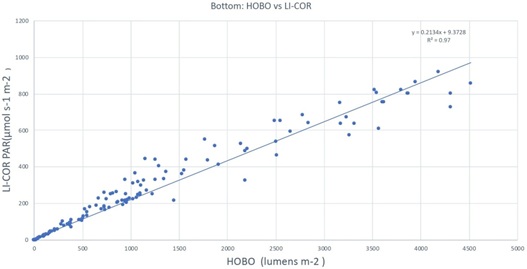 Figure 6: HOBO versus LI-COR sensor readings from the middle branch of the light tree correlated significantly (R2 = 0.97; P < .001) during the data collection period from 2/18/2020 to 2/21/20.
Both the HOBO and LI-COR sensors were set to collect data every minute. This data was then automatically (LI-COR) or manually (HOBO) averaged over 15 min periods. It was observed that if using a shorter, 5 minutes averaging time that the R2 correlation remained significant (Figure 7). Lower correlation values are observed prior to a 5 min mean time interval; however, the curve flattened after the 5 min mean time interval.
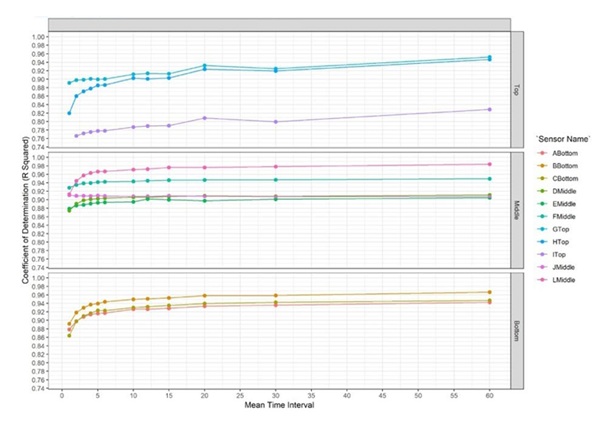 Figure 7: HOBO versus LI-COR sensor readings and a coefficient of determination (R2) for different lengths of mean time interval.
DISCUSSION
The results indicate a significant correlation between HOBO and LI-COR light sensors at the altitude/depths measured and under the conditions at the wetland site. These findings concur with those of Long et al. [3]. Additionally, we agree that HOBO sensors, with their simplicity, versatility, and cost savings, could be advised for use under similar environmental conditions in place of more expensive and sophisticated light sensors. Because of their reduced costs, multiple HOBOs may be deployed, with their results averaged easily, and adding the benefit of additional accounting for small-scale spatial differences at the site, or used comparatively to determine sensor failure or fouling. This multiplicity and replication in measurements can save time and energy for deployment and retrieval because the added HOBO sensors serve as backups and security for the overall data collection process.
In regard to specific data reported in this study, there are a few points to mention. First, in figure 4, three data points are outliers. We account for these outliers as data collected when a cloud passed over or a bird visited the light tree. Second, the pilot study, conducted prior to this research, revealed design flaws that were remedied for the present report. We believe these flaws are worth noting in the event this work is replicated, and there is a more detailed account of the adjustments made within the Results section of this paper.
HOBO planar sensors are especially sensitive to their positioning, and, if they are affixed at even a slight angle and not perfectly flat/level, they will not successfully measure maximum illuminance. These errors are compounded when comparing the HOBO sensors to the LI-COR sensors. The disparity in lum/ft² values between the pilot study and the present research indicates the importance of a test run to quality check the sensors and the value of proper positioning for the HOBO planar sensors.
When analyzing for the appropriate minimum data interval sampling length that still maintained a strong correlation between the readings of the HOBO and LI-COR sensors, a 15 min average was observed to be longer than is necessary. An optimum minimum length time is 5 min. The data curve flattens at around the 5 min. mark, and in that shorter time period, the correlation remains significant. This result could be beneficial in field data collection protocols, by extending battery life and increasing the number of days of sampling, or lessen the amount of time that field technicians spend at sites, if they are conducting discrete sampling.
Future studies should consider testing additional light sensor types. As technology advances, it is important to continue to evaluate light sensor accuracy, but also to relate data accuracy to relative equipment costs. This information may enable less-developed countries to undertake productivity analyses for marine, aquatic, or terrestrial habitats, including agricultural lands. Also, schools and lower-income educational institutions may require, due to budget constraints, cost-effective equipment for instructing students on environmental sampling techniques and environmental or agricultural conditions and health. Mickley et al. [11] has described an analysis of Arduino-type sensors, or what they termed Environmental Microcontroller Units (EMUs), which may be a good place to start a correlation analysis. If a high level of correlation to more costly sensors is observed, these lower-cost options may be an excellent alternative for PAR monitoring.
ACKNOWLEDGEMENT
We would like to thank the team at the South Florida Water Management District: Jill King, Kathleen Pietro, Matthew Powers, and Jessica Wilson for their time and effort with this experiment.
REFERENCES
- Alados L., Moreno IF, Olmo FJ (2000) Estimation of photo synthetically active radiation under cloudy conditions. Agricultural and Forest Meteorology 102: 39-50.
- Both AJ (2020) Revisiting the measurement of light.
- Long MH, Berg JE, Zieman JC (2012) A comparison and correction of light intensity loggers to photosynthetically active radiation sensors. Limnology and Oceanography: Methods 10: 416-424.
- Boese BL, Robbins BD, Thursby G (2005) Desiccation is a limiting factor for eelgrass (Zostera Marina L.) distribution in the intertidal zone of a northeastern Pacific (USA) estuary. Botantica Marina 48: 274-283.
- Fanta SE, Hill WR, Smith TB, Roberts BJ (2010) Applying the light: Nutrient hypothesis to stream periphyton. Freshwater Biology 55: 931-940.
- Glud RN, Kühl M, Wenzhöfer F, Rysgaard S (2002) Benthic diatoms of a high arctic fjord (Young Sound, NE Greenland): Importance for ecosystem primary productivity. Marine Ecology Progress Series 238: 15-29.
- Hulatt CJ, Thomas DN (2011) Energy efficiency of an outdoor microalgal photobioreactor sited at mid-temperate latitude. Bioresource Technology 102: 6687-6695.
- Meyercordt J, Domin A, Forster RM, Hartig P, Köhler J (1999) Intercomparison of light meters. Berichte aus dem Forschungs- und Technologiezentrum Westküste der Universitat Kiel 19: 39-52.
- Piniak GA, Brown EK (2008) Growth and mortality of coral transplants (Pocillopora damicornis) along a range of sediment influence in Maui, Hawai’i. Pacific Science 62: 39-55.
- Wall CC, Peterson BJ, Gobler CJ (2011) The growth of estuarine resources (Zostera marina, Mercenaria mercenaria, Crassostrea virginica, Argopecten irradians, Cyprinodon variegatus) in response to nutrient loading and enhanced suspension feeding by adult shellfish. Estuaries and Coasts 34: 1262-1277.
- Mickley JG, Moore TE, Schlichting CD, DeRobertis A, Pfisterer EN, et al. (2018) . Methods in Ecology and Evolution 10: 578-584.
Citation: Eccles A, Miles JA (2020) Comparison of HOBO and LI-COR Light Meters in a Freshwater Wetland. J Environ Sci Curr Res 3: 023.
Copyright: © 2020 Abigail Eccles, et al. This is an open-access article distributed under the terms of the Creative Commons Attribution License, which permits unrestricted use, distribution, and reproduction in any medium, provided the original author and source are credited.