Comparison of Physical Activity between Children and Adolescents with and without Disabilities in Finland
*Corresponding Author(s):
Antti TeittinenDepartment Of Research And Development, Finnish Association On Intellectual And Developmental Disabilities , Viljatie 4 A, 00700 Helsinki, Finland
Tel:+358 934809218,
Email:antti.teittinen@kvl.fi
Abstract
Aim
To compare physical activity between children and adolescents with and without disabilities in Finland.
Materials and Methods
We use two materials: a separate sample of children and adolescents with disabilities and a basic sample of the Finnish Leisure Study for Children and Adolescents from 2018. A separate sample (n = 152) was collected by sending a questionnaire to 500 adolescents with disabilities. We limited the data to 13-17-year-olds (n = 303). We combined a basic sample of the study material (n = 241) with a separate sample (n = 62) of adolescents with disabilities. Method is a quantitative survey analysis.
Results
The main finding of our study is that adolescents with disabilities engage in less physical activity than adolescents without disabilities in the 13-17 age groups. The physical activity of adolescents with disabilities compared to the corresponding physical activity parameters of adolescents without disabilities explains, on the one hand, the differences in physical activity between these groups as social situations and on the other hand the motivational factors of physical activity.
Conclusions
In the context of the UN CRPD definition of disability, the study reinforced the notion of the changing meaning of disability in different contexts. In some cases, the disability played a role in relation to social situations in exercise and in some cases did not. Examining the physical activity of people with disabilities reveals the conditions for participating in physical activity: which promote and which restrict or reduce participation in physical activity.
Keywords
INTRODUCTION
We are motivated to do comparative research between people with and without disabilities because people with disabilities are most often excluded from nationwide population surveys. Even if people with disabilities are included in the sample, they cannot be identified and the results are not reported from this perspective. Studies on people with disabilities are usually conducted within a disability group, and the results are often not comparable to studies on the general population. And this is also evident in the Leisure Survey for Children and Adolescents in Finland: children and adolescents with disabilities are only included in a separate sample and were not included in the original study.
Our starting point in the article is the emphasis of the UN Convention on Disability on the relationship between the phenomenon of disability and its environment. We look at and compare the physical activities of children and adolescents with disabilities results from a basic sample of the Leisure Survey for the same age group. The samples selected for the examinations generally exclude persons with different types of disabilities, such as those in institutions or service housing [5-7]. The living conditions of people with disabilities have generally been studied solely by different disability groups, and their own indicators have been developed for these studies. Then comparisons with the rest of the population have been impossible. In this study, at least a partial comparison between disabled and other children and adolescents is possible because the questionnaire for adolescents with disabilities contained partly the same questions as the basic sample questionnaire for children and adolescents.
Studies of physical activity among children and adolescents with disabilities and functional limitations in their own groups have often focused on the connection between physical activity and quality of life [8,9], access to physical activity [10], adverse health effects of immobility and marginalization from communities [11]. Comparative studies have often focused on health inequalities, and subjects' own experiences of their lives have been neglected. However, sociologically oriented studies comparing people with disabilities with the rest of the population have looked at social networks [12] and social capital [13], among others. In Europe, one of the most comprehensive databases comparing the situation of people with disabilities with the rest of the population in statistics is the European Union's SILC, which is constantly updated. Its statistical data is not specifically designed for research purposes, but it does reveal the gap between people with disabilities and the rest of the population, and can serve as a basis for building more differentiated comparative research approaches.
MATERIALS AND METHODS
In our analysis, we limited the data to 13-17-year-olds (n = 303). We combined a basic sample of the study material (n = 241) with a separate sample (n = 62) of adolescents with disabilities. A preliminary analysis we found that the question “How important is it for you to not exercise is because you have a disability or illness that makes it more difficult to exercise?” was answered by 11 of the sample participants as “very significant”. These 11 adolescents were included in the group of adolescents with disabilities. However, it is quite possible that more adolescents with some disability or long-term illness have been included in the basic sample, but they do not feel that it is a hindrance to their physical activity. However, it is impossible to identify these adolescents from the data because the study did not ask them any disability questions.
Therefore, this dataset, which covers 13-17 year olds, has 73 (24%) adolescents with some kind of disability, and 230 (75%) adolescents without disabilities (Table 1). When we wanted to compare the physical activity of children and adolescents with disabilities and the basic sample of children and adolescents and related factors, we had to make sure that the same age group was used in the comparison, and that the desired variables had the same names and definitions.
|
|
Adolescents with disability |
Adolescents without disability |
Total |
|
Girl |
34 (46.6%) |
114 (49.6%) |
148 (48.8%) |
|
Boy |
38 (52.1%) |
114 (49.6%) |
152 (50.2% |
|
Other |
1 (1.4%) |
2 (0.9%) |
3 (1.0%) |
|
Total |
73 (100%) |
230 (100%) |
303 (100%) |
Our data was analyzed by using cross-tabulations and Chi-square -tests. This was done because the nature of the data and to demonstrate the group differences in a concrete way. In initial analyses also one-way ANOVA was used.
Functionallimitations
- Physical limitation: Much difficulty or inability to function at least in one of the basic functional dimensions: seeing, hearing or walking
- Problems taking care of themselves: Much difficulty or inability to take care of themselves
- Cognitive limitation: Much difficulty or inability to function with at least one basic functional dimensions: remembering things, learning new things, or focusing
- Social limitation: Much difficulty or inability to work with at least one basic functional dimensions: accepting changes, controlling one's behavior, getting friends
|
|
n (Total= 73) |
% |
|
Physical limitations |
9 |
14.5 |
|
Self-care problems |
10 |
16.1 |
|
Cognitive limitations |
28 |
45.2 |
|
Social limitations |
24 |
38.7 |
|
Communicative limitations |
16 |
25.8 |
|
None |
25 |
40.3 |
40% of adolescents with disabilities estimate that they have no severe disabilities. This means that by using such questions and definitions, respondents with disabilities or long-term illnesses cannot be uniquely identified in the data. On the other hand, many had reported that they had severe disabilities in more than one area of disability. Based on this, it is not possible to divide the disabled adolescents into groups according to the quality of the disability in the data and thus to make comparisons between the disability groups.
Comparison of physical activity between children and adolescents with and without disabilities
Although we have compared the responses of adolescents with and without disabilitiesabout their exercise or physical activity, we realize that the comparative setting alone does not indicate that adolescents with disabilities are often less likely to have poor physical fitness or physical or cognitive barriers to achieving age-appropriate physical performance. Rather, our analysis seeks to explore the social, cultural, and agency-related causes among adolescents with disabilities compared to adolescents without disabilities.
Physical activity
|
|
Adolescents with disability |
Adolescents without disability |
Total |
|
No physical exercise |
15 (20.5%) |
18 (7.8%) |
33 (10.9%) |
|
Physical exercise |
58 (79.5%) |
212 (92.2%) |
270 (89.1%) |
|
Total |
73 (100%) |
230 (100%) |
303 (100%) |
|
Chi square: 9.24, p<.01 |
|||
The result is similar to that of the 2016 “Lifestyle Exercise Behavior in Children and Adolescents in Finland” (LIITU) [17], which compared physical activity, membership in a sports club and sitting time between adolescents with disabilities and without disabilities. In the LIITU study, adolescents aged 11-15 were asked to report functional limitations they experienced. In addition, the study investigated the links between functional limitations and physical activity, sports club activities and sitting. About 15% of adolescents reported experiencing a functional limitation. Of the various functional limitations, physical activity is most affected by mobility problems [18].
The physical activity of people with disabilities has been studied a lot around the world. The central finding of these studies is that physical activity contributes to the health and general well-being of physically disabled people in particular, since they are otherwise most immobile [8,19,20]. However, a simple comparison between people with and without disabilities as to whether or not the informant who responded to the survey is engaged in physical activity is not built. This basic question is often accompanied by a review of exercise frequencies, effectiveness and duration over a longer period of time. Methodologically, however, the basic question produces a basic set of people who exercise and not exercise. The groups thus formed can be used to further analyze issues related to exercise or non-exercise.
RESULTS
Division of exercise places and practices

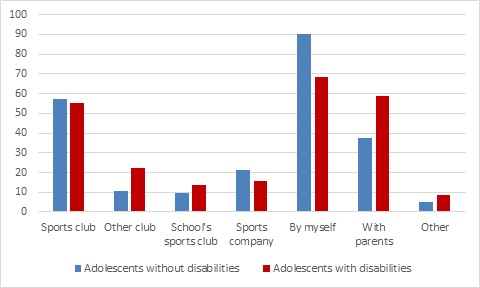
Statistically significant differences between groups of adolescents with and without disabilities in volunteering, with parents and non-sports club activities may be due to the availability and accessibility of sports facilities and sports clubs.Adolescents with disabilities exercise voluntarily less thanadolescents without disabilities, but with parents and other people they exercise more than adolescents without disabilities. Self-developed physical activity is a success, parents may play a role in assisting with physical activity, and sports clubs may not be able to engage in activities that are suitable for the disabled. This question has therefore been one of the major dilemmas in the development of specialized exercise. Aija Saari [21], in her doctoral dissertation, highlighted the tensions between special sports for children and adolescents and the ideology of inclusion. Such tensions were evident between the special activity and the general activity of the club, both for the organizers and for the participants or the parents. Tensions emerged that general sports club activities may not have invested sufficiently in key sports activities such as low-threshold club activities, subsidiary or applicability of performance, sufficient reciprocal information, and organizational leadership support. Based on these results, a picture of barriers and incentives for inclusion was drawn. The fundamental role of special physical activity as an enabler of inclusive practices also took on a new role when general sports club activities were able to implement forms of special physical activity.
Exercise motivation

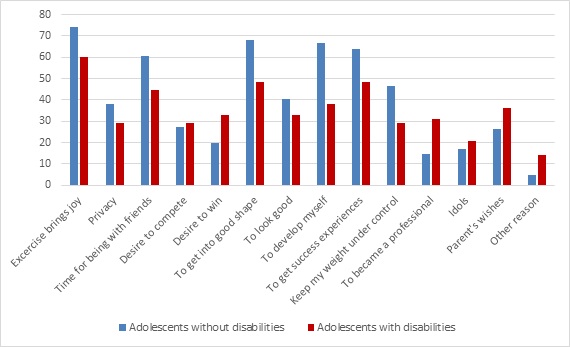
In a systematic literature review of the meaning of leisure for physically disabled children and adolescents [22], where 2/3 of the selected studies dealt with physical activity, joy, fulfillment, freedom, and friendship were also key motivational factors. Joy meant pleasure and happiness, achievement / to-do development and expression of competence and identity, freedom of choice and freedom from limitations, and friendship and family together and acceptance. These results are in line with the results of our own research on the most important motivational factors for exercise. Especially pleasure, staying fit [22] and friendship were important motivation factors. The results of the leisure and sport exercise survey broadly shed light on the social status of people with disabilities: they explain the impact of disability on self-awareness, self and body and highlight the benefits of participation in physical activity, its impact to get over disability barriers, to participate and to improve communality [23]. In developing social and health services to make them more accessible to people with disabilities, the same themes have been explored in the framework of International Classification of Functioning, Disability and Health (ICF) [24,25].
Physical inactivity
All in all, adolescents with disabilities reported more reasons for non-physical activity thanadolescents without disabilities (see Table 4). The most frequently reported causes were poor experiences with school exercise, coaching and physical activity in general, as well as fear of not being accepted or doing well.
|
|
Adolescentswithdisabilities (n=12) |
Adolescentswithoutdisabilities(n=8) |
Total (n=20) |
|
Doesnot like physicalexercise |
4 (33.3%) |
0 (0.0%) |
4 (20.0%) |
|
Excercise is not useful |
5 (41.7%) |
1 (12.5%) |
6 (30.0%) |
|
No time for excercise |
5 (41.7%) |
2 (25.0%) |
7 (35.0%) |
|
Disability or disease prevents |
6 (50.0%) |
0 (0.0%) |
6 (30.0%) |
|
Too competitive |
4 (33.3%) |
0 (0.0%) |
4 (20.0%) |
|
Too expensive |
6 (50.0%) |
1 (12.5%) |
7 (35.0%) |
|
Bad experiences from school exercise |
9 (75.0%) |
0 (0.0%) |
9 (45.0%) |
|
Bad experiences of coaching |
8 (66.7%) |
0 (0.0%) |
8 (40.0%) |
|
Bad experiences in general |
8 (66.7%) |
0 (0.0%) |
8 (40.0%) |
|
No guided excersice avalaible |
4 (33.3%) |
0 (0.0%) |
4 20.0%) |
|
Not physicall ygifted |
3 (25.0%) |
0 (0.0%) |
3 (15.0%) |
|
No knowledge about the sites |
8 (66.7%) |
1 (12.5%) |
9 (45.0%) |
|
Possibilities for exercise are too far from home |
7 (58.3%) |
0 (0.0%) |
7 (35.0%) |
|
No hobby mate |
5 (41.7%) |
1 (12.5%) |
6 (30.0%) |
|
No coach |
6 (50.0%) |
0 (0.0%) |
6 (30.0%) |
|
Fear of not doing well |
7 (58.3%) |
2 (25.0%) |
9 (45.0%) |
|
Fear of not being accepted |
9 (75.0%) |
2 (25.0%) |
11 (55.0%) |
|
Other reason |
0 (0.0%) |
0 (0.0%) |
0 (0.0%) |
Although the margin of error for such a small number of respondents (n = 20) is large, since repeating the same question to new respondents could result in significant differences, thematically the same causes of physical inactivity among adolescents with disabilities have been found in other studies. In a systematic literature review, [9] categorized environmental and personal factors as causes of inactivity with disabled children and adolescents. These were linked to individuals' functional ability, forms of physical activity and participation. It would be possible to classify the results of our own research in the same way and build a more accurate research setting on non-exercise. The small questionnaire data available for reasons of non-exercise may serve mainly as an indicative pilot for further research.
Bullying and inappropriate treatment in exercise
More than one in two (57%) of adolescents with disabilities reported having experienced bullying during exercise, while less than one fifth of adolescents without disabilities (17%, see Table 5).
|
|
Adolescents with disability |
Adolescents without disability |
Total |
|
Not experienced |
27 (43.5%) |
192 (83.5%) |
219 (75.0%) |
|
Has experienced sometimes or often |
35 (56.5%) |
38 (16.5%) |
73 (25.0%) |
|
Total |
62 (100%) |
230 (100%) |
292 (100%) |
|
Chi square: 41.50, p<.001 |
|||
There has been much research on bullying and inappropriate treatment of people with disabilities, in particular violence and sexual abuse against people with disabilities. Based on the results of the Finnish School Health Survey 2008-2017 of the National Institute for Health and Welfare (THL), it appears that functional limitation or disability among adolescents is one of the main causes of bullying and discrimination [26]. Comparison of bullying between adolescents with and without disabilities has not been made in this report, but it is expected that adolescents with disabilities are more likely to be bullied and discriminated against than adolescents without disabilities, as adolescents with disabilities are one of the four most bullied group. Other groups that are most bullied include adolescents with a foreign background, placed adolescents and adolescents whose mothers have a low education level.
The appearance of bullying and inappropriate treatment
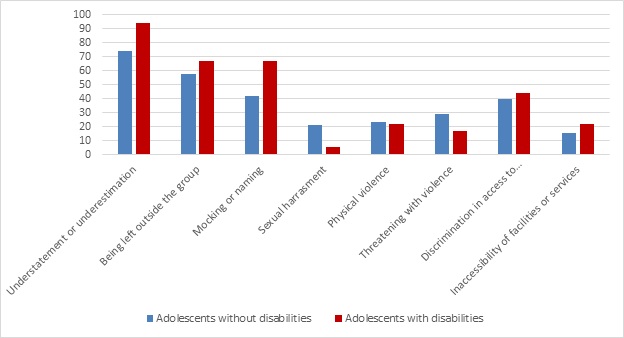
Most often, adolescents had experienced understatement, underestimation, exclusion, mocking and naming (see Figure 3). These forms of bullying and inappropriate treatment were also more common in the group of adolescents with disabilities, but the differences between the groups were not statistically significant due to the small number of respondents.

A study [27] on discrimination experienced by children and adolescents also identified forms of discrimination faced by children and adolescents with disabilities. The most common experiences of children and adolescents with functional limitations or disabilities in discrimination were naming, prejudice and exclusion. In practice, the same themes of bullying and inappropriate treatment become significant experiences in our study of adolescents with disabilities. Comparing the experiences of bullying and inappropriate treatment of adolescents with and without disabilities, it can be noted that although adolescents without disabilities experience less bullying and inappropriate treatment, but the trends of bullying and inappropriate treatment are quite similar, except in the cases sexual harassment and threats of violence.
CONCLUSIONS
The difference in the measured variables describing the physical activity of adolescents with disabilities compared to the corresponding physical activity parameters of adolescentswithout disabilities explains, on the one hand, the differences in physical activity between these groups as social situations and on the other hand the motivational factors of physical activity. Statistically, adolescents with disabilities engage in physical activity more often on their own and with their parents and in clubs other than sports clubs. This may mean that participation in peer life is lower foradolescents with disabilities than for adolescents without disabilities.
Comparison of the motivation factors of physical activity also supports this interpretation. For adolescents without disabilities as a motivator for physical activity, time with friends, good fitness and self-development are statistically more significant than for adolescents without disabilities. For adolescents with disabilities, the motivation factors for "momentum to win" and "professionalism" that may be associated with momentary pleasure are statistically more significant than for adolescents without disabilities. In our comparison, non-exercise also appears different in these groups.
Adolescents with disabilities experienced more bullying and inappropriate treatment than adolescents without disabilities, but the experiences of bullying were almost similar. In the context of the UN CRPD definition of disability, the study reinforced the notion of the changing meaning of disability in different contexts. In some cases, the disability played a role in relation to social situations in exercise and in some cases did not. Examining the physical activity of people with disabilities reveals the conditions for participating in physical activity: which promote and which restrict or reduce participation in physical activity.
Further research could be on the structural and individual level studies of physical activity. Structural factors may include the conditions for access to physical activity, such as the available physical exercise facilities and equipment, assistants and appropriate times. Individual level research on physical activity could focus more specifically on inclusion and participation as well as on economic issues.
As a separate sample, the survey of adolescentswith disabilities based on register data and social media can serve as a separate study only. More comprehensive comparative approaches on leisure time for people with and without disabilities could also be developed for research data. Clearly, a functional limitation categorization question fails to identify people with disabilities from the questionnaire, since people with disabilities may feel they have no any functional limitations. We also found this in this study. Therefore, people with disabilities should be included in various national surveys, and disability issues should be included in the questionnaires. Leisure research for adolescents could include disability questions, or alternatively, based on population register data, the same or applied questionnaire could be conducted with adolescents with disabilities as well as with non-disabled adolescents.
REFERENCES
- EU disability statistics.
- EU-SILC Database.
- WHO Disabilities.
- UNCRPD.
- Krahn GL, Walker DK, Correa-De-Araujo R (2015) Persons with disabilities as an unrecognized health disparity population. Am J Public Health 105: 198-206.
- Gissler M (2014) Näkymättömät lapset tilastoilla näkyviksi.
- Vesala H, Teittinen A, Kaikkonen R (2014) Vammaispalveluja tarvitsevien kotitalouksien koettu taloudellinen tilanne vuonna 2013 -ATH-tutkimuksen tuloksia. Terveyden ja hyvinvoinnin laitoksen työpapereita 37/2014, 45-48.
- Maher CA, Toohey M, Ferguson M (2016) Physical activity predicts quality of life and happiness in children and adolescents with cerebral palsy. Disabil Rehabil 38: 865-869.
- Bloemen MA, Backx FJ, Takken T, Wittink H, Benner J, et al. (2014) Factors associated with physical activity in children and adolescents with a physical disability: a systematic review. Dev Med Child Neurol 57: 137-148.
- Shields N, Synnot A (2016) Perceived barriers and facilitators to participation in physical activity for children with disability: a qualitative study. BMC Pediatrics 16: 1-10.
- Oppewal A, Hilgenkamp TIM, Schäfer Elinder L, Freiberger E, Rintala P, et al. (2018) Correlates of Sedentary Behaviour in Adults with Intellectual Disabilities-A Systematic Review. Int J Environ Res Public Health1 5: 10 2274.
- van Asselt-Goverts AE, Embregts PJ, Hendriks AH, Wegman KM, Teunisse JP (2015) Do social networks differ? Comparison of the social networks of people with intellectual disabilities, people with autism spectrum disorders and other people living in the community. J Autism Dev Disord 45: 1191-1203.
- Mithen J, Aitken Z, Ziersch A, Kavanagh AM (2015) Inequalities in social capital and health between people with and without disabilities. Social Science & Medicine 126: 26-35.
- Hakanen T, Myllyniemi S, Salasuo M(toim.) (2019) Oikeus liikkua. Lasten ja nuorten vapaa-aikatutkimus 2018. Valtion liikuntaneuvoston julkaisuja 2019.
- Turpeinen S, Hakamäki M (2018) Liikunta ja tasa-arvo 2017. Katsaus sukupuolten tasa-arvon nykytilaan liikunta-alalla. Opetus- ja kulttuuriministeriön julkaisuja 2018: 6.
- Nuzzo JL (2019) Equity in Physical Activity: A Misguided Goal. Sports Medicine 49: 501-507.
- Kokko S, Mehtälä A(toim.) (2016) Lasten ja nuorten liikuntakäyttäytyminen Suomessa. LIITU-tutkimuksentuloksia 2016. Valtionliikuntaneuvostonjulkaisuja 2016: 4.
- Ng K, Rintala P, Saari A, Leppä N, Kokko S (2018) Toimintarajoitteita kokevien nuortenliikunta- ja urheiluseura-aktiivisuus sekä istumisen määrä. Liikuntajatiede 55: 103-110.
- Tyagi A, Mattu S (2015) A survey of disabled persons about their physical activity. International Journal on Disability and Human Development 15: 29-36.
- Nem?ek D (2017) Self-esteem in people with physical disabilities: differences between active and inactive individuals. Acta Facultatis Educationis Physicae Universitatis Comenianae 57, 1/2017.
- Saari A (2011) Inkluusion nosteet ja esteet liikuntakulttuurissa. Tavoitteena kaikille avoinliikunnallinen iltapäivätoiminta. Jyväskylän yliopisto. Studies in Sport, Physical Education and Health 174.
- Powrie , Kolehmainen N, Turpin M, Ziviani J, Copley J (2015) The meaning of leisure for children and young people with physical disabilities: a systematic evidence synthesis. Dev Med Child Neurol 57: 993-1010.
- Runswick-Cole K, Goodley D (2013) Resilience: a disability studies and community psychology approach. Social and Personality Psychology Compass 7: 67-78.
- International Classification of Functioning, Disability and Health (ICF) 2018.
- Smith EM, Sakakibara BM, Miller WC (2016) A review of factors influencing participation in social and community activities for wheelchair users. Disabil Rehabil Assist Technol 11: 361-374
- Halme N, Hedman L, Ikonen R, Rajala R (2018) Lasten ja nuorten hyvinvointi 2017-Kouluterveyskyselyn tuloksia. THL:nTyöpaperi 15/2018.
- Kankkunen P, Harinen P, ja Mari Tapio EN (2010) Kuka ei kuulu joukkoon? Lasten ja nuorten kokema syrjintä Suomessa. Helsinki: Sisäasiainministeriön julkaisuja 36/2010.
Citation: Teittinen A, Vesala HT (2019) Comparison of Physical Activity between Children and Adolescents with and without Disabilities in Finland. Sport Med Inj Care 1: 003.
Copyright: © 2019 Antti Teittinen, et al. This is an open-access article distributed under the terms of the Creative Commons Attribution License, which permits unrestricted use, distribution, and reproduction in any medium, provided the original author and source are credited.

