Contribution of Climate Change to Soil Carbon and Nitrogen Storages in Three Parent Materials in Akwa Ibom State, Nigeria
*Corresponding Author(s):
I D EdemDepartment Of Soil Science And Land Resources Management, University Of Uyo, Uyo, Nigeria
Tel:+234 8027031426,
Email:dennis.edem@gmail.com
Abstract
Most agricultural soils contain only a small proportion of carbon and nitrogen, but this small amount plays a very large role in soil quality. However, the estimation of carbon and nitrogen storages in rain forest area of Nigeria has not been adequately documented. A study was conducted to examine the effects of climate change on the Carbon and Nitrogen storages of soils derived from Coastal Plain Sands (CPS), Beach Ridge Sands (BRS) and Sand Stone/Shale (SSS) parent materials in Akwa Ibom State. Secondary soil data of organic carbon, and bulk density as well as climatic data of 2004 to 2014 were used. Organic C stock and SON were calculated as product of soil organic carbon (or total N) contents, bulk density and soil depth. Data were analysed using descriptive statistics, regression analysis and ANOVA at α0.05. Organic C stocks on the surface (0-15 cm) soil depth were 44.13±15.91, 43.89±17.39 and 52.40±18.02 Mg C ha-1 for CPS, BRS and SSS, respectively. The corresponding values for subsurface depth (15-30 cm) were 28.30±9.58, 24.83±8.93 and 26.37±5.74 Mg C ha-1. However, N stocks at 0-15 cm soil depth were 3.37±0.90, 3.19±0.94 and 3.56±1.00 Mg N ha-1 for CPS, BRS and SSS, respectively. Whereas in the 15-30 cm soil depth, SON were 2.07±0.55, 2.00±0.58 and 2.04±0.56 Mg N ha-1 for the respective parent materials. Highly significant SOC stock of 78.90 Mg C ha-1 occurred in 2005 in SSS, while the least stock of 23.71 Mg C ha-1 occurred in 2007 CPS. Across the parent materials, organic C stocks increased as rainfall decreases. Whereas, N stocks increased with decrease in relative humidity. Change in climate significantly affected soil organic carbon and nitrogen storages in Uyo, Nigeria.
Keywords
Carbon and nitrogen stocks, Climate change, Parent materials, Rainfall
INTRODUCTION
Soils with greater silt and clay content typically have greater SOC stocks due to physical protection of organic minerals [8,9]. Climate change scenarios predict a 2.2°C to 3.6°C (4°F to 6.5°F) increase in temperature and increased variability in precipitation across most of the United States by 2040 to 2059 according to Marschner et al., , will likely alter the distribution and composition of plant biomass. Initial plant responses to changes in temperature and CO2 observed by Hinzman may not reflect long-term SOC dynamics since increased plant C inputs can lead to increased decomposition [10,11].
In Nigeria, it is obvious that climate change is equally resulting in variations in temperature and precipitations with its attendant effects on the vegetation [12]. However, evidence of the effects of changes in SOC and SON stocks documentation such as those ascribed to climate change in Ultisol is scanty. This study therefore, attempts to examine the effects of climate change on the soil organic carbon and nitrogen storage of soils on three parent materials in Akwa Ibom State, Nigeria over a ten-year period.
MATERIALS AND METHODS
Site information
Vegetation and land use
Data collection
Procedure for determining Soil Organic Carbon (SOC) stock
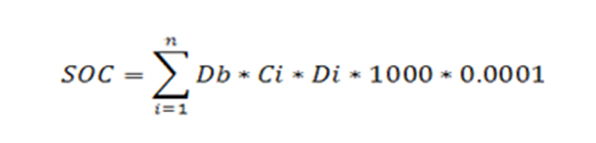
Procedure for determining Soil Nitrogen (SON) Stock

Statistical analysis
RESULTS AND DISCUSSION
Mean bulk density (BD) on the surface soil of CPS, BRS and SSS were 1.47±0.05, 1.46±0.07 and 1.56±0.05 Mg m-3, respectively. The corresponding values in the sub surface were 1.59±0.06, 1.58±0.05 and 1.66±0.04 Mg m-3, (Table 1). The trend of soil compaction on both soil surfaces among the three parent materials was SSS > CPS > BRS. The shale which associated with sandstone consistently characterised with high bulk density. Relatively, bulk density was moderately high on the surface soil compared with subsurface depth. This according to Agbede and Hamarshid is attributed to the organic matter content on the surface soil that promotes good soil aggregation, thus lowering bulk density of the soil [20-23].
|
Year |
Bulk Density (Mg m-3) |
|||||
|
0 - 15 cm |
15 - 30 cm |
|||||
|
CPS |
BRS |
SSS |
CPS |
BRS |
SSS |
|
|
2004 |
1.43 |
1.48 |
1.53 |
1.58 |
1.57 |
1.59 |
|
2005 |
1.43 |
1.53 |
1.58 |
1.69 |
1.62 |
1.62 |
|
2006 |
1.51 |
1.46 |
1.57 |
1.56 |
1.66 |
1.66 |
|
2007 |
1.55 |
1.38 |
1.58 |
1.68 |
1.55 |
1.63 |
|
2008 |
1.48 |
1.45 |
1.49 |
1.55 |
1.52 |
1.71 |
|
2009 |
1.54 |
1.45 |
1.47 |
1.61 |
1.56 |
1.64 |
|
2010 |
1.42 |
1.36 |
1.56 |
1.52 |
1.49 |
1.69 |
|
2011 |
1.46 |
1.57 |
1.57 |
1.59 |
1.62 |
1.66 |
|
2012 |
1.45 |
1.53 |
1.58 |
1.57 |
1.59 |
1.64 |
|
2013 |
1.38 |
1.48 |
1.61 |
1.54 |
1.56 |
1.71 |
|
2014 |
1.52 |
1.33 |
1.66 |
1.63 |
1.65 |
1.7 |
|
Mean |
1.47 |
1.46 |
1.56 |
1.59 |
1.58 |
1.66 |
|
SD |
0.05 |
0.07 |
0.05 |
0.06 |
0.05 |
0.04 |
|
CV |
3.7 |
5.1 |
3.4 |
3.5 |
3.4 |
2.4 |
|
Years |
Organic Carbon (g kg-1) |
|||||
|
0 - 15 cm |
15 - 30 cm |
|||||
|
CPS |
BRS |
SSS |
CPS |
BRS |
SSS |
|
|
2004 |
13.04 |
15.23 |
23.57 |
9.46 |
7.45 |
10.38 |
|
2005 |
24.67 |
20.56 |
33.29 |
14.57 |
15.83 |
7.13 |
|
2006 |
15.65 |
16.23 |
32.44 |
12.25 |
7.45 |
12.55 |
|
2007 |
10.2 |
34.32 |
20.45 |
9.21 |
16.98 |
11.34 |
|
2008 |
28.22 |
18.48 |
18.55 |
18.2 |
11.67 |
14.13 |
|
2009 |
15.21 |
12.98 |
14.87 |
7.43 |
5.78 |
9.33 |
|
2010 |
27.49 |
15.34 |
31.39 |
20.6 |
10.33 |
10.64 |
|
2011 |
22.9 |
32.13 |
16.74 |
11.5 |
14.33 |
13.12 |
|
2012 |
33.23 |
26.34 |
10.75 |
8.76 |
7.49 |
7.33 |
|
2013 |
16.9 |
13.67 |
18.89 |
9.89 |
8.83 |
10.34 |
|
2014 |
13.87 |
14.56 |
24.23 |
8.95 |
9.12 |
10.03 |
|
Mean |
20.13 |
19.99 |
22.29 |
11.89 |
10.48 |
10.57 |
|
SD |
7.5 |
7.57 |
7.48 |
4.23 |
3.76 |
2.19 |
|
CV% |
37.3 |
37.9 |
33.9 |
35.5 |
35.9 |
20.7 |
|
Year |
Total Nitrogen (g kg-1) |
|||||
|
0 - 15 cm |
15 - 30 cm |
|||||
|
CPS |
BRS |
SSS |
CPS |
BRS |
SSS |
|
|
2004 |
1.38 |
1.43 |
1.89 |
0.91 |
0.67 |
0.82 |
|
2005 |
1.21 |
2.22 |
1.05 |
0.84 |
0.83 |
0.59 |
|
2006 |
1.1 |
1.26 |
1.43 |
0.69 |
1.34 |
0.66 |
|
2007 |
2.32 |
1.06 |
2.33 |
1.21 |
0.88 |
1.43 |
|
2008 |
1.33 |
1.38 |
1.08 |
0.88 |
0.76 |
0.62 |
|
2009 |
1.32 |
1.37 |
1.26 |
0.68 |
0.79 |
0.83 |
|
2010 |
1.36 |
1.22 |
1.45 |
0.66 |
0.69 |
0.69 |
|
2011 |
2.01 |
2.02 |
1.52 |
1.32 |
1.17 |
0.89 |
|
2012 |
1.55 |
1.54 |
1.19 |
0.78 |
0.77 |
0.71 |
|
2013 |
2.01 |
1.23 |
2.04 |
0.83 |
0.66 |
0.89 |
|
2014 |
1.25 |
1.18 |
1.42 |
0.71 |
0.68 |
0.88 |
|
Mean |
1.53 |
1.45 |
1.51 |
0.86 |
0.84 |
0.82 |
|
SD |
0.4 |
0.36 |
0.41 |
0.22 |
0.22 |
0.23 |
|
CV |
26 |
24.9 |
27 |
25 |
26.2 |
28.2 |
Organic C content of 20.13±7.50, 19.99±7.59 and 22.29±7.48 gkg-1 on the surface soil of CPS, BRS and SSS were significantly higher compared to 11.89±4.23, 10.48±3.76 and 10.57±2.19 gkg-1 in the subsurface soil, respectively. The corresponding values for soil nitrogen content were 1.53±0.40, 1.45±0.36 and 1.51±0.41 gkg-1 on the surface, while soil nitrogen content in the subsurface were 0.86±0.22, 0.84±0.22 and 0.82±0.23 gkg-1, respectively. However, SSS parent material recorded significantly high SOC than the other parent materials on the surface, whereas high SOC in the subsurface was noticed in CPS parent material. This result is consistent with the earlier report of Bai et al., on soil organic carbon stock changes at varying depths [24]. Organic carbon was highly varied (>35%) in both the 0 - 15 and 15 - 30 cm soil depths of CPS and BRS, but moderately varied in both depth of SSS. Harris et al., [25] noted this high variable distribution of SOC at the field scale both horizontally and vertically. Accordingly, level of SOC variability was attributed to differences in vegetative cover, geomorphic soil position and thermal diffusivity of the soil.
ANNUAL TRENDS OF CLIMATIC ELEMENTS IN AKWA IBOM STATE FROM
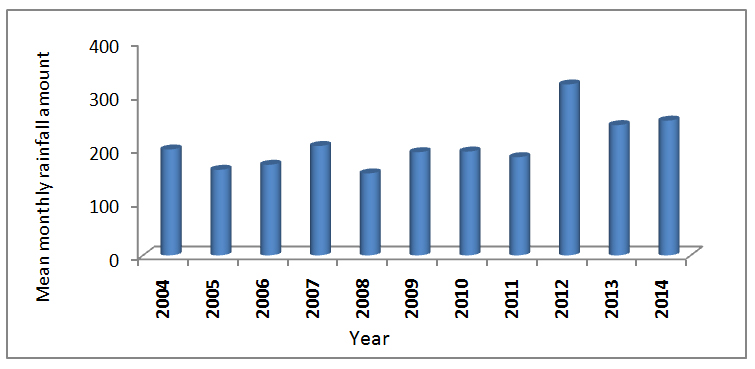 Figure 1: Monthly rainfall pattern in Akwa Ibom State (2004 - 2014).
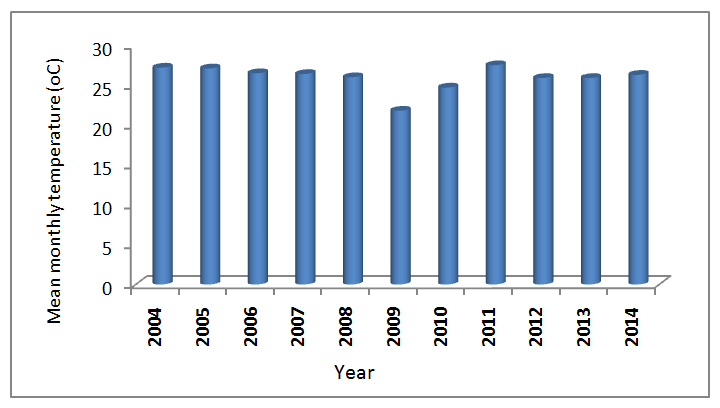 Figure 2: Monthly temperature variations in Akwa Ibom State (2004 - 2014).
On the other hand, high annual temperature above 26.5°C was constantly recorded between 2004 and 2008. Conversely, the high temperature regime dropped to 21.8°C in 2009 and subsequently increased above 26°C in 2010 and climaxed at 27.5°C in 2011. From the forgoing, year 2011 was the hottest period and the peak period for water demand for decomposition of organic materials.
Organic C stocks of 44.13±15.91, 43.89±17.39 and 52.40±18.02 Mg C ha-1on the surface soil depth of CPS, BRS and SSS, respectively, were significantly higher than 28.30±9.58, 24.83±8.93 and 26.37±5.74
Mg C ha-1 recorded in the subsurface soil depth (Table 4). On the surface soil, organic C stocks decreased in the order of SSS > CPS > BRS. Whereas, in the subsurface depth, it decreased in the order of CPS > SSS > BRS. Consistently, BRS stored the lowest C content in the soil. According to Hashamoto et al., differences in biomass production, cropping systems, land use types and soil types could greatly contribute to the variation in SOC stock at an annual time scale [26].
|
Year |
Organic Carbon Storage (Mg C ha-1) |
|||||
|
0 - 15 cm |
15 - 30 cm |
|||||
|
CPS |
BRS |
SSS |
CPS |
BRS |
SSS |
|
|
2004 |
27.98 |
33.81 |
54.09 |
22.42 |
17.54 |
24.75 |
|
2005 |
52.92 |
47.19 |
78.9 |
36.95 |
38.47 |
17.33 |
|
2006 |
35.45 |
35.54 |
76.4 |
28.66 |
18.55 |
31.25 |
|
2007 |
23.72 |
71.04 |
48.47 |
23.21 |
39.48 |
27.73 |
|
2008 |
62.66 |
40.19 |
41.46 |
42.32 |
26.61 |
36.25 |
|
2009 |
35.14 |
28.23 |
32.79 |
17.94 |
13.53 |
22.95 |
|
2010 |
58.55 |
31.29 |
73.45 |
46.97 |
23.09 |
26.98 |
|
2011 |
50.16 |
75.67 |
39.42 |
27.43 |
34.82 |
32.67 |
|
2012 |
72.27 |
60.45 |
25.48 |
20.64 |
17.86 |
18.03 |
|
2013 |
34.98 |
30.35 |
45.62 |
22.85 |
20.66 |
26.52 |
|
2014 |
31.62 |
29.05 |
60.33 |
21.88 |
22.57 |
25.58 |
|
Mean |
44.13 |
43.89 |
52.4 |
28.3 |
24.83 |
26.37 |
|
SD |
15.91 |
17.39 |
18.02 |
9.58 |
8.93 |
5.74 |
|
CV |
36.05 |
39.62 |
34.38 |
33.86 |
35.97 |
21.77 |
Similarly, total N stocks of 3.37±0.90, 3.19±0.94 and 3.56±1.00 Mg N ha-1 on the surface soil depth of CPS, BRS and SSS, respectively, were significantly higher than 2.07±0.55, 2.00±0.58 and 2.04±0.56 Mg N ha-1recorded in the subsurface soil depth of the corresponding parent material (Table 5). Total N stocks in the 0 - 15 cm depth decreased in the order of SSS > CPS > BRS while in the 0 - 30 cm depth, it decreased from CPS > SSS > BRS. The highest total N stocks of 5.22 Mg N ha-1 recorded on the surface soil of SSS was in 2007, while the least storage of 2.19 Mg N ha-1 was recorded in CPS of the same year (Table 5).
|
Year |
Total Nitrogen Storage (Mg N ha-1) |
|||||
|
0 - 15 cm |
15 - 30 cm |
|||||
|
CPS |
BRS |
SSS |
CPS |
BRS |
SSS |
|
|
2004 |
2.96 |
3.17 |
4.34 |
2.16 |
1.58 |
1.96 |
|
2005 |
2.6 |
5.09 |
2.49 |
2.13 |
2.02 |
1.43 |
|
2006 |
2.49 |
2.76 |
3.37 |
1.61 |
3.34 |
1.64 |
|
2007 |
5.39 |
2.19 |
5.52 |
3.05 |
2.05 |
3.5 |
|
2008 |
2.95 |
3 |
2.41 |
2.05 |
1.73 |
1.59 |
|
2009 |
3.05 |
2.98 |
2.78 |
1.64 |
1.85 |
2.04 |
|
2010 |
2.9 |
2.49 |
3.39 |
1.5 |
1.54 |
1.75 |
|
2011 |
4.4 |
4.76 |
3.58 |
3.15 |
2.84 |
2.22 |
|
2012 |
3.37 |
3.53 |
2.82 |
1.84 |
1.84 |
1.75 |
|
2013 |
4.16 |
2.73 |
4.93 |
1.92 |
1.54 |
2.28 |
|
2014 |
2.85 |
2.35 |
3.54 |
1.74 |
1.68 |
2.24 |
|
Mean |
3.37 |
3.19 |
3.56 |
2.07 |
2 |
2.04 |
|
SD |
0.9 |
0.94 |
1 |
0.55 |
0.58 |
0.56 |
|
CV |
26.66 |
29.53 |
28.1 |
26.59 |
28.79 |
27.59 |
EFFECT OF CLIMATE ON CARBON AND NITROGEN STORAGES
CONCLUSION
REFERENCES
- Cleland EE, Chuine I, Menzel A, Mooney HA, Schwartz MD (2007) Shifting Plant Phenology in Response to Global change. Trends Ecol Evol 22: 357-365.
- IPCC (International Panel on Climate Change) (2001) Impacts, Adaptation and vulnerability, Summary for Policy Makers. Cambridge University Press, Cambridge, UK.
- Emmett BA, Beier C, Estiarte M, Tietema A, Kristensen HL, et al. (2004) The Response of Soil Processes to Climate Change: Results from Manipulation Studies of Shrublands across an Environmental Gradient. Ecosystems 7: 625-637.
- Doret SH, Shkesby RA, Walsh RP (2009) Soil Water Repellency. Its Causes, Characteristics and Hydrogeomorphological Significance. Earth-Science Reviews 51: 33-65.
- Edem ID, Edem SO (2008) Insitu Erosion Variability Management under Vetiver Hedges in Alfisol Assessment of Management Control on Loss and Runoff in the Field with Multi-slot Device. LAMBERT Academic Publishing GmbH and Co., KG. Saarbrücken, Germany.
- Brady NC, Weil R (2002) The Nature and Properties of Soils (13th edn). Prentice Hall. Upper Saddle River, New Jersey, USA, Pg no: 960.
- MacDonald NW, Zak DR, Pregitzer KS (1995) Temperature Effects on Kinetics of Microbial Respiration and Net Nitrogen and Sulfur Mineralization. Soil Sci Soc Am J 59: 233-240.
- Cookson WR, Osman M, Marschner P, Abaye DA, Clark I, et al. (2007) Controls on soil Nitrogen Cycling and Microbial Community Composition across Land use and Incubation Temperature. Soil Biology and Biochemistry 39: 744-756.
- Frey SD, Lee J, Melillo JM, Six J (2013) The Temperature Response of Soil Microbial Efficiency and its Feedback to Climate. Nature of Climate Change 3: 395-398.
- Marschner B, Bredow A (2002) Temperature effects on release and ecologically relevant properties of dissolved organic carbon in sterilized and biologically active soil samples. Soil Biology and Biochemistry 34: 459-466.
- Hinzman LD (2005) Evidence and Implications of Recent Climate Change in Northern Alaska and other Arctic Regions. Climatic Change 72: 251-298.
- Watter PT (1990) Seasonal Rainfall Characteristics and daily Rainfall. Meteorology Society 88: 90-95
- Ogban PI, Ekerette (2001) Physical and Chemical Properties of the Coastal Plain Sand Soils of South-eastern Nigeria. Nigerian Journal of Soil Resources 2: 6-14.
- Hills RC, Morgan JH (1981) An Interactive Approach to the Analysis of Rainfall records for Agricultural Purposes. Experimental Agriculture17: 1-16.
- Puthen W (1994) Agriculture, Environment, Climate and Health, Sustainable Development in 21st Century. University of Minnesita Press, Mineapolis, USA.
- Hector FC, Aimee TC, Emily EA, Richard JN, Christopher WS (2009) Soil microbial community responses to multiple experimental climate change drivers. Journal of Applied and Environmental Microbiology 76: 999-1007.
- Grossman RB, Reinsch TG (2002) Bulk Density and linear Extensibility Core Method. In: Dane JH, Topp GC, (eds.). Method of Soil Analysis Part 4, Physical Methods, Madison Wisconsin, USA. Soil Science Society of America Journal 208-228.
- Bray RH, Kurtz LT (1945) Determination of Total Organic and Available forms of Phosphorus in Soils. Soil Science 59:39-45.
- Brahim N, Bernoux M, Blavet D, Gallali T (2010) Tunisian Soil Organic Carbon Stocks. International Journal of Soil Science 5: 34-40.
- Agbede OO (2009) Understanding the Soil and Plant Nutrition. Petra Digital Press, Nigeria.
- Hamarshid NH (2010) Effect of Soil Texture on Chemical Composition, Microbial Population and Carbon Mineralization in Soil. Egypt J Exp Biol 6: 59-64.
- Balser TC, Kinzig AP, Firestone MK (2005) Linking Soil Microbial Communities and Ecosystem Functioning. In: Kinzig AP, Pacala SW, Tilman D (eds.). The Functional Consequences of Biodiversity: Empirical Processand Theoretical Extensions. Princeton University Press, New Jersey, USA.
- Mbah CN, Anikwe MAN, Onweremadu EU, Mbagwu JSC (2007) Soil organic matter and carbohydrate contents of a dystric leptosol under organic waste management and their role in structural stability of soil aggregates. Int J Soil Sci 2: 268-277.
- Bai ZG, Dent DL, Olsson L, Schaepman ME (2008) Proxy global assessment of land degradation. Soil Use Manage 24: 223-234.
- Harris D, Pacovsky RS, Paul EA (1985) Carbon Economy of Soybean-rhizobuim-glomus Association. New Phytologist 101: 427-440.
- Hashamoto S, Suzuki M (2004) The impact of forest clear-cutting on soil temperature: A comparison between before and after cutting and between clear-cut and control sites. Journal of Forest Research 9: 125-132.
- Kimble JM, Follett RF, Cole CV (1998) The potential of USA cropland to sequester carbon and mitigate the greenhouse effect. Ann Arbor Press, Chelsea, MI, USA, Page no: 128.
Citation: Edem ID (2019) Contribution of Climate change to Soil Carbon and Nitrogen Storages in Three Parent Materials in Akwa Ibom State, Nigeria. J Atmos Earth Sci 3: 008.
Copyright: © 2019 I D Edem, et al. This is an open-access article distributed under the terms of the Creative Commons Attribution License, which permits unrestricted use, distribution, and reproduction in any medium, provided the original author and source are credited.