Journal of Pulmonary Medicine & Respiratory Research Category: Medical
Type: Research Article
Correlation between Non-Gated Chest CT and Echocardiography in the Assessment of the Left Ventricle
*Corresponding Author(s):
Haneen AliDepartment Of Radiology, Harlem Hospital Center, New York, United States
Tel:+1 8622205806,
Email:aneen119@gmail.com
Received Date: Dec 15, 2017
Accepted Date: Feb 24, 2018
Published Date: Mar 13, 2018
Abstract
Objective
Left Ventricular (LV) mass and dimensions are independent predictors of morbidity and mortality. We explore the validity of non-gated chest CT in the determination of LV function with Echocardiography (ECHO).
Methods
Three radiologists independently and retrospectively reviewed contrast-enhanced, non-gated chest CT scans of patients who had also underwent recent echocardiography for the assessment of left ventricular function. Correlation was assessed between CT derived values of LV Posterior Wall Thickness (PWTCT), Septal Thickness (CT-STCT), and LV Diameter (LVDCT) with respective echocardiographic counterparts of Posterior Wall Thickness (PWTE), Septal Thickness (STE), and LV End Diastolic Dimension (LVEDD) Correlation between CT and echocardiographic derivations of LV mass (LVMCT and LVME) was also made. The Cardiothoracic Ratio (CTR) on CT was correlated with the echocardiographic parameters of LV function, LVEDD, LVME and LV Ejection Fraction (EF).
Results
Thirty patients underwent 42 contrast enhanced chest CT scans. The median time between CT and echocardiography was 90 days (range 0-358 days, median 44 days). There was weak correlation between PWTCT and PWTE (r=0.21, P=0.028) and STCT and STE (r=0.25, P=0.01). However, there was strong positive correlation between LVEDD on echocardiography and LVDCT (r=0.76, p<0.001). There was moderate correlation between echocardiographic and CT derivations of LVM (r=0.54, P<0.001). Finally, CTR correlated weakly with LVEDD (r=0.33, P<0.01) and also weakly with LVME (r=0.35, P<0.01). There was poor but negative correlation between CTR and estimated EF, r=-0.41 (P<0.01).
Conclusion
Our results indicate that non-gated chest CT is not a valid modality in evaluating left ventricular function, either by LV parameters or CTR.
Keywords
Cardiothoracic ratio; Echocardiography; Left Ventricular End Diastolic Dimension (LVEDD); Left ventricular function; Non-gated chest CT
INTRODUCTION
Left Ventricular (LV) volume and wall thickness are important predictors of LV performance. Cardiac chamber dimensions, ventricular function, and myocardial mass are important criteria in the management of patients with cardiac disease, and are routinely determined by echocardiography [1-4].
ECG-gated cardiac contrast-enhanced Multi Detector Computed Tomography (MDCT) measurements of LV size and function on a global and regional basis have been shown to be in excellent agreement with MRI [5-14]. However, gated cardiac CT is not routinely performed, and higher level of expertise compared to non-gated chest CT [15]. Non-gated chest CT may be able to provide a simpler and quicker assessment of LV size and function, but has not been well established in the literature [16]. Non-gated chest CT, performed for a large variety of indications (most often to assess the lung parenchyma and for pulmonary embolism and aortic aneurysm/dissection) may be able to provide an initial assessment of LV size and function, but this capability has not been well established in the literature [17]. Cardiothoracic ratio itself has also been debated as a useful evaluator of cardiac function. Although CTR on chest radiograph has been widely advocated in many textbooks, its accuracy in the assessment of left ventricular function and its role as a predictor of mortality is questionable [18-20].
This study examines the validity of non-gated CT quantification of left ventricular anatomic parameters and cardiothoracic ratio, using echocardiography as the standard of reference. In particular, we correlate [1] CT values of LV Posterior Wall Thickness (PWTCT), interventricular Septal Thickness (-STCT), and LV short axis diameter (LVDCT) with echocardiographic measurements of LV Posterior Wall Thickness (PWTE), Septal Thickness (STE), and LV End Diastolic Dimension (LVEDD), respectively [2] echocardiographic and CT estimates of LV Mass (LVMCT and LVME); and [3] CTR on CT with LV function parameters of LVEDD, LVME and LV Ejection Fraction (EF) determined on echocardiography.
METHODS
This retrospective study was approved by the institutional review board.
Study population
A database of patients who underwent echocardiography in the past year was cross-referenced with the hospital radiology information system to identify patients who also underwent chest CT with intravenous contrast within a one year time frame.
Non-gated contrast enhanced chest CT
Contrast-enhanced (iohexol or iodixanol, GE Healthcare, Buckinghamshire, United Kingdom) chest CT was obtained from the thoracic inlet to the adrenal glands during a single breath-hold using a 16-detector-row scanner (Philips Brilliance, Healthcare, Andover, Massachusetts). A standard dose of 100 ml of iodinated contrast was injected through a peripheral or central venous catheter. CT scans performed for suspected pulmonary embolism or aortic anomaly were acquired with 1-2 mm collimation with contrast injection (EZ-EM automatic injector, Bracco Diagnostics, Monroe Township, New Jersey) of 3-5 ml/sec and bolus tracking technique to achieve maximum of the thoracic vasculature. CT scans performed to assess lung parenchyma were acquired with 3-5 mm collimation with contrast injection of 2-3 ml/sec and a standard imaging delay of 30 seconds.
Echocardiography
Transthoracic echocardiography was performed with patients in the left lateral decubitus position by using an iE33 (Philips Medical Systems, Eindhoven, The Netherlands) system equipped with a 3.5 MHz transducer. All examinations included B-and M-mode echocardiography combined with color Doppler imaging. Standardized imaging planes in the parasternal (long-and short-axis) and the apical (2 and 4-chambers) views were used for quantifying chamber dimensions, according to the guidelines for chamber quantification of the American Society of Echocardiography (ASE) recommendations [21]. All echocardiographic examinations were performed by technologists or cardiology fellows and analyzed by an attending cardiologist, with possible initial interpretation by a cardiology fellow. LV mass was calculated from echocardiographic determinants LVEDD, STE and PWTE using the ASE formula:LVM (g)=0.8 g/cm3(1.04[(LVEDD+PWT+ST)3-(LVEDD)3])+0.6 g (Foppa)Relative Wall Thickness (RWT) was calculated by the formula RWT=PWT+ST/LVEDD (Liqi)
CT Measurements
A protocol was established for the measurement of LV parameters (Figure 1). Measurements were made in the standard transverse axial plane on Fusion eFilm v. 2.0 workstations (Merge Healthcare, Chicago, Illinois). The following measurements were made on the axial image that demonstrated the largest LV chamber size. Initially the long axis of the LV chamber was defined. The LVDCT was defined as the maximum chamber diameter perpendicular to the long axis of the LV chamber (Figure 1A). STCT was measured at the mid-ventricle level, in parallel with the short axis of the LV chamber. Similarly, PWTCTand STCT were measured at the mid-ventricle level (Figure 1A). These measurements were obtained by two Radiology residents and one Radiology attending, blinded to other’s results and to the results of echocardiography. Derivations of LVMCT and RWTCT using CT data were made using the formulae noted above, using analogous CT determinants (LVDCT, PWTCT, and STCT).
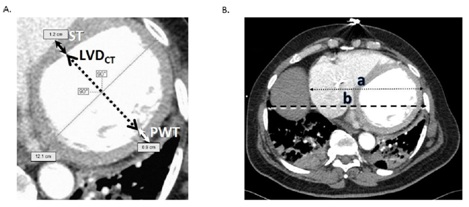
Figure 1: Cardiac measurement protocol on CT. A: Axial contrast-enhanced CT scan of the chest at the level of the right hemidiaphram apex. Cardiac slice selection was standardized for maximum diastole (largest Left Ventricular (LV) chamber slice. The protocol for the measurement of the LV short axis diameter (LVDCT, dotted line), interventricular Septal Thickness (ST, black arrows), and LV Posterior Wall Thickness (PWT, white arrows) is depicted. B: Cardiothoracic Ratio (CTR) measurement on CT. Axial contrast-enhanced CT scan of the chest at the level of the right hemidiaphragm apex. Transverse cardiac maximum diameter (dotted line) with length “a”, transverse greatest thoracic diameter (dashed line) with length “b”. The CTR is a/b..
The CTR was defined as the greatest transverse cardiac diameter from outer to outer myocardium on axial images divided by the greatest transverse thoracic diameter from inner to inner chest wall on axial images, usually near the diaphragmatic apex (Figure 1B). CTR values were compared to LVEDD, LVME, and EF determined on echocardiography. CTR measurements were made by one Radiology resident and one Radiology attending, blinded to each other’s result and to the results of echocardiography.
STATISTICAL ANALYSIS
Correlation between CT and echocardiographic parameters was evaluated using Pearson’s correlation coefficient (r). Inter-observer variability was also tested using Pearson’s correlation coefficient (r). Analysis was performed using SPSS version 14.0 (IBM, Armonk, New York). The threshold of acceptable probability (P) of type I error was set at 0.05.
RESULTS
Over a 12-months period, 30 patients (9 males, 21 females; age range 29-93 years; mean age 63 years) underwent 42 contrast-enhanced chest CT scans, also having undergone echocardiography within the same 12 months period. Mean time between echocardiography and CT was 90 days (range 0-358 days, median 44 days). Seventeen of 42 CT scans were performed with angiographic technique. Correlation data are summarized in tables 1-3.
Left ventricular posterior wall thickness, septal thickness, and relative wall thickness
The mean PWTE was 1.0 (range 0.6-1.4 cm) and the mean PWTCT was 1.1 cm (range 0.5-2.5 cm). The mean STE was 1.0 cm (range 0.6-1.4 cm) and the mean STCT was 1.3 cm (0.7-1.9 cm). Weak correlation between echocardiography and CT was seen with both parameters, with r=0.21 (P=0.028) for PWT and r=0.25 (P=0.01) for ST. Inter-observer correlation coefficients were 0.54 (P<0.01), 0.38 (P=0.04), and 0.42 (P<0.01) for PWTCT measurements; and 0.95, 0.60, and 0.64 for STCT measurements (P=0<0.01). In addition, PWTE, PWTCT, STE and STCT showed no significant correlation with LVME (Table 1).
| LVMCT | 0.54 (P<0.001) |
| PWTE | 0.19 (P=0.224) |
| PWTCT | 0.10 (P=0.313) |
| STE | 0.17 (P=0.271) |
| STCT | 0.11 (P=0.257) |
| RWTE | -0.44 (P<0.01) |
| RWTCT | -0.33 (P<0.001) |
| CTR | 0.35 (P<0.01) |
LVMCT-LV Mass determined on CT; PWTE-Posterior Wall Thickness (PWT) measured on echocardiography;
PWTCT-PWT measured on CT; STE-Septal Thickness (ST) measured on echocardiography; STCT-ST measured on CT; RWTE-Relative Wall Thickness (RWT) measured on echocardiography; RWTCT, RWT measured on CT; CTR-Cardiothoracic Ratio.
Relative Wall Thickness values derived from echocardiography (RWTE) ranged from 0.2-0.7, with a mean of 0.4. On CT, RWTCT ranged from 0.2-2.0, with a mean of 0.6. RWTCT demonstrated moderate correlation with RWTE, with r=0.53 (P<0.001). Relevant data are depicted in figure 2.
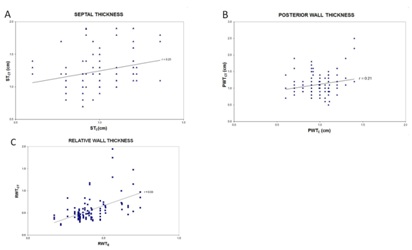 Figure 2: Septal Thickness (ST), Posterior Wall Thickness (PT) and Relative Wall Thickness (RWT), correlation between CT and echocardiography. A: PWTCT and PWTE correlated weakly. Pearson’s correlation coefficients (r) are depicted. B: STCT and STE also demonstrated weak correlation. Trendlines are depicted. C: RWTCT and RWTE demonstrated moderate correlation.
RWTE correlated poorly with echocardiographically-derived LVME and EF, r=-0.44 (P=0.004) and r=-0.36 (P<0.001), respectively. RWTCT showed similar poor correlation with LVME and EF, r=-0.33 (P<0.001) and r=0.36 (P<0.001), respectively (Table 2).
| PWT | 0.21 (P=0.028) |
| ST | 0.25 (P=0.01) |
| RWT | 0.53 (P<0.001) |
| LV diameter | 0.76 (P<0.001) |
| LV mass | 0.54 (P<0.001) |
CT left ventricular diameter
The average LVEDD on echocardiography was 5.0 cm (range 3.4-6.9 cm), and average LVDCT measurement was 4.6 cm (range 1.9-8.7 cm). There was strong positive correlation between these parameters, with r=0.76 (P<0.001) (Figure 3), and r>0.74 for each individual observer. Inter-observer correlation coefficients were 0.92, 0.96, and 0.94 (P<0.01). There was a moderate negative correlation between LVEDD and estimated EF on echocardiogram, r=-0.66 (P=0.001), and a slightly weaker albeit moderate correlation between LVDCT and EF, r=-0.61 (P<0.001) (Table 3).
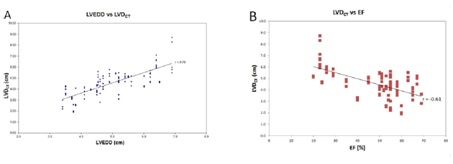 Figure 3: Echocardiographic Left Ventricular End Diastolic Dimension (LVEDD) and LV Diameter on CT (LVDCT) correlation. A: Positive correlation between LVDCT and LVEDD. B: Negative correlation between LVDCT and EF. Trendlines are depicted..
| LVEDD | -0.60 (P=0.001) |
| LVDCT | -0.61 (P=0.001) |
| LVME | -0.66 (P<0.001) |
| LVMCT | -0.54 (P<0.001) |
| RWTE | -0.36 (P<0.001) |
| RWTCT | -0.36 (P<0.001) |
| CTR | -0.41 (P <0.01) |
LVEDD-LV End Diastolic Dimension measured on echocardiography; LVDCT-LV Diameter measured on CT; LVME-LV Mass measured on echocardiography; LVMCT-LV Mass measured on CT; RWTE-Relative Wall Thickness (RWT) measured on echocardiography; RWTCT-RWT measured on CT; CTR-Cardiothoracic Ratio.
Left ventricular mass
The average LVM measured on echocardiography was 187.1 g (range 107.6-328.8 g) and 210.0 g (range 63.0-551.3 g) on CT. There was moderate correlation between LVME and LVMCT estimates, with r=0.54 (P<0.001) (Figure 4). LVME Estimates correlated strongly with LVEDD, r=0.8 (P<0.001) and with EF, r=-0.66 (P<0.001). However, LVMCT showed weaker but moderate correlation with EF, r=-0.54 (P<0.001) (Table 1 and 3).
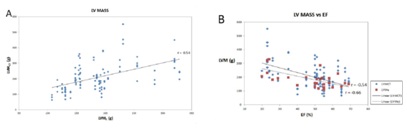 Figure 4: Left ventricular myocardial mass correlation. A: Moderate positive correlation between LV Mass measured on CT (LVMCT) and on echocardiography (LVME). B: LV mass measured on each modality plotted against EF. Trendlines are depicted..
Cardiothoracic ratio
Inter-observer variability for CTR measurements was moderate, with r=0.68 (P<0.01). CTR correlated weakly with LVEDD with r= 0.33 (P<0.01). There was also weak correlation between CTR and LVME, with r=0.35 (P<0.01). There was poor but negative correlation between CTR and estimated EF, r=-0.41 (P<0.01) (Table 1 and Figure 5).
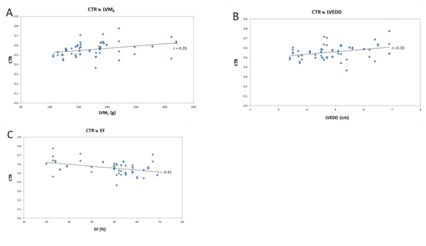 Figure 5: Cardiothoracic Ratio (CTR) and Left Ventricular (LV) parameters. A: CTR correlated weakly with LV Mass determined by echocardiography (LVME). B: There was similar weak correlation between CTR and LV End Diastolic Dimension (LVEDD). C: Weak correlation between CTR and LV Ejection Fraction (EF). Trendlines are depicted.
DISCUSSION
Heart disease is the leading cause of death in the United States; a simple method of initial measurement on the commonly performed non-gated CT of the chest may therefore be of utility [22]. Our results, confirm that LV and CTR parameters on non-gated contrast enhance chest CT are not valid criterion for the evaluation of left ventricular hypertrophy and function as compared to ECHO. Only moderate or poor correlation was seen between all parameters. Strong correlation was only noted between CT-LV SA and ECHO determined LVEDD, which suggested that non-gated chest CT may be useful for the determination of LV dilated cardiomyopathy (enlarged LV volumes with normal or thin myocardia) [23]. Furthermore, CTR, which has been long used as a gross quick measure of cardiomegaly, is further confirmed to be a rather weak indicator of LVH, as it showed poor correlation with LVME, and remains simply as a descriptor.
The low inter-observer variability of the LV short axis diameter on axial CT (LVDCT) measurements, in addition to strong correlation with LVEDD suggest that this parameter has value in further investigation. Strong inter-observer and CT-echocardiogram correlation may be due to the fact that the LV chamber is large relative to these margins of error [20]. In comparison, higher inter-observer and poorer CT-echocardiogram correlation was seen with PWT and ST, which is attributed to the these relatively shorter dimensions conferring a larger percentages of error with variations that occur in manual measurement. High variability and poor correlation with these values in particular is thought to effect correlation of LVM and RWT calculations (which are derived from these measurements), and therefore limit assessment of LV hypertrophy on non-gated CT. Furthermore, the poor correlation of septal thickness between echocardiography and CT, as well as poor correlation between STE and STCT and LV mass, suggest that the 1.2 cm septal thickness cutoff that has traditionally been used to suggest LV hypertrophy on CT is not a valid criterion [24]. Furthermore, the high inter-observer variability demonstrated in this study with CTR measurements limit the utility of CTR in assessing LV hypertrophy, indicating that CTR measurements on CT are not useful in indicating LV hypertrophy or LV dilation.
Several studies have confirmed the value of ECG-gated cardiac imaging for the evaluation of left ventricular function [6-8,10,11]. Temporal resolution is also taken into consideration owing to the dynamic function of the heart and its variation in volume depending on systole and diastole [14]. The results of a meta-analysis showed that, compared to MRI and TTE, MSCT (64-slice or DSCT) showed no significant difference in LVEF estimation with strong correlation between MSCT and MRI or TTE [6]. There was also no significant difference when the studies were compared using single-source or dual-source technique; however, the studies using DSCT were more homogenous compared to single-source 64-slice studies. Due to radiation and contrast risks, the currently used techniques cannot be recommended primarily for the purpose of routine functional examination for evaluating LVEF in all patients but may be able to be used retrospectively, and TTE still remains the first choice for the overall evaluation of cardiac structures and function.
Other studies have investigated the role of non-gated CT for the reporting of left ventricular function. A study by Gollub et al. [20], reported that CT left ventricular short diameter showed moderate correlation with the ECHO left ventricular internal diameter (r=0.49) and left ventricular mass (r=0.37). Our findings showed a strong positive correlation between CT LV-SA and LVEDD, with an r coefficient of 0.76 (p<0.001) and low interobserver variability. We also found a moderate correlation between ECHO and CT LVM estimates, with an r correlation coefficient of 0.56 (p=0.006) and also low interobserver variability.
Two studies also investigated the role of non-gated CT for the reporting of cardiothoracic ratio [16,20]. The Study by Gollub et al. [20], reported that the “translation of CTR, arbitrarily called cardiomegaly, into a clinically useful pathologic criterion was not successful”. They concluded that the moderate ability of routine CT-CTR to predict LVH indicates that it is possible that CT-CTR may be of no use in predicting LVH. Schlett et al. [16], also demonstrated that CTR was not correlated to LV volume, mass, size or LV area on ECHO. Our findings are largely in agreement with the literature describing a poor correlation of CTR with ECHO-determined LVEDD, LVM, and EF, limiting its usefulness as a measure of cardiomegaly [18,19]. Interestingly, we found a more moderate correlation with ECHO-determined LVH than with LV dilatation.
Study limitations include single center retrospective design. Another limitation is the small sample size; these factors can predispose to a skewed study population (for example, one with patients with more severe heart disease and abnormal cardiac function). A significant limitation is that most patients did not have both examinations on the same day, or within set time periods. Any change in cardiac function and anatomic parameters between the two studies, particularly in cases with a large time span of time between CT and echocardiography, will limit validity of our results. In summary, our results indicate that non-gated chest CT is not a valid modality in evaluating left ventricular hypertrophy and function when compared to ECHO. This is probably attributed to inaccuracy in measurement of the posterior wall and the septum. This can be addressed by standardizing how certain cardiac measurements are done on non-gated chest CT and having normal values as references as what was proposed for echo in a recent publication [25]. Although there have been studies showing that non gated CT chest can be used, such study by Minkowitz et al., which evaluated 101 patients and found a correlate using RV/LV ratio on non-gated CT chest with LV systolic and diastolic functions on ECHO [26]. Further investigation with a larger sample size and a wider range and quantity of abnormal cardiac measurements may be more successfully to determine if CTR and LV short could truly distinguish patients with and without LVH and LV dysfunction.
ACKNOWLEDGMENT
We would like to thank Drs. L. Salciccioli, R. Royzman, and L. Nallamshetty for their contributions to this work.
REFERENCES
- Shaw LJ, Peterson ED, Kesler K, Hasselblad V, Califf RM (1996) A metaanalysis of predischarge risk stratification after acute myocardial infarction with stress electrocardiographic, myocardial perfusion, and ventricular function imaging. Am J Cardiol 78: 1327-1337.
- Levy D, Garrison RJ, Savage DD, Kannel WB, Castelli WP (1990) Prognostic implications of echocardiographically determined left ventricular mass in the Framingham Heart Study. N Engl J Med 322: 1561-1566.
- Levy D, Wilson PW, Anderson KM, Castelli WP (1990) Stratifying the patient at risk from coronary disease: New insights from the Framingham heart study. Am Heart J 119: 712-717.
- Multicenter Postinfarction Research Group (1983) Risk stratification and survival after myocardial infarction. N Engl J Med 309: 331-336.
- Abbara S, Chow BJ, Pena AJ, Cury RC, Hoffmann U, et al. (2008) Assessment of left ventricular function with 16- and 64-slice multi-detector computed tomography. Eur J Radiol 67: 481-486.
- Asferg C, Usinger L, Kristensen TS, Abdulla J (2012) Accuracy of multi-slice computed tomography for measurement of left ventricular ejection fraction compared with cardiac magnetic resonance imaging and two-dimensional transthoracic echocardiography: A systematic review and meta-analysis. Eur J Radiol 81: 757-762.
- Abdulla J, Abildstrom SZ, Gotzsche O, Christensen E, Kober L, et al. (2007) 64-multislice detector computed tomography coronary angiography as potential alternative to conventional coronary angiography: A systematic review and meta-analysis. Eur Heart J 28: 3042-3050.
- Henneman MM, Schuijf JD, Jukema JW, Holman ER, Lamb HJ, et al. (2006) Assessment of global and regional left ventricular function and volumes with 64-slice MSCT: A comparison with 2D echocardiography. J Nucl Cardiol 13: 480-487.
- Henneman MM, Schuijf JD, Jukema JW, Lamb HJ, de Roos A, et al. (2006) Comprehensive cardiac assessment with multislice computed tomography: Evaluation of left ventricular function and perfusion in addition to coronary anatomy in patients with previous myocardial infarction. Heart 92: 1779-1783.
- Henneman MM, Bax JJ, Schuijf JD, Jukema JW, Holman ER, et al. (2006) Global and regional left ventricular function: A comparison between gated SPECT, 2D echocardiography and multi-slice computed tomography. Eur J Nucl Med Mol Imaging 33:1452-1460.
- Kristensen TS, Kofoed KF, Møller, Ersbøll M, Kühl T, et al. (2009) Quantitative assessment of left ventricular systolic wall thickening using multidetector computed tomography. Eur J Radiol 72: 92-97.
- Ko SM, Kim YJ, Park JH, Choi NM (2010) Assessment of left ventricular ejection fraction and regional wall motion with 64-slice multidetector CT: A comparison with two-dimensional transthoracic echocardiography. Br J Radiol 83: 28-34.
- Busch S, Johnson TR, Wintersperger BJ, Minaifar N, Bhargava A, et al. (2008) Quantitative assessment of left ventricular function with dual-source CT in comparison to cardiac magnetic resonance imaging: Initial findings. Eur Radiol 18: 570-575.
- Brodoefel H, Kramer U, Reimann A, Burgstahler C, Schroeder S, et al. (2007) Dual-source CT with improved temporal resolution in assessment of left ventricular function: A pilot study. AJR Am J Roentgenol 189: 1064-1070.
- Joemai RM, Geleijns J, Veldkamp WJ, Kroft LJ (2008) Clinical evaluation of 64-slice CT assessment of global left ventricular function using automated cardiac phase selection. Circ J 72: 641-646.
- Schlett CL, Kwait DC, Mahabadi AA, Bamberg F, O'Donnell CJ, et al. (2010) Simple area-based measurement for multidetector computed tomography to predict left ventricular size. Eur Radiol 20: 1590-1596.
- Screaton N (2010) The cardiothoracic ratio--an inaccurate and outdated measurement: New data from CT. Eur Radiol 20: 1597-1598.
- Giamouzis G, Sui X, Love TE, Butler J, Young JB, et al. (2008) A propensity-matched study of the association of cardiothoracic ratio with morbidity and mortality in chronic heart failure. Am J Cardiol 101: 343-347.
- Clark AL, Coats AJ (2000) Unreliability of cardiothoracic ratio as a marker of left ventricular impairment: Comparison with radionuclide ventriculography and echocardiography. Postgrad Med J 76: 289-291.
- Gollub MJ, Panu N, Delaney H, Sohn M, Zheng J, et al. (2012) Shall we report cardiomegaly at routine computed tomography of the chest? J Comput Assist Tomogr 36: 67-71.
- Lang RM, Bierig M, Devereux RB, Flachskampf FA, Foster E, et al. (2005) Recommendations for chamber quantification: A report from the American Society of Echocardiography's Guidelines and Standards Committee and the Chamber Quantification Writing Group, developed in conjunction with the european association of echocardiography, a branch of the European society of cardiology. J Am Soc Echocardiogr 18: 1440-1463.
- CDC (2011) Leading Causes of Death. CDC, Georgia, USA.
- Boulmier D, Audinet C, Heautot JF, Larralde A, Veillard D, et al. (2009) Clinical contributions of 64-slice computed tomography in the evaluation of cardiomyopathy of unknown origin. Arch Cardiovasc Dis 102: 685-696.
- Suresh R, Grogan M, Maleszewski JJ, Pellikka PA, Hanna M, et al. (2014) Advanced cardiac amyloidosis associated with normal interventricular septal thickness: An uncommon presentation of infiltrative cardiomyopathy. J Am Soc Echocardiogr 27: 440-447.
- Cantinotti M, Giordano R, Paterni M, Saura D, Scalese M, et al. (2017) Adult echocardiographic nomograms: Overview, critical review and creation of a software for automatic, fast and easy calculation of normal values. J Thorac Dis 9: 5404-5422.
- Minkowitz S, Haramati LB, Zalta B, Spindola-Franco HF, Christos PJ, et al. (2014) Can left ventricular function be assessed on non-ECG-gated CT? Clin Imaging 38: 669-674.
Citation: Ali H, Haddad D, Srinivasan A, Aggarwal A, Nallamshetty K, et al. (2018) Correlation between Non-Gated Chest CT and Echocardiography in the Assessment of the Left Ventricle. J Pulm Med Respir Res 4: 014..
Copyright: © 2018 Haneen Ali, et al. This is an open-access article distributed under the terms of the Creative Commons Attribution License, which permits unrestricted use, distribution, and reproduction in any medium, provided the original author and source are credited.
© 2026, Copyrights Herald Scholarly Open Access. All Rights Reserved!