Effect of Fermented Millet Flour Ibyer Supplemented with Ginger Powder on Hematological indices and Body Weight of Wister Albino Rats
*Corresponding Author(s):
Ogori Akama FridayDepartment Of Home Science And Management, Faculty Of Agriculture, Federal University, Gashua, P.M.B.1005 Gashua, Yobe State, Nigeria
Email:ogorifaraday@gmail.com
Abstract
In this study, fermented millet flour supplemented with ginger powder were formulated in the ratio 100% millet flour: 0% ginger flour, 95% millet flour:5% ginger flour, 90% millet flour:10% ginger flour, 85% millet flour:15% ginger flour, 80% millet flour:20% ginger flour, 75% millet flour: 25% ginger flour, and 70% millet flour:30% ginger flour respectively for the production of “Ibyer”. The blends were subjected to feeding trial using male wistar albino rats of 3 weeks old, weighing 100g to 130g obtained. They were fed formulated diet prepared from fermented millet flour and ginger powder blends. The hematological analysis showed that packed cell volume ranged from 32 - 54%, white blood cell ranged from 1.87 -7.10x10⁹/L and red blood cell ranged from 4.20 - 6.97 x 10¹²/L which was within recommended range. The albino rats showed significant increase in body weight throughout the experimental period ranging from 78.67 - 103.80 g. The result from the experimental analysis finally revealed that ‘Ibyer’, A fermented millet flour blended with ginger at ration 85% millet flour:15% ginger flour, 80% millet flour:20% ginger flour,, 75% millet flour:25% ginger flour had better heamatological indices.
Keywords
Albino rat; Body weight; Fermented; ginger flour; Hematology; Millet flour; supplementation
INTRODUCTION
“Ibyer” is indigenous to the Tiv people in Benue state and has similar characteristics to some gruels in certain localities in Nigeria and Africa, as an example is Eniokwola a porridge eaten by the Idoma people of Benue state [1].Two types of ibyer are consumed based on the method of preparation. The sweet type (Ibyer-i-nyohon), prepared by milling the grain into flour which is reconstituted with water and cooked [2] while the sour type (Ibyer-angen) undergoes fermentation. The powder I for the sour type is reconstituted to form a slurry or paste which is left to ferment overnight thus producing the desired sourness [1].
Millet is an important security crop but it is not popular in Nigeria. Millet is an important minor cereal crop with very high nutritional and medicine values. These are attributed to its high polyphenol, dietary fiber, minerals and essential amino acids [3]. Millets lack gluten and can be consumed by people suffering from celiac disease [4]. Some in vivo studies by [5-8], showed significant lowering of blood glucose level by millet based diet when compared to a wheat or rice diet. However, most of the in vivo studies on millets have mainly considered millets products from composite flour. Epidemiological studies indicates that regular consumption of whole grain and their products can protect against the risk of cardiovascular diseases, type II diabetes, obesity, gastrointestinal cancers and atherosclerogenic effects, anti-oxidant and microbial properties and so many other disorders [3,9, 10] reported that millet contain high level of methionine, tryptophan, vitamin B, fiber and minerals such as phosphorus, iron and it contains forty times calcium level more than that found in maize (Zea mays L.) and rice (Oryza sativa L.) and contain ten times calcium more than that found in wheat (Triticum estivum L.).Millets are known to have a low glycemic index as suggested by some in vivo studies however all of these studies have mainly focused on millet products from composite flour [6-8]. Starch digestibility studies on the 100% cooked millet flour have been rarely done. Dietary fibre, phenolics and lipids which are mainly lost during decortication may also affect in vitro starch digestibility [11,12].
Fermentation can synthesize certain amino acids and increase availability of vitamins [13]. It also sets optimum pH conditions for enzymatic degradation of phytate which is present in millets as complexes with polyvalent cations such as iron, zinc, calcium, magnesium and proteins. The reduction in phytate may increase the amount of soluble iron, zinc and calcium in many folds [14]. Improvement of starch, protein digestibility and sensory properties of food products from fermented and germinated flour has also been reported [15].
Ginger can be used fresh, dried, powdered, or as an oil or juice, and is sometimes added to processed foods and cosmetics. It is a very common ingredient in recipes. The unique fragrance and flavor of ginger come from its natural oils, the most important of which is gingerol. Gingerol is the main bioactive compound in ginger, responsible for much of its medicinal properties. It has powerful anti-inflammatory and antioxidant effects [16].
The medicinal, chemical, and pharmacological properties of ginger have been extensively reviewed [17]. Over the last few years, interest in ginger or its various components as valid preventive or therapeutic agents has increased markedly, and scientific studies focusing on verification of ginger’s pharmacological and physiological actions have likewise increased [16]. The present study was aimed at assessing the quality of fermented millet (Pennisetum glacum) flour supplemented with ginger (Zingiber officinalis) powder and its effect on haematological indices and body weight of albino rats.
MATERIALS AND METHODOLOGY
Sample preparation
The millet grains were sorted and milled into flour using hammer mills.
Preparation of fermented millet flour
The method described by [18] was used with slight modifications for the production of millet flour. Pearl millet flour was prepared as shown in (Figure 1). The grains were sorted and cleaned to remove unwanted materials like stones, pebbles and other foreign seeds, before washing with tap water and steeping (72 h). Therefore, the grains were drained, dried, milled and sieved to get whole pearl millet flour.
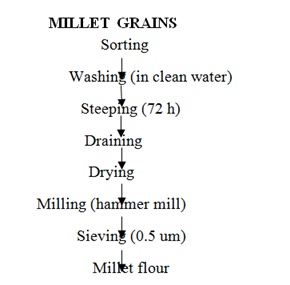 Figure 1: Flow chart for the production of millet flour Source: [18]
Preparation of Ginger powder
Ginger flour will be prepared according to the method of [19] with slight modification as shown in (Figure 2). Fresh ginger roots were sorted by soaking in water to get rid of dirts and to remove unwanted materials, before washing with tap water. The cleaned roots were drained, sliced, and sundried, milled using hammer mill and sieved through 600 μm aperture size.
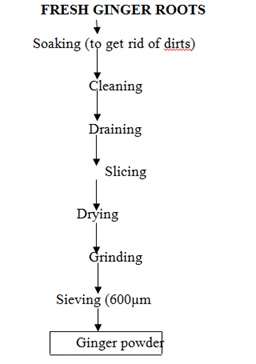 Figure 2: Flow chart for the production of ginger powder Source: [19] Modified
Preparation of “ibyer” from fermented millet flour and ginger powder blends
‘Ibyer’ was produced as described by [20] with slight modification. Each sample weighing 100:0, 95:5, 90:10, 85:15,80:20, 75:25, 70:30 (Table 1) of both fermented millet flour and ginger powder were mixed each with 10 ml of distilled water to form a slurry. It was allowed to ferment for 12 h. 200 ml of boiling water was added to the slurry which was heated for 10 minutes with continuous stirring to avoid the formation of lumps. The gruel was allowed to cool to 40oC. The production flow chart is as shown in (figure 3).
|
Sample code |
Millet |
Ginger |
|
716 |
100 |
– |
|
924 |
95 |
5 |
|
839 |
90 |
10 |
|
746 |
85 |
15 |
|
958 |
80 |
20 |
|
469 |
75 |
25 |
|
577 |
70 |
30 |
Table 1: Blend Formulation (%) of fermented millet flour supplemented with ginger powder for “ibyer” production.
KEY: 716=M100(Control),924=M95G5,839=M90G10,746=M85G15,958=M80G20,469=M75G25,577=M70G30
Where, M=Millet, G=Ginger
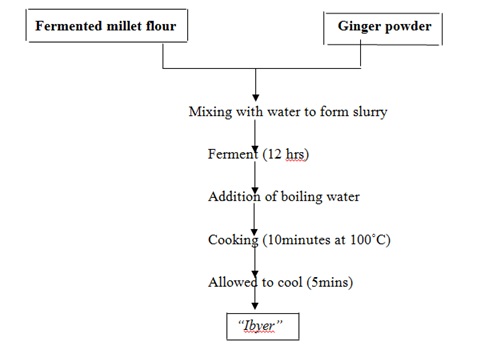 Figure 3: Flow chart for the production of “ibyer” Source: [20]
Experimental animals’ model and their maintenance
Twenty-one (21) healthy wistar albino rats aged 3 weeks (21days), weighing 100g to 130g were obtained from Benue state university, college of health science. Three rats were kept in animal cages in an animal house Department of Home Science and Management, Federal University of Agriculture, Makurdi. The rats were allowed to acclimatize with the laboratory condition for 7 days in well ventilated cages. They were divided into 7 groups of 3 rats each. Each of the rats was given an identification mark in form of an indelible mark on tail, head and back. During the acclimatization period, the rats were allowed access to food and water ad libitum. (Table 2).
|
Sample code |
716 |
924 |
839 |
746 |
958 |
469 |
577 |
|
Millet |
10 |
9.5 |
9 |
8.5 |
8 |
7.5 |
7 |
|
Ginger |
- |
0.5 |
1 |
1.5 |
2 |
2.5 |
3 |
|
Corn starch |
70 |
70 |
70 |
70 |
70 |
70 |
70 |
|
Vitalyte |
5 |
5 |
5 |
5 |
5 |
5 |
5 |
|
Rice husk |
5 |
5 |
5 |
5 |
5 |
5 |
5 |
|
Sucrose |
10 |
10 |
10 |
10 |
10 |
10 |
10 |
|
Total |
100 |
100 |
100 |
100 |
100 |
100 |
100 |
Table 2: Blend formulation for experimental feeding.
KEY: 716= M100 (Control), 924=M95G5, 839=M90G10, 746=M85G15, 958=M80G20, 469=M75G25, 577=M70G30.
Where, M=Millet, G=Ginger
METHODOLOGY
Specimen collection and preservation
About 1.5-2ml of blood was directly collected through intracardiac puncture with a hypodermic syringe to minimize damage and serum contamination [21] at day 3, 7, 14, 21 and 28. Application of finger pressure is necessary to dilate the vessel. Blood was withdrawn slowly to prevent the vessel collapsing. The collected blood was split into two aliquot; one portion was of 500 μl in heparinized microhaematocrit tubes for estimation of packed cell volume (PCV), Red blood cell (RBC) and White blood cell (WBC). The rest of the blood was used for serum isolation according to the method of [22].The blood was kept under room temperature in a little slanting condition at 30?C when centrifuged at 2500 rpm for 10 minutes. The supernatant was obtained as serum and kept at 4?C for further determination of serum total protein, alanine aminotransferase (ALT), aspartate aminotransferase (AST) and Total Cholesterol. At the end of the experimental period, each animal was sacrificed by decapitation, and their organs were weighed in terms of size, weight and color.
Packed cell volume (PCV)
Blood sample was filled to 75% of capillary tube through capillary action, one end of tube was sealed with plasticine and placed in micro-haematocrit centrifuge and the centrifuge was set at 12 rpm (revolution per minute) for 5 minutes. Thereafter, the centrifuge was spuned and the tubes were removed and the percentage packed volume was read using micro-haematocrit reader according to the method of [23].
Red blood cells (RBC)
The red blood cells count was determined by haemocytometry.
Procedure: Blood was drawn up to 0.5 mark of the RBC pipette and RBC diluting fluid was added to it up to 101 marks. The fluid and blood were mixed well and the first few drops of blood were discarded by holding the pipette vertically. The counting chamber was charged with a drop of blood that had mixed with diluting fluid and the chamber was left undisturbed for few minutes and the four corners of the chamber were visualized under a low power (10x) objective and cells were counted in all the four marked squares.
Total RBC/L= (Number of cells counted x diluting factor) / (Area counted x depth of fluid)
White Blood Cells (WBC) or Total leucocyte count (TLC)
Total leucocyte count was determined by haemocytometer method
Procedure: Blood was drawn up to 0.5 mark of the WBC pipette and WBC diluting fluid was added up to 11 mark. The fluid and blood were mixed well and the first few drops of blood were discarded by holding the pipette vertically. The counting chamber was charged by holding the pipette vertically. The counting chamber was charged with a drop of blood that has mixed with diluting fluid and the chamber was left undisturbed for few minutes and the four corners of the chamber and the middle were visualized under a low power (10x) objective and cells were counted in all the four marked squares.
Total WBC/L = (Number of cells x diluting factor) / (Area counted x depth of fluid)
RESULT
Packed cell volume (%) of the experimental albino rats fed fermented millet flour supplemented with ginger powder .The Packed Cell Volume (PCV) in (Table 3) shows that there was a significant increase from the initial to Day 14 in all the experimental groups apart from the control sample which decreased from day 3 to day 28. On the other hand, the PCV after alloxan induction decreased on day 21 in all the experimental groups because of the effect of alloxan monohydrate and increased on day 28 which shows that the experimental animals were utilizing their diet well and the animals were not anaemic during the experiment because their PCV was within the recommended range (28-50%).
|
Sample code |
Packed Cell Volume (PCV) After alloxan induction |
|||||
|
Initial |
Day 3 |
Day 7 |
Day 14 |
Day 21 |
Day 28 |
|
|
716 |
40.67±1.45a |
39.67±3.38a |
36.67±3.33a |
34.67±2.19b |
33.00±1.15a |
32.6±0.88a |
|
924 |
38.33±2.60a |
38.93±1.15a |
48.67±4.97a |
49.67±2.18b |
36.00±1.15a |
39.3±2.07c |
|
839 |
39.67±3.84a |
40.00±3.06a |
49.33±1.20ab |
50.67±2.18b |
37.70±1.20a |
38.6±0.33bc |
|
746 |
40.00±3.51a |
41.33±3.71a |
42.00±7.93a |
45.33±1.46b |
37.70±3.17a |
37.7±0.88bc |
|
958 |
41.00±0.57a |
42.33±0.33a |
44.00±2.00ab |
49.00±1.52bc |
35.00±4.33a |
38.3±1.20bc |
|
469 |
41.00±1.52a |
41.67±1.20a |
50.67±2.33ab |
54.00±1.52bc |
36.60±0.88a |
37.3±1.20bc |
|
577 |
40.00±2.89a |
40.67±1.76a |
46.67±2.33ab |
47.33±4.97ab |
36.60±0.88a |
37.3±3.28ab |
Table 3: Packed cell volume (%) of the experimental albino rats fed fermented millet flour supplemented with ginger powder
Values are mean ± SD of 3 replicate determinant, n=3; values bearing different superscripts (a,b,c) in the same row are significantly (p<0.05) different; PCV=Packed Cell Volume
KEY: 716=M100 (control), 924=M95G5, 839=M90G10, 746=M85G15, 958=M80G20, 469=M75G25, 577=M70G30
Where, M=Millet, G=Ginger
Red blood cells (1012 /L) of the experimental albino rats fed fermented millet flour supplemented with ginger powder
The (Table 4) shows that Red Blood Cell (RBC) of all the experimental groups significantly increased (p<0.05) from day 3 to day 14 of the normal feeding trial as compared to the baseline of the experiment indicating the animals were healthy. However, there was a significant decrease (p<0.05) in the RBC on day 21 after alloxan induction and an increase on day 28 while the control group (716) decreased from the initial to the day 28 All the values were within the recommended range 3-11 x 1012 /L.
|
Sample code |
Red Blood Cell (RBC) x 1012 /L After alloxan induction |
|||||
|
Initial |
Day 3 |
Day 7 |
Day 14 |
Day 21 |
Day 28 |
|
|
716 |
5.10±0.15a |
4.83±0.32a |
4.76±0.12a |
4.61±0.06b |
5.40±0.05c |
4.86±0.03b |
|
924 |
5.23±0.38a |
5.36±0.37a |
5.97±0.31bc |
6.50±0.17b |
4.80±0.05b |
5.00±0.11b |
|
839 |
5.83±0.58a |
5.93±0.55a |
6.77±0.18d |
6.97±0.20bc |
5.00±0.11bc |
5.46±0.14b |
|
746 |
5.46±0.48a |
5.53±0.12a |
5.53±0.26a |
6.10±0.15c |
4.80±0.28b |
4.90±0.11b |
|
958 |
5.10±0.12a |
5.10±0.25a |
5.46±0.26a |
5.83±0.20bc |
4.63±0.31ab |
4.80±0.41b |
|
469 |
5.10±0.55a |
5.16±0.44a |
6.46±0.14cd |
6.67±0.24b |
4.20±.11a |
4.37±0.27a |
|
577 |
5.53±0.28a |
5.64±0.20a |
6.30±0.12cd |
6.30±0.17b |
4.87±0.08bc |
4.97±0.35b |
Table 4: Red blood cells (1012/L) of the experimental albino rats fed fermented millet flour supplemented with ginger powder.
Values are mean ± SD of 3 replicate determinant, n=3; values bearing different superscripts (a,b,c) in the same row are significantly (p<0.05) different
KEY: 716=M100 (control), 924=M95G5, 839=M90G10, 746=M85G15, 958=M80G20, 469=M75G25, 577=M70G30
Where, M=Millet, G=Ginger
White blood cells (109 /L) of the experimental albino rats fed fermented millet flour supplemented with ginger powder
The White Blood Cells (WBC) in (Table 5) shows a slight increase in all the groups from day 3 to day 14 of the normal feeding trial as compared to the baseline while the control group was unstable. However, there was a significant decrease in WBC on day 21 after alloxan induction in all the groups indicating the animals were diseased. On day 28 after the treatment with the diet, there was a slight increase in white blood cells proliferation showing that the diet had positive effect on the animals. All the values obtained were within the recommended range of 2-9 x 10⁹ /L.
|
Sample code |
Red Blood Cell (RBC) x 1012 /L After alloxan induction |
|||||
|
Initial |
Day 3 |
Day 7 |
Day 14 |
Day 21 |
Day 28 |
|
|
716 |
5.10±0.15a |
4.83±0.32a |
4.76±0.12a |
4.61±0.06b |
5.40±0.05c |
4.86±0.03b |
|
924 |
5.23±0.38a |
5.36±0.37a |
5.97±0.31bc |
6.50±0.17b |
4.80±0.05b |
5.00±0.11b |
|
839 |
5.83±0.58a |
5.93±0.55a |
6.77±0.18d |
6.97±0.20bc |
5.00±0.11bc |
5.46±0.14b |
|
746 |
5.46±0.48a |
5.53±0.12a |
5.53±0.26a |
6.10±0.15c |
4.80±0.28b |
4.90±0.11b |
|
958 |
5.10±0.12a |
5.10±0.25a |
5.46±0.26a |
5.83±0.20bc |
4.63±0.31ab |
4.80±0.41b |
|
469 |
5.10±0.55a |
5.16±0.44a |
6.46±0.14cd |
6.67±0.24b |
4.20±0.11a |
4.37±0.27a |
|
577 |
5.53±0.28a |
5.64±0.20a |
6.30±0.12cd |
6.30±0.17b |
4.87±0.08bc |
4.97±0.35b |
Table 5: White blood cells (109 /L) count of the experimental albino rats fed fermented millet flour supplemented with ginger powder.
Values are mean ± SD of 3 replicate determinant, n=3; values bearing different superscripts (a,b,c) in the same row are significantly (p<0.05) different
KEY: 716=M100 (control), 924=M95G5, 839=M90G10, 746=M85G15, 958=M80G20, 469=M75G25, 577=M70G30
Where, M=Millet, G=Ginger
Body weight (g) of the experimental animals fed fermented millet flour supplemented with ginger powder
Body weight indicates the normal growth of the rats. The (Table 6) shows that the animals exhibited slight increase in body weight on day 7 to day 14 when the normal feeding trial was terminated in all the groups. However, there was a significant (p<0.05) decrease in body weight on day 21 during alloxan induction.
There is also a significant increase (p<0.05) in body weight on day 28 showing that the experimental animals were utilizing their diet well and its attributed to the normal growth of the rats.
|
Sample code |
Body Weights After alloxan induction |
||||
|
Initial |
Day 7 |
Day 14 |
Day 21 |
Day 28 |
|
|
M100 |
95.37±5.16ab |
96.67±4.33bc |
97.40±3.08abc |
95.30±2.10b |
98.60±3.18a |
|
M95G5 |
78.67±1.45a |
84.56±2.02ab |
88.00±1.15abc |
87.20±1.10b |
87.90±2.12 |
|
M90G10 |
83.00±1.15a |
87.67±1.45 |
89.00±1.25abc |
88.40±1.15b |
88.80±1.18 |
|
M85G15 |
100.23±6.93c |
101.67±4.91 |
103.80±5.24bc |
93.80±3.62b |
94.20±3.98a |
|
M80G20 |
80.33±6.36a |
85.00±3.46ab |
88.10±2.88abc |
87.90±.61b |
88.10±1.78 |
|
M75G25 |
89.00±1.53ab |
90.67±2.33abc |
91.00±1.73 |
90.10±1.12b |
91.42±1.58a |
|
M70G30 |
79.33±0.88a |
84.33±1.76b |
84.60±0.00b |
83.20±0.00b |
84.70±0.98 |
Table 6: Body weights (g) of the experimental albino rats fed fermented millet flour supplemented with ginger powder.
Values are mean ± SD of 3 replicate determinant, n=3; values bearing different superscripts (a,b,c) in the same rows are significantly (p<0.05) different.
KEY: M100= (Control), M95G5=95%millet flour: 5%ginger flour M90G10=, 90%millet flour : 10%ginger flour, M85G15= 85%millet flour :15%ginger flour, M80G20= 80%millet flour :20%ginger flour, M75G25,= 75%millet flour:25%ginger flour, M70G30 =70%milletflour :30%ginger flour.
Where, M=Millet, G=Ginger
DISCUSSION
Packed cell volume of experimental albino rats fed fermented millet flour supplemented with ginger powder Packed Cell Volume (PCV) is a test that indicates whether someone is anaemic. Packed Cell Volume is used to measure red blood cell mass. From (Table 4), an increase in red blood cell mass is equivalent to erythrocytosis and a decrease indicating anaemia. Results of the PCV showed that the PCV increased from day 3 to day 14 which indicate that the experimental animals were utilizing their diet well while the PCV in the control sample decreased from day3 to day 28. The PCV reduced at day 21 when alloxan was induced. Alloxan is a toxic chemical which is used for induction of diabetes in experimental animals. At day 28 the PCV increased which indicate the animals were utilizing their diet well.
Red Blood Cells of experimental albino rats fed fermented millet flour supplemented with ginger powder
The red blood cell carries oxygen. The result from (Table 4) shows an increase in RBC from day 3 to day 14 indicating the rats were utilizing their diet well. At day 21 when alloxan was induced the red blood cells reduced due to the effect of the alloxan and increased on day 28 because of the ameliorative effect of the diet on the albino rats. The control sample decreased from day 3 to day 28. This report agrees with the report of [24] that worked on haematological parameters of alloxan- induced diabetic rats treated with leaf essential oil of Hoslundia opposite.
White Blood Cells count of experimental albino rats fed fermented millet flour supplemented with ginger powder
White Blood Cell (Leucocytes) are the cells of the immune system that are involved in protecting the body against both infectious disease and foreign invaders. Leucocytes are found throughout the body, including the blood and lymphatic system. Immunity depends on WBC. The result from (Table 5) shows that the WBC increased from day 3 to day 14. White blood cells increases when there is a problem unlike the PCV and RBC. At day 21 the WBC increased because it’s mobilizing other cells like the monocytes, lymphocytes, eosinophils and basophils to fight. Elevation of WBC in diabetic rats is an indication of inflammation or tissue damage.
At day 28 the WBC revealed the diet was able to function well in the experimental rats. The control sample was unstable because of the absence of ginger in the diet. This report agrees with the report of [24] that worked on haematological parameters of alloxan- induced diabetic rats treated with leaf essential oil of Hoslundia opposite.
Body weights of experimental albino rats fed fermented millet flour supplemented with ginger powder
The experimental rats showed an increase in the body weight pattern from the initial state to day 14 including the control group and a slight decrease in body weight when alloxan was introduced on day 21. However, there was significant (p<0.05) increase in body weight in all the groups on day 28.
ACKNOWLEDGMENT
All the authors acknowledged the department of Food science and Technology for support in the course of this work.
CONFLICT OF INTEREST
There are no conflicts of interest among the authors
REFERENCES
- Oche SA (2008) Development and Quality Evaluation of Instant Ibyer -A Traditional Cereal Gruel. BSc. Thesis, Department of Food Science and Technology University of Agriculture Makurdi, Benue State.
- Adigun NA (1997) Composition and Functional Properties of Sorghum/Groundnut Flour Blends for Ibyer Production. BSc. Thesis, Department of Food Scienceand Technology Makurdi, Benue State.
- McKeown NM, Meigs JB, Liu S, Wilson PWF, Jacques PF (2002) Whole grain intake is favorably associated with metabolic risk factors for type 2 diabetes and cardiovascular disease in the Framingham Offspring Study. American Journal of Clinical Nutrition 76: 390-398.
- Gabrovska D, Fiedlerova V, Holasova M, Maskova E, Smrcinov H (2002) The nutritional evaluation of underutilized cereals and buckwheat. Food and Nutritional Bulletin 23: 246-249.
- Shobana S, Malleshi NG (2007) Preparation and functional properties of decorticated finger millet (Eleusine coracana) Journal of food engineering 79: 529-538.
- Thathola A, Srivastava S, Singh G (2011) Effect of foxtail millet (Setaria italica) supplementation on serum glucose, serum lipids and glycosylated hemoglobin in type 2 diabetics. Diabetologia Croatica 40: 23-28.
- Anju T, Sarita S (2010) Suitability of foxtail millet (Setaria italica) and barnyard millet (Echinochloa frumentacea) for development of low glycemic index biscuits. Malyasian Journal of Nutrition 16: 361-368.
- Shukla K, Srivastava S (2014) Evaluation of finger millet incorporated noodles for nutritive value and glycemic index. Journal of Food Science and Technology 42: 1-8.
- Shinggu CP, Tunwari BA, Gani M (2016) Finger Millet (Eleusine coracana(L.)( GAERTN) in Sustainable Food Security in Nigeria: A Review. FUW Trend in Science and Technology Journal 1: 332-336.
- 10. Vanderjagt DJ, Brock HS, Melah GS, El-Nafaty AU, Crossey MJ, et al. (2007) Nutritional Factors Associated with Anemia in Pregnant Woman in Northern Nigeria. The Journal Health, Population and Nutrition 2: 75-81.
- Singh J, Dartois A, Kaur L (2010) Starch digestibility in food matrix: a review. Trends in Food Science & Technology 21: 168-180.
- Venn BJ, Mann JI (2013) Cereal grains, legumes and diabetes. European Journal of Clinical Nutrition 58: 1443-1461.
- Chavan JK, Kadam SS, Beuchat LR (1989) Nutritional improvement of cereals by fermentation. Critical Reviews in Food Science & Nutrition, 28: 349-400.
- Kouakou B, Alexis KKS, Adjéhi D, Marcelin D K, Dago G (2008) Biochemical changes occurring during germination and fermentation of millet and effect of technological processes on starch hydrolysis by the crude enzymatic extract of millet. Journal of Applied Sciences Research 4: 1502-1510.
- Inyang CU, Zakari UM (2008) Effect of germination and fermentation of pearl millet on proximate, chemical and sensory properties of instant “fura”-A Nigerian cereal food. Pakistan Journal of Nutrition 7: 9-12.
- Ali BH, Blunden G, Tanira MO, Nemmar A (2008) Some phytochemical, pharmacological and toxicological properties of ginger (Zingiber officinale Roscoe): A review of recent research. Food Chem Toxicol 46: 409-420.
- Nicoll R, Henein MY (2009) Ginger (Zingiber officinale Roscoe): a hot remedy for cardiovascular disease? International Journal Cardiol 131: 408-409.
- Sengev IA, Ingbian EK Gernah DL (2010) Sensory and storage properties of instant kunun-zaki: a non-alcoholic fermented sorghum beverage supplemented with mango mesocarp flour. Nigerian food journal 28: 336-346.
- Sekwati-Monang B (2011) Microbiological and chemical characterisation of ting, a sorghum-based gluten-free fermented cereal product from botswana. Ph. D. thesis, University of Alberta, Edmonton, Canada 150: 115-121.
- Kure OA, Wyasu G (2013) Influence of Natural Fermentation, Malt Addition and Soya Fortification on the Sensory and Physicochemical Characteristics of Ibyer-Sorghum Gruel. Advances in Applied Science Research 4: 345-349.
- Jochems CE, Vander Valk JB, Stafleu FR, BaumansV (2002) The use of fetal bovine serum:Ethical or Scientific problem? Altern Lab Arum 30: 219-227.
- Singh R, Rana SV (2007) Protective effects of few antioxidants on liver function in rats treated with cadmium and mercury. Indian Journal of Experimental Biology 34: 177-179.
- Coles EH (1986) Veterinary clinical pathology in (1st edition). W.B. Saunders company, Pennsylvania, USA.
- Muhammed NO, Akolade JO, Usman LA, Oloyede OB (2012) Haematological parameters of alloxan- induced diabetic rats treated with leaf essential oil of Hoslundia opposite. EXCLI Journal 11: 670-676.
Citation: Mari AE, Kwagh HJ, Terna GA, Akama FO, Vincent U (2020) Effect of Fermented Millet Flour Ibyer Supplemented with Ginger powder on Hematological indices and Body Weight of Wister albinorats J Protein Res Bioinform 2: 013
Copyright: © 2020 Adakole Maria Eji, et al. This is an open-access article distributed under the terms of the Creative Commons Attribution License, which permits unrestricted use, distribution, and reproduction in any medium, provided the original author and source are credited.