Estimation and Investigation of the Variability of Tropospheric Radio Refractivity and Radio Field Strength over Accra, Ghana
*Corresponding Author(s):
DO AkpootuDepartment Of Physics, Usmanu Danfodiyo University, Sokoto, Nigeria
Tel:+234 7038918403,
Email:profdon03@yahoo.com; davidson.odafe@udusok.edu.ng
Abstract
In this study, the monthly and yearly variation of tropospheric radio refractivity was estimated using monthly average daily temperature, relative humidity and atmospheric pressure meteorological parameters during the period of fifteen years (2002 – 2016) for Accra, Ghana. The yearly and monthly variation of tropospheric radio refractivity with radio refractive index, absolute temperature, atmospheric pressure and relative humidity were also investigated. The yearly and monthly variation of dry and wet terms radio refractivity was also studied. The refractivity gradient, effective earth radius, field strength variability (FSV) and radio horizon distance were also estimated. The result in this study revealed that the tropospheric radio refractivity is higher during the rainy season than in the dry season. The highest and lowest monthly average values of tropospheric radio refractivity were found during the rainy and dry seasons in the months of April and January with 384.3566 N-units and 371.6318 N-units respectively. The annual average values of tropospheric radio refractivity shows that the highest value was found in the year 2016 with 384.2550 N-units and the lowest value in the year 2008 with 375.8681 N-units. The monthly and yearly dry term radio refractivity contributed 68.79 % and 68.78 % respectively to the total value of the radio refractivity while the major variation is by the wet term radio refractivity. The average refractivity gradient and the average effective earth radius (k – factor) estimated for Accra during the period under investigation were found to be -44.1405 N-units/km and 1.39 respectively suggesting that the propagation in this geographical location is mostly super – refractive. The highest and lowest mean values of FSV were found during the dry and rainy seasons in the months of January and June with 3.0998 dB and 0.0158 dB respectively.
Keywords
Tropospheric radio refractivity, Meteorological parameters, Radio field strength, Radio horizon distance, Rainy and dry seasons.
Introduction
Refractivity is the physical property of a medium as determined by its index of refraction and it is responsible for various phenomena in radio wave propagation such as ducting and scintillation, refraction and fading, range and elevation errors in radar acquisition [1]. There are two main layers that are of interest from a radio communication perspective. The first is the troposphere (lower atmosphere) which extends from the earth surface to an altitude of about 10 km at the earth poles and 17 km at the equator and tends to affect radio frequencies above 30 MHz [2]. The second is the ionosphere which is a region that extends from around 60 km up to 700 km producing ions and free electrons which affect radio signals at certain frequencies; typically those below 30 MHz.
As the urbanization of coastal cities dramatically increases around the world, so the need for radar and microwave communication services continues to surge. It is important to improve on the previous radio meteorological studies over these regions in order to mitigate the adverse effects of weather on radio propagation [3 – 10]. The weather phenomenon occurs in the troposphere, which is the lowest atmosphere with almost all the atmospheric water vapour content. It is a turbulent layer that generates weather, and its temperature decreases with altitude. The variations in the vertical profiles of the refractive index and its gradients are responsible for the changes in the trajectory of radio waves in the troposphere. It was noted that occurrence of anomalous propagation is due to deviation of the vertical gradient of refractive index when atmospheric temperature and humidity distributions deviate from the normal / standard radio atmospheric conditions [11, 12].
Changes in the value of the troposphere radio refractive index can curve the path of the propagating radio wave. At standard atmospheric conditions near the Earth’s surface, the radio refractive index is approximately 1.0003 [13]. In characterizing a radio channel, surface (ground level) and elevated refractivity data are often required; and in particular, the surface refractivity is very useful for prediction of some propagation effects [13, 14]. Local statistics of refractivity, such as refractivity gradient, provide the most useful indication of the likely occurrence of refractivity-related effects required for prediction methods [15].
In radio frequency telecommunications, field strength is the magnitude of the received electromagnetic field which will excite a receiving antenna and thereby induce a voltage at a specific frequency in order to provide an input signal to a radio receiver [16]. How far a radio signal will travel within the radio horizon is determined by the distribution of the radio refractivity [16]. Several researchers like Žilinskas et al [12]; Adediji et al [16]; Akpootu and Iliyasu [17]; Agbo [18]; Ayantunji et al [19]; Emmanuel et al [20]; Luhunga et al [21] and Ajileye [22] have carried out studies on radio refractivity for different regions and climates using measured local meteorological data in Nigeria and other parts of the world. The results of their study showed that the local climate has a substantial influence on the radio refractivity and consequently on the transmitted radio signals. Similarly, researchers like Adediji et al [16]; Ajewole et al [23]; Adediji et al [24] and Akpootu et al [25] have studied electromagnetic wave (EMW) medium interaction processes and the propagation implications over Nigeria, especially the study of variation of radio field strength and radio horizon distance over few stations in Nigeria. As a result of the variation of meteorological parameters in each geographical location; it is inadequate to generalize the variation of radio field strength and radio horizon distance over Nigeria. There is no account of any study related to radio refractivity in Accra, Ghana shown in the literature as at the time of this study. However, the authors have not claimed that there is completely no work on radio refractivity in Accra, Ghana.
The purpose of this study is to (i) estimate the yearly and monthly variation of tropospheric radio refractivity over Accra, Ghana using meteorological parameters of atmospheric pressure, relative humidity and temperature data during the period of fifteen years (2002 – 2016) (ii) investigate the yearly and monthly variation of tropospheric radio refractivity with radio refractive index, absolute temperature, atmospheric pressure and relative humidity (iii) investigate the yearly and monthly variation of dry and wet terms radio refractivity (iv) investigate field strength variability for the location (v) establish an expression for estimating radio horizon distance for the location.
Study Area
The climate of Ghana is tropical with two main seasons: the wet and the dry seasons [26]. North Ghana experiences its rainy season from April to mid-October while South Ghana experiences its rainy season from March to mid-November [26]. The tropical climate of Ghana is relatively mild for its latitude [26]. The harmattan, a dry desert wind, blows in north-east Ghana from December to March, lowering the humidity and causing hotter days and cooler nights in northern part of Ghana [26].
Average daily temperatures range from 30°C (86°F) during the day to 24°C (75°F) at night with a relative humidity between 77 % and 85 % [26]. In the southern part of Ghana, there is a bi-modal rainy season: April through June and September through November [26]. Squalls occur in the northern part of Ghana during March and April, followed by occasional rain until August and September, when the rainfall reaches its peak [26]. Rainfall ranges from 78 to 216 cm (31 to 85 inches) a year [26].
In Accra, the wet season is mostly cloudy, the dry season is partly cloudy, and it is hot and oppressive year round. Over the course of the year, the temperature typically varies from 74°F to 91°F and is rarely below 73°F or above 93°F [26]. The hot season lasts for 5.8 months, from November 17 to May 11, with an average daily high temperature above 89°F. The hottest day of the year is February 25, with an average high of 91°F and low of 79°F [26]. The cool season lasts for 2.2 months, from July 3 to September 9, with an average daily high temperature below 83°F. The coldest day of the year is August 7, with an average low of 74°F and high of 81°F.
In Accra, the average percentage of the sky covered by clouds experiences significant seasonal variation over the course of the year. The clearer part of the year in Accra begins around June 27 and lasts for 7.5 months, ending around February 11. On December 25, the clearest day of the year, the sky is clear, mostly clear, or partly cloudy 59% of the time, and overcast or mostly cloudy 41% of the time [26]. The study area under investigation is Accra (Latitude 5.6 °N, Longitude -0.16 °W and altitude 68 m above sea level) with weather station number 654720 (DGAA) as shown in figure 1.
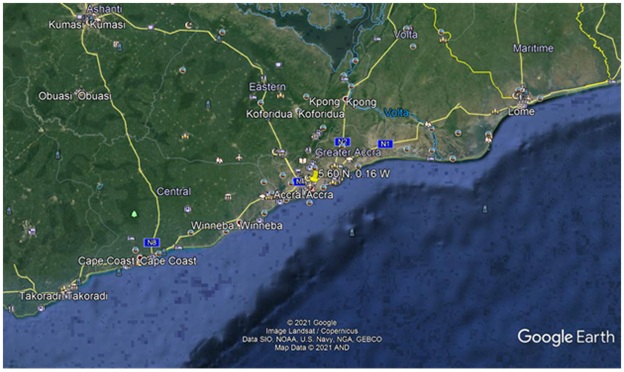
Figure 1: Google map showing the location under investigation
Methodology
The measured daily climatic data of atmospheric pressure, relative humidity and temperature utilized in this present work were obtained online from the Tutiempo Network, S.L (en.tutiempo.net/climate/ws-654720.html). The daily data were averaged into monthly data. Also, the monthly data were averaged into yearly data. To avoid possible misleading indications related to yearly variation in weather condition, the period under investigation is fifteen years (2002 – 2016) in order to obtain a good climatological average. The quality assurance of the meteorological measurements was determined by checking the overall consistency of the daily, monthly and yearly average of the climatic parameters used in the study area.
The atmospheric pressure, temperature and humidity (water vapour content) are basically the three factors upon which the refractive index, of the atmosphere depends on [25]. The values of the refractive index, , varies between 1.000250 and 1.000400 indicating that it is very close to unity at or near the earth’s surface and variation in this value is very small in time and in space. To make them more obvious, the refractive index, of air is measured by a quantity called the radio refractivity, which is related to the refractive index, as [13, 27].
n = 1+ N * 10-6 (1)
Although, the radio refractivity, , is a dimensionless quantity, it is expressed in N-units. Therefore from equation (1) it is easy to deduce that a typical range of will be between 250 and 400 N-units. In terms of meteorological parameters, the International Telecommunication Union (ITU) has recommended the radio refractivity, , to be expressed as [27].
N=77.6/T (P + 4810 e/T) = Ndry + Nwet (2)
with the “dry term” of radio refractivity given by:
Ndry = 77.6 * (P/T) (3)
and the “wet term” of radio refractivity given by:
Nwet = 3.73 * 105 * (e/T2) (4)
where is the atmospheric pressure (hPa), is the absolute temperature (K) and e is the water vapour pressure (hPa) . The dry term is due to non-polar nitrogen and oxygen molecules. It is proportional to pressure, P, and therefore, related to the air density. The wet term is proportional to vapor pressure and dominated by polar water contents in the troposphere.
It was mentioned in Freeman [13] and ITU-R [27] that the expression given in equation (2) may be used for all radio frequencies; for frequencies up to , the error is less than . At sea level, the average value of N≈315 [27] is used.
The relationship between water vapour pressure, e , and relative humidity is given by the expression as [27]:
e= (RH* es) / 100 (5)
where
es = a exp (bt / t +c) (6)
where RH is the relative humidity (%), t is the Celsius temperature (°C) and es is the saturation vapour pressure (hPa) at temperature (°C) . The values of the coefficients a, b and c (for water and ice) are presented in ITU-R [27]. In this study, that for water are adopted and are given as a=6.1121 b=17.502 and c =240.97 and are valid between -20° to +50° with an accuracy of ±0.20%. The radio refractivity, N, also decrease exponentially in the troposphere with height [27]:
N = Ns exp (-h / H) (7)
where N is the refractivity at the height h (km) above the level where the refractivity is Ns while H is the applicable scale height. ITU-R [27] suggested that at average mid-latitude, Ns and H are 315 and 7.35 km respectively. Hence, N as a function of height N (h) and is given by the expression
N = 315exp-0.136h (8)
However, the results of the work of Agunlejika and Raji [28] indicated that the model using the scale height of 7.35 km and 7 km as recommended for global environment [27] and tropical environment [29] respectively gave reasonably accurate results for the refractivity at the altitude of 50 m and 200 m for seven out of the twelve months of the year. Although the scale height of 7 km gave a better result at 50 m altitude while 7.35 km scale height gave a better performance at 200 m.
The refractivity gradient was obtained by differentiating equation (7) with respect to h , thus, we have the refractivity gradient as
dN /dh = (-Ns /H) exp(-h/H) (9)
For a standard atmosphere, the refractivity gradient is N-units/km. According to John [29], when h < 1 km, refractivity gradient is well approximated by its value in a standard atmosphere. In this study we used the typical values for a standard atmosphere [29], and obtained the refractivity of a standard atmosphere as Ns = 312 N - units.
In the troposphere, the vertical gradient of refractivity is an important parameter in estimating path clearance and propagation effects such as sub-refraction, super refraction, or ducting in accordance with the following conditions [30]:
-Sub-refraction: dN /dh > -40
The tropospheric radio refractivity increases with height and in this condition (sub-refraction), the radio wave moves away from the earth’s surface and the line of sight range and the range of propagation decrease consequently.
-Super-refraction: dN /dh < -40
For super-refractive to take place, the electromagnetic waves (EMW) are bent downward towards the earth. The extent at which it bends depends basically on the strength of the super-refractive condition. The radius of curvature of the ray path is smaller than the earth’s radius and the rays leaving the transmitting aerial at small angles of elevation will go through total internal reflection in the troposphere and then return to the earth at some distance from the transmitter. On reaching the earth’s surface and being reflected from it, the waves can skip large distances, thereby producing abnormally large ranges beyond the line of sight as a result of multiple reflections.
Ducting: dN /dh < -157
When the electromagnetic waves bend downwards with a curvature greater than that of the earth, ducting is said to take place. Radio energy bent downwards may be trapped between a boundary or layer in the troposphere and the surface of the earth or sea (surface duct) or between two boundaries in the troposphere (elevated duct). In this wave guide-like propagation, very high signal strengths can be attained at very long range (far beyond line-of-sight) and the signal strength may surpass its free-space value.
The effective earth radius factor k can be used to characterise refractive conditions as normal refraction or standard atmosphere, sub-refraction, super-refraction and ducting respectively. Thus, k may be expressed in terms of refractivity gradient, dN /dh as [13, 31 – 33].
k ≈ [1 + ((dN /dh) / 157) ]-1 (10)
Near the earth’s surface, dN /dh is about -39 N-units/km which gives an effective earth radius factor, = 4/3 . This is referred to as normal refraction or standard atmosphere. Here, radio signals travel on a straight line path along the earth’s surface and go out to space unobstructed.
If 4/3 > k > 0 Sub-refraction occurs, meaning that radio waves propagate abnormally away from the earth’s surface.
when ∞ > k > 4/3 In this case, Super-refraction occurs and radio waves propagate abnormally towards the earth’s surface thus extending the radio horizon. Lastly,
If -∞ < k < 0 ducting occurs and the waves bend downwards with a curvature greater than that of the earth.
Surface refractivity correlates highly with radio field strength especially at Very High Frequencies (VHF). In the frequency range 30-300 MHz, a factor of 0.2 dB change in field strength may be adopted for every unit change in Ns [9, 34]. Using the surface refractivity, Ns values obtained using equation (2), the maximum (Ns(MAX) ) and minimum (Ns(MIN) ) values of Ns are determined, from which the monthly range is obtained using the expression
Monthly Range = Ns(MAX) - Ns(MIN) (11)
An assessment of the field strength variability (FSV) in a given location is investigated from the monthly ranges of Ns using the expression [24].
FSV = (Ns(MAX) - Ns(MIN)) * 0.2 dB (12)
Near the surface (where refractivity gradient is approximately constant), the effective earth’s radius model is adequate for low-elevation terrestrial radio propagation studies. Under such conditions, the radio horizon becomes an important parameter in determining the coverage area of a terrestrial radio link, depending on the transmitter height [35]. The radio horizon distance, dRH is theoretically the maximum distance an unobstructed radio signal will travel from the transmitter before grazing the surface, and for a receiver to be effective, it must be installed within that distance. The radio horizon distance depends on the transmitter height, hT and value of Ns in the station, and may be obtained using the expression given by [15] as:
dRH = √2krhT (13)
where k is the effective earth radius factor and r is the earth’s radius (6370 km).
Results And Discussion
Radio Refractivity And Its Variation With Other Meteorological Parameters
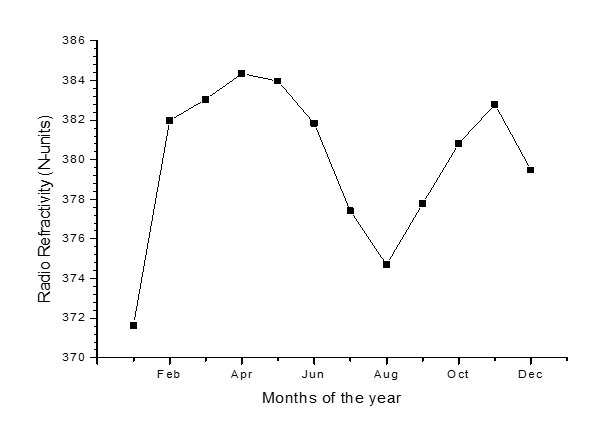 Figure 2: Monthly mean variation of radio refractivity over Accra, Ghana
Figure 2 shows the monthly variation of radio refractivity for Accra during the investigation period. The values of radio refractivity increases from its minimum value of 371.6318 N – units in the month of January until it attained its maximum value of 384.3566 N – units in April; it further decreases sharply to August and then increases to November and dropped in December. It is pertinent to note from the figure that as dry harmattan season sets in by November, there was a sharp and steady fall in the values of radio refractivity until when it gets to its minimum value in January. The maximum and minimum monthly mean values of 384.3566 N – units and 371.6318 N – units were found in the months of April and January during the rainy and dry seasons respectively. The results revealed that high values of radio refractivity were observed during the rainy season with an average value of 380.1229 N – units and low value during the dry season with an average value of 379.7876 N – units. The monthly seasonal radio refractivity pattern of variation for Accra is similar to rain pattern. The value of radio refractivity dropped from April to August exhibiting a trough; this may be attributed to August break when there could be a short period of dryness. Similar observations were found in the study investigated by Akpootu and Iliyasu [17]; Emmanuel et al [20] and Akpootu et al [25].
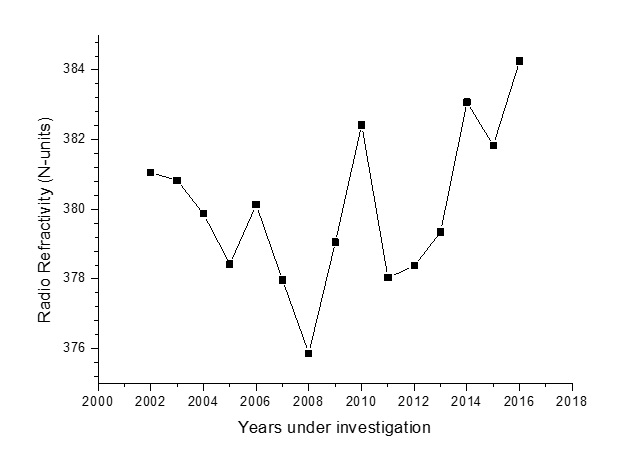 Figure 3: Annual variation of radio refractivity during the study period
Figure 3 shows the yearly variation of radio refractivity for Accra, Ghana during the period under investigation. The figure shows fluctuations in the pattern of variation which is attributed to the yearly variation of atmospheric weather parameters. The highest yearly average value of 384.2550 N – units was observed in the year 2016 and the lowest yearly average value of 375.8681 N – units in 2008.
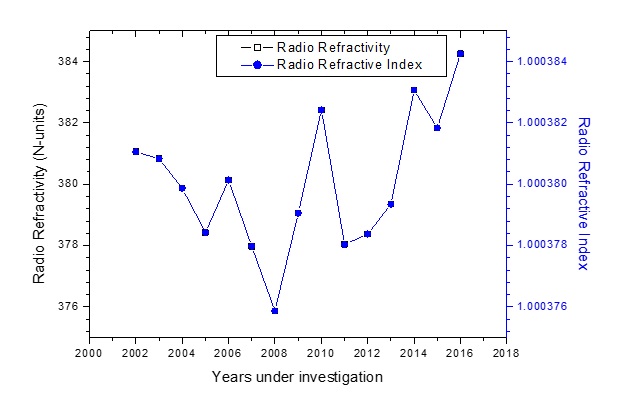 Figure 4: Yearly variation of radio refractivity with radio refractive index over Accra, Ghana
Figure 4 shows the yearly variation of radio refractivity with radio refractive index for Accra. The result indicated that the highest values of radio refractivity and radio refractive index were found in 2016 with 384.2550 N – units and 1.000384 N – units respectively while the lowest values of radio refractivity and radio refractive index were found in 2008 with 375.8681 N – units and 1.000376 N – units respectively.
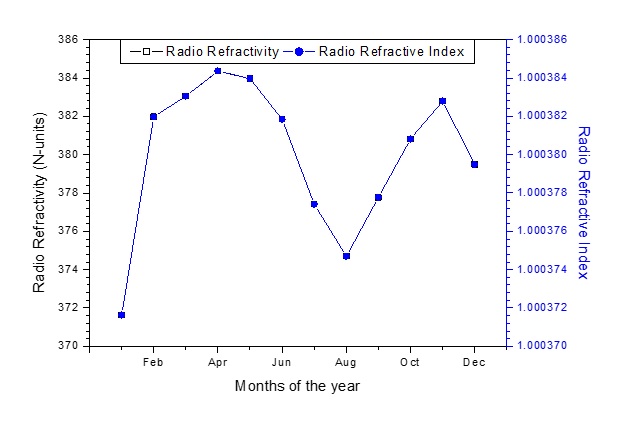 Figure 5: Monthly variation of radio refractivity with radio refractive index over Accra, Ghana
Figure 5 depicts the monthly variation of radio refractivity with refractive index for Accra. The result revealed that the radio refractive index and radio refractivity values shows similar pattern of variation. The maximum average values of radio refractive index is 1.000384 in the month of April while the minimum value is 1.000372 in January during the rainy and dry seasons respectively. The maximum and minimum average values of radio refractivity were found to be 384.3566 N-units and 371.6318 N-units in the months of April and January during the rainy and dry seasons respectively.
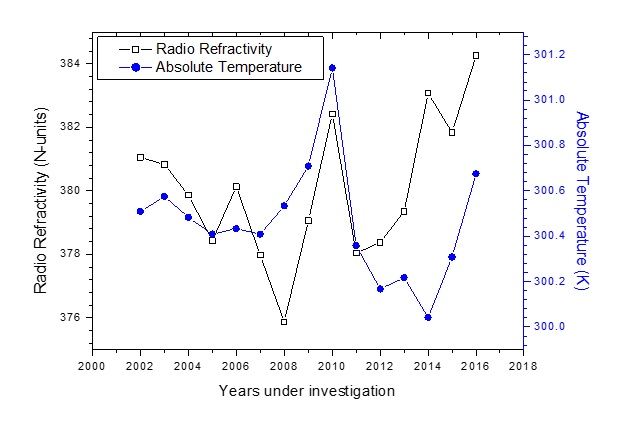 Figure 6: Yearly variation of radio refractivity with absolute temperature over Accra, Ghana
Figure 6 shows the yearly variation of radio refractivity with absolute temperature for Accra. The results revealed fluctuations in the values of radio refractivity and absolute temperature throughout the period under investigation. The highest average yearly absolute temperature is in the year 2010 and the lowest is in the year 2014. The highest and lowest average yearly radio refractivity was found in the year 2016 and 2008 respectively. In the year 2010 both the radio refractivity and absolute temperature depicts a crest indicating that as the radio refractivity increases or decreases the absolute temperature follows similar pattern of variation. The radio refractivity and absolute temperature decreases from 2003 to 2005.
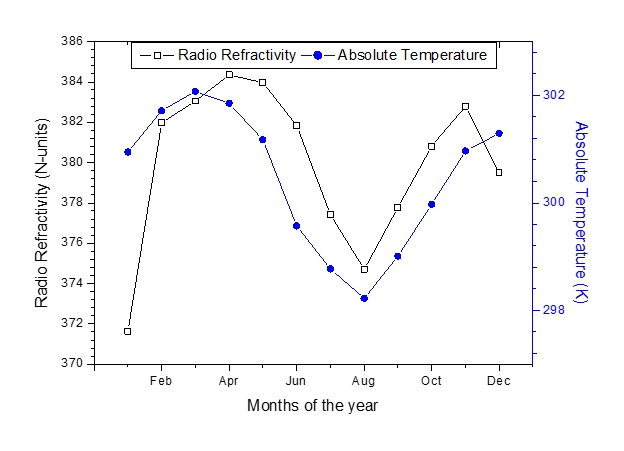 Figure 7: Monthly variation of radio refractivity with absolute temperature over Accra, Ghana
Figure 7 shows the monthly variation of radio refractivity with absolute temperature for Accra. The highest and lowest average monthly absolute temperatures were found in the month of March and August with 302.0733 K and 298.2267 K respectively. The radio refractivity and absolute temperature increases from January to March while the radio refractivity increases to April. Both decrease from April to August indicating a trough in this month. The radio refractivity and absolute temperature increases from August to November. However, the radio refractivity decreases from November to December while the absolute temperature increases from November to December.
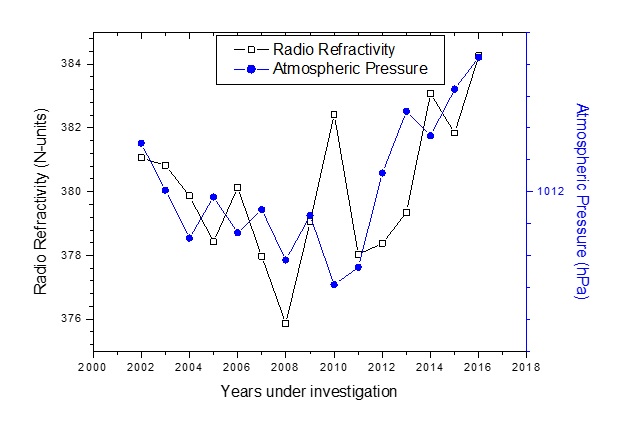 Figure 8: Yearly variation of radio refractivity with atmospheric pressure over Accra, Ghana
Figure 8 shows the yearly variation of radio refractivity with atmospheric pressure for Accra. The result shows fluctuations in their values throughout the period under study. The highest and lowest average yearly values of atmospheric pressure were found in the year 2016 and 2010 with 1012.8417 hPa and 1011.4167 hPa respectively.
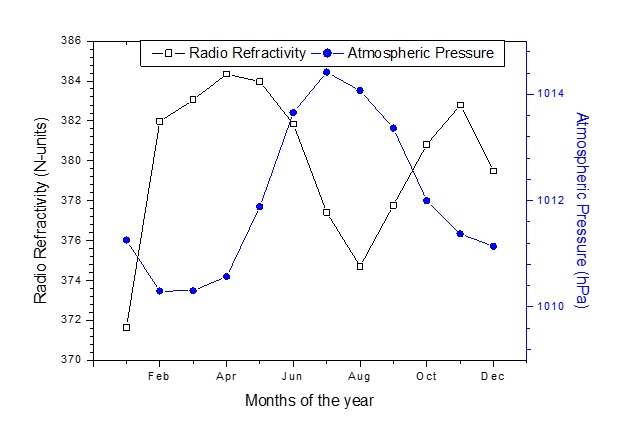 Figure 9: Monthly variation of radio refractivity with atmospheric pressure over Accra, Ghana
Figure 9 shows the monthly variation of radio refractivity with atmospheric pressure for Accra. The figure revealed that an opposite relationship exist between them. The atmospheric pressure decrease from January to its minimum value of 1010.3000 hPa in February and then decrease steadily from February to its maximum value of 1014.0700 hPa in August; and then decreases to December. The figure from the analysis showed that as the maximum value with a dip upward was found for the atmospheric pressure a dip downward was also noticed for the radio refractivity in August indicating that during August break Accra experiences the highest value of atmospheric pressure; this observation is in line with those carried out by Akpootu and Iliyasu [17] for Ikeja, Nigeria and Akpootu et al [25] for Osogbo, Nigeria.
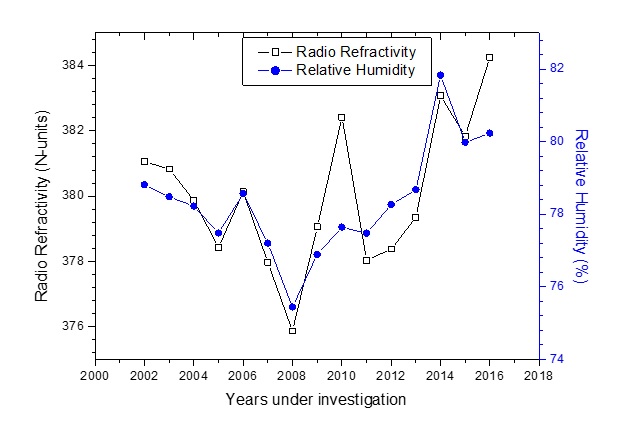 Figure 10: Yearly variation of radio refractivity with relative humidity over Accra, Ghana
Figure 10 shows the yearly variation of radio refractivity with relative humidity for Accra. The result showed fluctuations in their values throughout the period under investigation. The radio refractivity and relative humidity decreases from the year 2002 to 2005 and increases to 2006 and then decreases in 2008. The radio refractivity and relative humidity increases from 2008 to 2010 and then decreases to 2011 and increases to 2014 and then decreases in 2015 and finally increases to 2016. The highest and lowest yearly average values of radio refractivity were found in the year 2016 and 2008 with 384.2550 N – units and 375.8681 N – units respectively while the highest and lowest yearly average values of relative humidity were found in the year 2014 and 2008 with 81.8333 % and 75.4417 % respectively. The result from this analysis as shown from the figure revealed that the radio refractivity and relative humidity for Accra has a direct relationship.
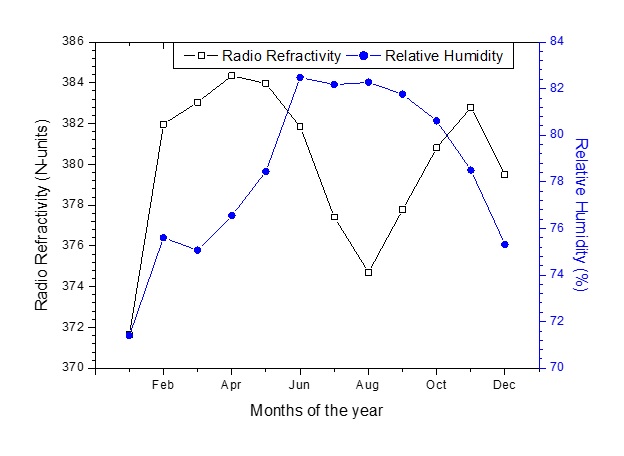 Figure 11: Monthly variation of radio refractivity with relative humidity over Accra, Ghana
Figure 11 shows the monthly variation of radio refractivity with relative humidity for Accra. The radio refractivity and relative humidity increases from their minimum values of 371.6318 N – units and 71.4000 % in the month of January while the radio refractivity increases and attained its maximum value of 384.3566 N – units in April, the relative humidity increases to February and then decreases in March and then increases until it attained its maximum value of 82.4867 % in June. The radio refractivity decreases from April to August and then increases to November and dropped in December while the relative humidity decreases in August and then increase slightly to September and then decreases continuously to December.
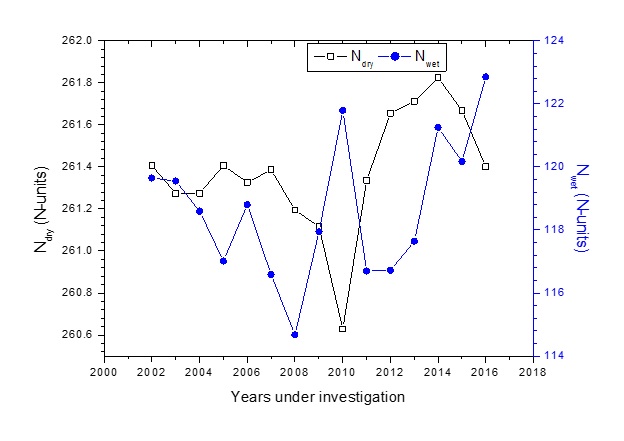 Figure 12: Yearly variation of dry and wet terms radio refractivity over Accra, Ghana
Figure 12 shows the yearly variation of dry and wet terms radio refractivity for Accra. The result shows fluctuations in their respective values throughout the studied period. The highest and lowest dry term radio refractivity were found in the year 2014 and 2010 with 261.8228 N – units and 260.6279 N – units respectively while the highest and lowest wet term radio refractivity were found in the year 2016 and 2008 with 122.8547 N – units and 114.6728 N – units respectively. The result revealed that as low value of dry term radio refractivity were recorded in 2010 high value of wet term radio refractivity were recorded in the same year.
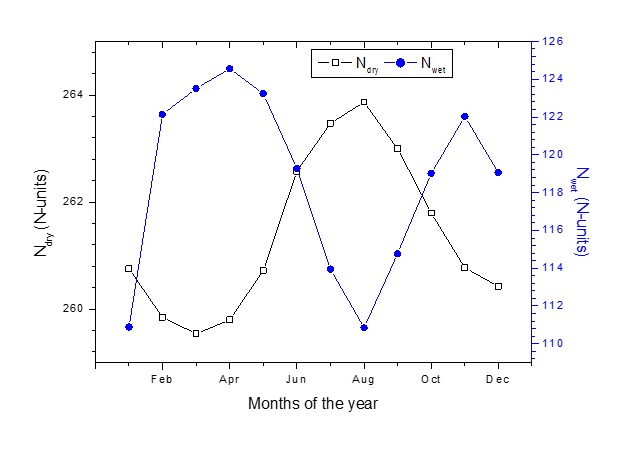 Figure 13: Monthly variation of dry and wet terms radio refractivity over Accra, Ghana
Figure 13 depicts the monthly variation of dry term radio refractivity (Ndry) and wet term radio refractivity (Nwet) for Accra. The result from the analysis showed that the dry term radio refractivity contributes more to the total value of the radio refractivity for Accra. The pattern of variation of the wet term radio refractivity is similar to that of the radio refractivity while the dry term radio refractivity exhibit similar variation with the atmospheric pressure except that the minimum values of dry term radio refractivity and atmospheric pressure were found in the months and March and February respectively and this is similar to the study carried out by Akpootu et al [25], the pattern of variation indicates that the dry term radio refractivity is proportional to the atmospheric pressure and is related to air density.
Refractivity Gradient And Effective Earth Radius
The refractivity gradient obtained for Accra using equation (9) is N-units/km. This suggests that propagation in this location is mostly super-refractive, indicating that the electromagnetic waves are bent downward towards the earth. The degree of bending is a function of the strength of the super-refractive condition. As the refractivity gradient continues to decrease, the wave path’s curve will approach the radius of curvature of the earth. Super refraction occurs when the bending of the trajectory of propagating radio wave bends towards the ground surface is greater than its bending in case of normal positive refraction. Akpootu and Iliyasu [17] obtained refractivity gradient of N-units/km for Ikeja in the coastal region of Nigeria suggesting super refractive propagation. In another study Akpootu et al [25] obtained refractivity gradient of N-units/km for Osogbo located in the Guinea savannah region of Nigeria suggesting super refractive propagation.
The result of the effective earth radius, k – factor obtained for Accra using equation (10) is 1.39. This result also suggests that propagation in this geographic location is mostly super-refractive. Super refraction results from such meteorological conditions as a rise in temperature with increasing height (temperature inversion), or a marked decrease in total moisture content in the air, either of which will cause a reduction in the dielectric constant gradient with height. Under these conditions the k-factor increases resulting in an effective flattening of the equivalent earth’s curvature. One of the conditions which may cause this type of abnormal refraction is the passage of warm air over a cool body of water and water evaporation can cause an increase in moisture content and a decrease in temperature near the surface, therefore producing a temperature inversion [25]. However, it is not only the temperature inversion itself which causes the abnormal bending of the microwave beam. The large increase in water vapour content and hence, the dielectric constant near the surface further increases this effect. Akpootu and Iliyasu [17] obtained k – factor of 1.39 for Ikeja, Nigeria indicating super refractive propagation. In another study Akpootu et al [25] obtained k – factor of 1.37 for Osogbo, Nigeria indicating super refractive propagation.
Field Strength Variability (Fsv) And Radio Horizon Distance
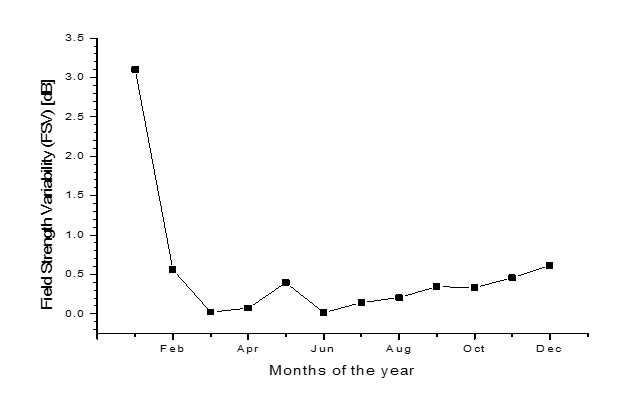 Figure 14. Monthly variation of field strength variability over Accra, Ghana
Equations (11) and (12) were used to investigate the field strength variability (FSV), the FSV of 2.5450 dB was obtained using two years data (2002 – 2003) alongside the fifteen years data (2002 – 2016). The highest and lowest FSV values of 3.0998 dB and 0.0158 dB were found in the months of January and June which corresponds to the period of dry and rainy seasons respectively. The result from the analysis as indicated from the figure revealed that high values of FSV are recorded during the dry season than in the rainy season. However, the FSV appears to be more stable during the rainy season; this findings is in agreement with the results reported by Adediji et al [24] for Akure, Nigeria and Akpootu et al [25] for Osogbo, Nigeria. The FSV values obtained for Accra in this study suggests that the output of the receiving antenna in this region may generally be subjected to changes not less than 0.0158 dB in a year but should not be greater than 3.0998 dB
Equation (13) was used to compute the radio horizon distance and the estimated equation is expressed as
The equation given in (14) can be used to estimate the radio horizon for Accra, Ghana if the transmitter height, hT is provided.
|
Month |
Ndry-Nwet |
%CNdry |
%CNwet |
|
Jan |
149.8793 |
5.7186 |
2.4316 |
|
Feb |
137.7190 |
5.6986 |
2.6784 |
|
Mar |
136.0238 |
5.6919 |
2.7088 |
|
Apr |
135.2367 |
5.6975 |
2.7317 |
|
May |
137.4793 |
5.7178 |
2.7028 |
|
Jun |
143.3017 |
5.7584 |
2.6157 |
|
Jul |
149.5342 |
5.7782 |
2.4988 |
|
Aug |
153.0276 |
5.7868 |
2.4308 |
|
Sep |
148.2209 |
5.7677 |
2.5171 |
|
Oct |
142.7734 |
5.7413 |
2.6102 |
|
Nov |
138.7414 |
5.7189 |
2.6762 |
|
Dec |
141.3727 |
5.7114 |
2.6109 |
|
Total |
|
68.7871 |
31.2129 |
Table 1. Monthly percentage contribution of Ndry and Nwet for Accra, Ghana
Table 1 shows the various monthly values of the percentage contribution by the dry term and wet term radio refractivity to the total radio refractivity (100 %). The result showed that the dry term radio refractivity contributes majorly to the total radio refractivity with approximately 68.79 % while the wet term radio refractivity has approximately 31.21 % for the region under investigation. The highest and lowest percentage contribution of dry term radio refractivity were found in the months of August and March with approximately 5.79 % and 5.69 % respectively while the highest and lowest percentage contribution of wet term radio refractivity were found in the months of April and August with approximately 2.73 % and 2.43 % respectively.
|
YEAR |
Ndry-Nwet |
%CNdry |
%CNwet |
|
2002 |
141.7587 |
4.5856 |
2.0989 |
|
2003 |
141.7179 |
4.5833 |
2.0972 |
|
2004 |
142.6787 |
4.5833 |
2.0804 |
|
2005 |
144.3912 |
4.5856 |
2.0527 |
|
2006 |
142.5213 |
4.5842 |
2.0841 |
|
2007 |
144.7987 |
4.5853 |
2.0452 |
|
2008 |
146.5225 |
4.5819 |
2.0116 |
|
2009 |
143.1740 |
4.5805 |
2.0689 |
|
2010 |
138.8390 |
4.5720 |
2.1364 |
|
2011 |
144.6365 |
4.5844 |
2.0472 |
|
2012 |
144.9320 |
4.5900 |
2.0476 |
|
2013 |
144.0743 |
4.5910 |
2.0636 |
|
2014 |
140.5733 |
4.5930 |
2.1270 |
|
2015 |
141.5027 |
4.5902 |
2.1080 |
|
2016 |
138.5455 |
4.5855 |
2.1551 |
|
Total |
|
68.7760 |
31.2240 |
Table 2. Yearly percentage contribution of Ndry and Nwet for Accra, Ghana
Table 2 shows the various yearly values of the percentage contribution by the dry term and wet term radio refractivity to the total radio refractivity (100 %). The result showed that the dry term radio refractivity contributes majorly to the total radio refractivity with approximately 68.78 % while the wet term radio refractivity has approximately 31.22 % for the region under investigation. The highest and lowest percentage contribution of dry term radio refractivity were found in the years 2014 and 2010 with approximately 4.5930 % and 4.5720 % respectively while the highest and lowest percentage contribution of wet term radio refractivity were found in the years 2016 and 2008 with approximately 2.1551 % and 2.0116 % respectively.
Conclusion
The international telecommunication union (ITU) method has been employed to estimate the yearly and monthly tropospheric radio refractivity over Accra, Ghana using meteorological parameters of temperature, relative humidity and atmospheric pressure during the period of fifteen years (2002 – 2016). The variation of these tropospheric radio refractivity with radio refractive index, absolute temperature, atmospheric pressure and relative humidity were investigated. The yearly and monthly variations of dry and wet terms radio refractivity was also studied. The refractivity gradient, effective earth radius and radio horizon distance were estimated. The field strength variability, the percentage contributions of the dry and wet terms radio refractivity to the total radio refractivity were also reported. The results in this study revealed that slightly higher values of monthly tropospheric radio refractivity were recorded in the rainy season than in the dry season with the highest and lowest values in the months of April and January with 384.3566 N-units and 371.6318 N-units respectively. The highest and lowest annual average values of tropospheric radio refractivity were found in the year 2016 and 2008 with 384.2550 N-units and 375.8681 N-units respectively. The radio refractivity and radio refractive index shows similar pattern of variation while other parameters revealed fluctuations at different points in the years and months. The refractivity gradient and effective earth radius found for Accra, Ghana during the period under investigation were -44.1405 N-units/km and 1.39 respectively indicating that the propagation in this region is mostly super-refractive. The highest and lowest values of field strength variability (FSV) was estimated in the months of January and June as 3.0998 dB and 0.0158 dB respectively; the implication of this values of FSV is that the output of a receiving antenna in the studied location may generally be subjected to changes not less than 0.0158 dB in a year and not greater than 3.0998 dB. The computed radio horizon distance for Accra is given by the expression in equation (14), however, the transmitter height has to be provided for its estimation. The monthly and yearly dry terms radio refractivity contributed 68.79 % and 68.78 % respectively to the total radio refractivity (100 %) while the wet term radio refractivity contributes to the major variation as they have similar pattern of variation.
Acknowledgements
The authors are grateful to the Tutiempo Network, S.L for providing all the necessary meteorological data used in this present study. The contribution and suggestions of the anonymous reviewers that led to improving the paper is well appreciated.
Competing Interests
Authors have declared that no competing interests exist.
References
- Gao J, Brewster K, Xue M (2008) Variation of Radio Refractivity with Respect to Moisture and Temperature and Influence on Radar Ray Path. Advances in Atmospheric Science, 25:1098 –1106.
- Hall MPM (1979) “Effects of the Troposphere on Radio Communication”. Institute of Electrical Engineers.
- Falodun SE, Ajewole MO (2006) Refractive index in the lowest 100 m layer of the troposphere in akure, south-western Nigeria, Journal of Atmospheric and Solar-Terrestrial Physics 68: 236-243.
- Falodun SE, Kolawole LB (2004) Incidence of surface duct during harmattan in akure, south-western Nigeria, Journal of Research in Science and Management.School of Sciences, F.U.T. Akure.
- Falodun SE, Okeke PN (2013) Radiowave propagation measurements in Nigeria (preliminary reports), Theoretical and Applied Climatology 113:127-135. doi:10.1007/s00704-012-0766-z. URL http://dx.doi.org/10.1007/s00704-012-0766-z
- Hughes KA (1993) Radiowave propagation data from tropical regions: A brief review, in: SMR on Radiowave Propagation in Tropical Regions, Trieste, Italy, 1993
- Kolawole LB (1993) Radiowave propagation in tropical regions, Tech. rep., ICTP, Trieste, Italy.
- Kolawole LB (1981) Vertical profiles of radio refractivity over Nigeria, Journal West African Science Association 26: 41-60.
- Owolabi IE, Williams VA (1970) Surface radio refractivity patterns in Nigeria and the Southern Cameroon. Journal of West Africa Science Association, 1, 3–17.
- Willoughby AA, Aro TO, Owolabi IE (2002) Seasonal variations of radio refractivity gradients in Nigeria, Journal of Atmospheric and Solar-Terrestrial physics 64:417-425.
- Battan LJ (1973) Radar observation of the atmosphere. The University of Chicago Press, Chicago, London.
- Žilinskas M, Tamošiunas S, Tamošiunaite M, Tamošiuniene M (2011) Yearly, Seasonal and daily variations of radio refractivity. Journal of Physical Aspects of Microwave and Radar Applications 119:533- 536.
- Freeman RL (2007) Radio system design for telecommunications (3rd Ed.).New York: Wiley-Inter Science.
- Oyedum OD, Gambo GK (1994) Surface radio refractivity in Northern Nigeria. Nigerian Journal of Physics, 6, 36–41.
- Bean BR, Dutton EJ (1968) Radio meteorology. New York: Dover Publication Co.
- Adediji AT, Adebusola SO, Ojo JS (2017) Variability of Microwave Radio Refractivity and Field Strength over Some Selected Locations in Nigeria.Physical Science International Journal 14: 1 -11.
- Akpootu DO, Iliyasu MI (2017) Estimation of Tropospheric Radio Refractivity and Its Variation with Meteorological Parameters over Ikeja, Nigeria. Journal of Geography, Environment and Earth Science International 10: 1-12. DOI: 10.9734/JGEESI/2017/32534
- Agbo GA (2011) Tropospheric refractivity dependence on atmospheric weather conditions in Jos Nigeria. Journal of Basic Physical Research. 2(2):2-6.
- Ayantunji BG, Okeke PN Urama JO (2011) Diurnal and seasonal variation of surface refractivity over Nigeria.Progress in Electromagnetics Research 30:201-222.
- Emmanuel I, Adeyemi B Adedayo KD (2013) Regional variation of columnar refractivity with meteorological variables from climate monitoring satellite application facility (CM SAF) data over Nigeria.International Journal of Physical Sciences. 8(17):825–834.
- Luhunga PM, Mutayoba E, Masoud H, Chang’a L, Prodanov AD et al (2014) Analysis of tropospheric radio refractivity over Julius Nyerere International Airport, Dar es Salaam 1:21–31.
- Ajileye OO (2015) Long-term average of effective earth radius factor over West Africa using satellite meteorological dataset.International Journal of Electronics Communication and Computer Engineering 6:175–179.
- Ajewole MO, Oyedum OD, Adediji AT, Moses AS, Eiche JO et al (2013) Spatial Variability of VHF/UHF Electric Field Strength in Niger State, Nigeria.International Journal of Digital Information and Wireless Communications (IJDIWC), The Society of Digital Information and Wireless Communications. 3: 231-239.
- Adediji AT, Ismail M, Mandeep JS (2014) Performance analysis of microwave radio refractivity on radio field strength and radio horizon distance over Akure, Nigeria, Wireless Personal Communications. 79:1893–1909 DOI 10.1007/s11277-014-1963-0
- Akpootu DO, Said RS, Mustapha W, Arewa SP, Sulu HT, Iliyasu MI, Salifu SI et al (2019) Performance Analysis of Tropospheric Radio Refractivity on Radio Field Strength and Radio Horizon Distance and Its Variation with Meteorological Parameters over Osogbo, Nigeria. International Journal of Advances in Scientific Research and Engineering (ijasre). 5(10): DOI: 10.31695/IJASRE.2019.33545
- Wikipedia (2021) Accessed online on 8th August, 2021.
- International Telecommunication Union recommendation, ITU-R (2003) The radio refractive index: Its formula and refractivity data. 453–459.
- Agunlejika O, Raji TI (2010) Validation of ITU-R model for atmospheric refractivity profile in a tropical region.International Journal of Engineering and Applied Sciences (IJEAS) 2: 72-82.
- John SS (2005) Introduction to RF propagation John Wiley and Sons, Inc. Hoboken, New Jersey.
- Adediji AT, Ajewole MO (2008) Vertical profile of radio refractivity gradient in Akure South West Nigeria Progress in Electromagnetics Research C 4:157-168.
- Hall MPM (1989) Effect of the troposphere on radio communication, IEEE electromagnetic wave series, Peter Peregrinus Ltd, United Kingdom.105-116.
- Afullo TJ, Motsoela T, Molotsi DF (1999) Refractivity Gradient and k-factor in Botswana.Radio Africa.107-110.
- Maitham A, Asrar VHS (2003) Signal strength measurement at VHF in the eastern region of Saudi Arabia. Arabian Journal for Science and Engineering. 28: 3–18.
- CCIR Report (1959) No 147, Los Angeles, 1959.
- Oyedum OD (2009) Seasonal variability of radio field strength and horizon over Northern and Southern Nigeria. Nigeria Journal of Pure and Applied Physics, 5, 97–104.
Citation: Akpootu D O, Idris M, Nouhou I, Iliyasu M I, Aina A O et al (2021) Estimation and Investigation of the Variability of Tropospheric Radio Refractivity and Radio Field Strength over Accra, Ghana. J Atmos Earth Sci 5: 026.
Copyright: © 2021 DO Akpootu, et al. This is an open-access article distributed under the terms of the Creative Commons Attribution License, which permits unrestricted use, distribution, and reproduction in any medium, provided the original author and source are credited.