Evaluation of Body Weight and Body Condition Score In 64 European Adult Cats
*Corresponding Author(s):
Gerardo SianiDVM, Salerno, Italy
Tel:+39 3318214279,
Email:info@drsiani.com
Abstract
The aim of the present study was to determine the ideal body weight (BW) and to establish if body condition score (BCS) was affected by lifestyle, feeding habits, and health status in adult client-owned European cats population. Sixty-four European adult cats were weighed, scored (BCS 1-9 point scale) and divided into three groups: BCS < 5, 5 and >5. Information on lifestyle (indoor or outdoor), health status (healthy or unhealthy), type of diet (homemade, commercial and mixed diet), food administration (weighed or unweighed) and snacks administration (administration or no administration) were recorded. The ideal BW was established in 5.3 kg for males and in 4 kg for females. In this study population it was shown that BCS was affected by sex status, health status and lifestyle but not by feeding habits. More information on the characteristics of food delivered in terms of energy content and nutrients profile should be collected in order to assess the influence of feeding habits on BCS.
Keywords
Body Condition Score; Cat; Diet
Introduction
Canine and feline obesity rates have reached pandemic proportions similar to those in humans, with a reported prevalence of overweight and obese cats ranging from 11.5% to 63% in developed countries [1,2]. Obesity is currently one of the greatest health and welfare problems facing domestic cats around the world [1]. Obesity is a condition in which an excess body fat has developed to the point that health is adversely affected [3,4]. There is no universally accepted definition of canine and feline obesity [5]. However, the American Veterinary Medical Association (AVMA) has endorsed a recommendation for a uniform definition, whereby obesity is present when a dog or cat is >30% above its ideal body weight (BW) [6]. The body condition score (BCS) is the most widely accepted method to document adiposity in companion animals [7] by assessing visual and palpable characteristics, such as subcutaneous and abdominal fat. This method has the advantage to be quick and easy to perform, and its scores have been demonstrated to correlate well with body fat mass determined via dual-energy X-ray absorptiometry (DEXA), both when used by trained individuals and when assessed by inexperienced ones [8]. The 1 to 9 point scale system is the most commonly used and the ideal BCS is considered to be 5/9. Cats with BCS 6/9 and 7/9 are considered overweight with an estimated excess BW of 10 and 20%, respectively, whereas cats with BCS 8/9 and 9/9 are considered obese with an estimated excess BW equal or above 30%, respectively [7]. Overweight and obesity undermine cats’ quality of life both directly and indirectly via various diseases known to be associated with these conditions [2,9]. Overweight and obese cats are at increased risk for developing urinary tract diseases, respiratory diseases, orthopaedic problems, reduced insulin sensitivity, diabetes mellitus, hepatic lipidosis, neoplasia, dermatological issues, oral diseases and hypertension [10-13]. Different risk factors have been associated to overweight and obesity in cats: indoor lifestyle, neutering, low activity level, male gender, age, use of treats and ad libitum feeding [2,14-17].
Considering the negative impact of the BCS increase on the health status of the cats, the aim of the present study was to assess the ideal BW in a population of client-owned European cats and to evaluate whether BCS was influenced by lifestyle, feeding habits and health status.
Materials and Methods
Sixty-four European Shorthair adult (≥1 year) cats were weighed and BCS was evaluated using a 1 to 9 point scale [7] in a veterinary practice during clinical consultations. Moreover, BW was measured. In all cats,both weight detection and BCS assessment were evaluated by veterinary nutritionists. For each cat, further information were collected such as age, sex status (intact female, spayed female, intact male, spayed female), lifestyle (“indoor” or “outdoor”), health status (“unhealthy” if the cat was presented for a symptom or if a disease was diagnosed , “healthy” if no symptom was present or if no disease was diagnosed), type of diet (“homemade”; “commercial” - dry and/or wet -; “homemade and commercial”), food weighing (“weighed”, if a scale was used to weigh food or “unweighed” if a scale was not used or other methods were used such as measuring cups) and administration of snacks including both commercial and home-made snacks (“administration” if snack was given or “no administration” if no snack was given). According to the BCS, cats were divided into three groups: BCS <5/9 (underweight), 5/9 (lean) and >5/9 (overweight). In order to assess whether the BCS is affected by this several information, the Anova test was employed as statistical hypothesis test. A p-value ≤ 0.05 was considered statistically significant whereas p-value <0.10 was considered tendential.
Results And Discussion
The test population included 64 cats: 30 females (28 neutered - 2 intact), 34 males (28 neutered - 6 intact), of which 54 indoor, 10 outdoor, 27 healthy, 37 unhealthy, 56 fed commercial diet (10 only dry food, 44 dry and wet food, 2 only wet food, 8 mixed with home-made ingredients), 8 fed weighed food and 56 fed unweighed food, 57 received snack administration. Twelve (19%) cats were scored BCS <5/9, 33 (51%) BCS 5/9 and 19 (30%) BCS >5/9. (Table 1) shows a descriptive analysis of the cat population as a function of BCS group. The mean BW in the BCS 5/9 group was 5.3 ± 0.6 for males and 4.0 ± 0.7 kg for females. The mean BW in the BCS <5/9 group was 3.6 ± 0.7 kg for males and 3.2 ± 0.4 kg for females. The mean BW in the BCS >5/9 group was 6.7 ± 1.2 kg for males and 6.4 ± 1.5 kg for females. (Table 2) shows the mean ± standard deviation BW of the cat population according to the parameters considered and divided by BCS group. BCS was significantly affected by sex (males > females, P < 0.0001), health status (healthy > unhealthy cats, P < 0.0001) and tendentially by lifestyle (indoor > outdoor cats, P=0.076), as shown in (Figure 1).
|
|
Total |
BCS <5 underweight |
BCS 5 lean |
BCS > 5 overweight |
|
Sex |
|
|||
|
Intact females |
2 |
0 |
2 |
0 |
|
Spayed females |
28 |
4 |
16 |
8 |
|
Intact males |
6 |
3 |
1 |
2 |
|
Spayed males |
28 |
5 |
14 |
9 |
|
Lifestyle |
|
|||
|
Indoor |
54 |
8 |
28 |
18 |
|
Outdoor |
10 |
4 |
5 |
1 |
|
Health status |
|
|||
|
Healthy |
27 |
2 |
15 |
10 |
|
Unhealthy |
37 |
10 |
18 |
9 |
|
Type of diet |
|
|||
|
Homemade diet |
0 |
0 |
0 |
0 |
|
Commercial and homemade |
8 |
2 |
3 |
3 |
|
Commercial dry |
10 |
1 |
7 |
2 |
|
Commercial dry and wet |
44 |
9 |
21 |
14 |
|
Commercial wet |
2 |
0 |
2 |
0 |
|
Food weighing |
|
|||
|
Weighed |
8 |
1 |
3 |
4 |
|
Unweighted |
56 |
11 |
30 |
15 |
|
Snacks administration |
|
|||
|
Administration |
7 |
1 |
4 |
2 |
|
No administration |
57 |
11 |
29 |
17 |
Table 1: European cat population divided in BCS groups.
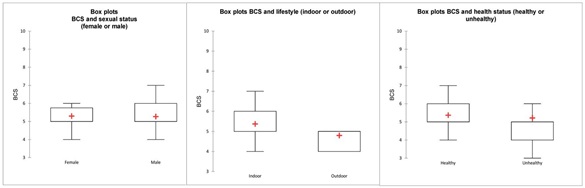
Figure 1: Box plots regarding the influence of gender, lifestyle and healthy status on body condition score (BCS) of the European cats. Red crosses represent the mean values. Boxes include 50% of the data distribution. The median values coincide with the first quartile (bottom line).
|
|
BW (Mean ± Standard Deviation) |
||
|
|
BCS <5 underweight |
BCS 5 lean |
BCS > 5 overweight |
|
Sex |
|
||
|
Females |
3.2 ± 0.4 |
4.0 ± 0.7 |
6.4 ± 1.5 |
|
Males |
3.6 ± 0.7 |
5.3 ± 0.6 |
6.7 ± 1.2 |
|
Lifestyle |
|
|
|
|
Indoor |
3.4 ± 0.6 |
4.5 ± 0.9 |
6.7 ± 1.4 |
|
Outdoor |
3.8 ± 0.7 |
4.9 ± 0.5 |
5.7 |
|
Health status |
|
||
|
Healthy |
3.1 ± 0.6 |
4.4 ± 1.0 |
6.0 ± 1.2 |
|
Unhealthy |
3.6 ± 0.6 |
4.7 ± 0.8 |
7.2 ± 1.3 |
|
Type of diet |
|
||
|
Homemade diet |
/ |
/ |
/ |
|
Commercial and homemade |
3.3 ± 0.3 |
4.3 ± 1.4 |
7.4 ± 1.0 |
|
Commercial dry |
3.0 |
4.9 ± 0.9 |
6.5 ± 2.1 |
|
Commercial dry and wet |
3.6 ± 0.7 |
4.4 ± 0.9 |
6.4 ± 1.3 |
|
Commercial wet |
/ |
4.9 ± 0.1 |
/ |
|
Food weighing |
|
||
|
Weighed |
4.2 |
4.5 ± 1.2 |
7.0 ± 0.3 |
|
Unweighted |
3.4 ± 0.6 |
4.6 ± 0.9 |
6.4 ± 1.5 |
|
Snacks administration |
|
|
|
|
Administration |
/ |
5.0 ± 0.6 |
5.9 ± 1.7 |
|
No administration |
3.5 ± 0.6 |
4.5 ± 0.9 |
6.7 ± 1.3 |
Table 2: Mean values and standard deviation of BW in different BCS groups of the European cat population.
BCS was not affected by feeding habits including type of diet (dry food > dry and wet food > only wet food > homemade and commercial, P=0.975), snack administration (administration > no administration, P=0.746) food weighing (weighed > unweighed, P=0.273), as shown in (Figure 2).
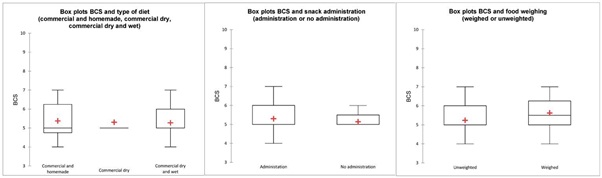
Figure 2: Box plots regarding the influence of feeding habits on body condition score (BCS) of the European cats. Red crosses represent the mean values. Boxes include 50% of the data distribution. The middle line inside the boxes represents the median value. If it does not appear it coincides with the first quartile (bottom line).
The aim of the present study was to assess the ideal BW in a population of client-owned European cats and to evaluate whether BCS was influenced by lifestyle, feeding habits and health status. In our study, mean BW in the BCS 5/9 group highlighted a sexual dimorphism suggesting an ideal BW of 4 kg for female European cats and an ideal BW of 5.3 kg for male European cats. Kienzle and Moik estimated the mean BW of cats belonging to several breeds including European cats [18]. They estimated a mean BW of 4.3 ± 0.77 kg for males and 3.5 ± 0.55 kg for females, confirming the difference between sexes emerged from our results. They proposed that, for the European cats of both sexes, a different ideal BW other than 4 kg should be used or an ideal BW for females and males should be identified. Moreover, they suggested that it is not feasible working with a 4 kg mean BW in a clinical setting or on nutrition guidelines, because it would overestimate a large percentage of the female feline population. However, this statement has not been confirmed by our results that confirmed a mean BW of 4 kg for female European cats [18]. We did not detect any association between food administration system and BCS. German et al. demonstrated inaccuracy in various amounts of commercial dry food measured out (ranging from an 18% underestimate to an 80% overestimate) for dogs and cats when using a measuring cup supplied by the manufacturer [19]. Coe et al. investigated the accuracy of three devices (one graduated-liquid measuring cup, a commercial food scoop and a dry-food measuring cup) and reported an inaccuracy ranged from a 47.83% underestimation to a 152.17% overestimation across all measuring devices and volumes [20]. Both studies, while expressing concern about the consequences of caloric excesses resulting from an inadequate food weight system, did not investigate the impact on BCS. Long terms studies are necessary to establish whether there is a correlation between the inaccuracy of the pet's daily ration weight method and the BCS. Russel et al. found that cats fed with snack administration and ad libitum feeding canned food had a higher BCS, concluding that these feeding habits were risk factors for obesity development in cats and suggested that the optimum feeding regimen to prevent obesity would be one based on weighed meals rather than an ad libitum meal [17]. This is in contrast with the results of our study that found no significant association between snack administration, ad libitum meals and BCS. Russel’s study did not take into consideration the health status of the cat population as we did. Our study revealed that sick cats tend to have a lower BCS. Sick cats may have a lower daily energy intake because of a decreased appetite or may need a higher daily energy requirement due to hypermetabolic state resulting from disease. However, other researchers did not confirm this negative association between health status and BCS. A positive association with BCS and dermatopathy, hypertension, asthma, diarrhea, ophthalmic conditions, allergic conditions, arthritis, diabetes mellitus, hepatic lipidosis, neoplasia, gastrointestinal, cardiac, musculoskeletal and oral diseases was reported [13,21]. However, assuming that acute and chronic diseases may affect BCS differently, it would be appropriate to analyze and consider these differences. Another factor that could have affected the discrepancy between our results and the Russell’s ones is the type of diet since diets may vary in metabolizable energy and protein, lipid and glucidic ratio. Increased weight gain and fat mass deposition were noted when cats were fed ad libitum a low-carbohydrates, high-fat diet in comparison to a high-carbohydrates, low-fat diet [22,23]. We did not analyze the composition of the diets and this is a limitation of our study. Indoor lifestyle can be a risk factor for overweight as confirmed by some authors [17,24,25]. Some researchers failed to show indoor lifestyle as a risk factor for overweight in cats [24,26]. In our study, indoor cats feature 84% of the studied population (this reflects the urban environment of the clinic where the animals were visited) and have a higher BCS. Since age can be considered a factor influencing BCS [4], this aspect should also have been evaluated in the study. This represented a limitation, because only for a very small percentage of the cats the date of birth was known for sure. Indeed, cats were enrolled on the basis that they had been living with their owner for more than 12 months and therefore considered with certainty to be adults.
Conclusion
This pilot study reveals that BCS is influenced by sex, health status and lifestyle. Our results did not confirm a positive association between feeding habits and BCS. Future studies should also consider the metabolizable energy and nutrient profile of the diets administered to better understand whether diet composition has an influence on BCS. Health status appears to be another parameter to be considered and compared to other factors to determine its influence on BCS.
Ethical approval
All procedures reported in this research were conducted in an ethical and responsible manner, in full compliance with all relevant testing codes and legislation.
Acknowledgments
The authors would like to thank the veterinary clinic Check-up vet (Salerno, Italy), Dr A. Vessa and Dr G. Marinacci, for support during the data acquisition process.
Data availability statement
Data supporting the findings of this study are available upon reasonable request from the corresponding author.
Competing interests
The authors declare that they have no competing interests.
References
- Wall M, Cave NJ, Vallee E (2019) Owner and cat-related risk factors for feline overweight or obesity. Front Vet Sci 6: 266.
- Chiang CF, Villaverde C, Chang WC, Fascetti AJ, Larsen JA (2022) Prevalence, risk factors, and disease associations of overweight and obesity in cats that visited the veterinary medical teaching hospital at the university of California, Davis from January 2006 to December 2015. Top Companion Anim Med 47: 100620.
- Kopelman PG (2000) Obesity as a medical problem. Nature 404: 635-643.
- Laflamme DP (2005) Nutrition for aging cats and dogs and the importance of body condition. Vet Clin North Am Small Anim 35: 713-742.
- Kipperman B, German A (2018) The responsibility of veterinarians to address companion animal obesity. Animals 8: 143.
- Ward E, German A, Churchill J (2019) The Global Pet Obesity Initiative Position Statement. Association for pet obesity prevention.
- Laflamme D (1997) Development and validation of a body condition score system for cats: a clinical tool. Feline Pract 25: 13-18.
- German AJ, Holden SL, Morris PJ, Biourge V (2010) Comparison of a bioimpedance monitor with dual-energy x-ray absorptiometry for noninvasive estimation of percentage body fat in dogs. Am J Vet Res 71: 393-398.
- Hanford R, Linder DE (2021) Impact of obesity on quality of life and owner’s perception of weight loss programs in cats. Vet Sci 8: 32.
- Biourge VC, Massat B, Groff JM, Morris JG, Rogers QR (1994) Effects of protein, lipid, or carbohydrate supplementation on hepatic lipid accumulation during rapid weight loss in obese cats. Am J Vet Res 55: 1406-1415.
- Scarlett JM, Donoghue S (1998) Associations between body condition and disease in cats. J Am Vet Med Assoc 212: 1725-1731.
- Öhlund M, Palmgren M, Holst BS (2018) Overweight in adult cats: a cross-sectional study. Acta Vet Scand 60: 5.
- Teng KT, McGreevy PD, Toribio JALML, Raubenheimer D, Kendall K, et al. (2018) Associations of body condition score with health conditions related to overweight and obesity in cats. J Small Anim Pract 59: 603-615.
- Anderson R (1973) Obesity in the dog and cat. Veterinary Annual 14: 182-186
- Sloth C (1992) Practical management of obesity in dogs and cats. J Small Anim Pract 33: 178-182.
- Scarlett JM, Donoghue S, Saidla J, Wills J (1994) Overweight cats: prevalence and risk factors. Int J Obes Relat Metab Disord 18: S22-S28.
- Russell K, Sabin R, Holt S, Bradley R, Harper EJ (2000) Influence of feeding regimen on body condition in the cat. J Small Anim Pract 41: 12-18.
- Kienzle E, Moik K (2011) A pilot study of the body weight of pure-bred client-owned adult cats. Br J Nutr 106: S113-S115.
- German AJ, Holden SL, Mason SL, Bryner C, Bouldoires C, et al. (2011) Imprecision when using measuring cups to weigh out extruded dry kibbled food. J Anim Physiol Anim Nutr (Berl) 95: 368-373.
- Coe JB, Rankovic A, Edwards TR, Parr JM (2019) Dog owner’s accuracy measuring different volumes of dry dog food using three different measuring devices. Vet Rec 185: 599-599.
- Lund E, Armstrong P, Kirk CA, Klausner JS (2006) Prevalence and risk factors for obesity in adult cats from private us veterinary practices. Int J Appl Res 3: 88-96.
- Nguyen PG, Dumon HJ, Siliart BS, Martin LJ, Sergheraert R, et al. (2004) Effects of dietary fat and energy on body weight and composition after gonadectomy in cats. Am J Vet Res 65: 1708-1713.
- Backus RC, Cave NJ, Keisler DH (2007) Gonadectomy and high dietary fat but not high dietary carbohydrate induce gains in body weight and fat of domestic cats. Br J Nutr 98: 641-650.
- Colliard L, Paragon BM, Lemuet B, Bénet JJ, Blanchard G (2009) Prevalence and risk factors of obesity in an urban population of healthy cats. J Feline Med Surg 11: 135-140.
- Rowe EC, Browne WJ, Casey RA, Gruffydd-Jones TJ, Murray JK (2017) Early-life risk factors identified for owner-reported feline overweight and obesity at around two years of age. Prev Vet Med 143: 39-48.
- Courcier EA, O’Higgins R, Mellor DJ, Yam PS (2010) Prevalence and risk factors for feline obesity in a first opinion practice in Glasgow, Scotland. J Feline Med Surg 12: 746-753.
Citation: Siani G, Ricci R (2023) Evaluation of Body Weight and Body Condition Score in 64 European Adult Cats. J Anim Res Vet Sci 7: 055.
Copyright: © 2023 Gerardo Siani , et al. This is an open-access article distributed under the terms of the Creative Commons Attribution License, which permits unrestricted use, distribution, and reproduction in any medium, provided the original author and source are credited.